# Pakketten wel installeren als je ze niet hebt
# Dat kan goed met Pacman, dat moet wel geinstalleerd zijn
pacman::p_load(
  tidyverse,
  akima,
  colorspace,
  corrr,
  cowplot,
  ggdark,
  ggforce,
  ggiraph,
  ggrepel,
  ggridges,
  ggsci,
  ggtext,
  ggthemes,
  grid,
  gridExtra,
  hrbrthemes,
  patchwork,
  rcartocolor,
  scico, showtext,
  shiny,
  plotly,
  highcharter,
echarts4r)Eigen inleiding
De afgelopen maand toch nog weer eens naar datavisualisatie gekeken en hoe je dat met R het beste kunt doen. Twee boeken nogeens gelezen hierover. Allereerst het boek van Rob Kabacoff Data Visualization with R. Het is een handige introducte op ggploten vooral een handige tutorial voor het visualiseren van data met R. Daarnaast het boek van Clause Wilke Fundamentals of Data Visualization dat meer een algemene reflectie is op data visualisatie. Het ga je op verschillende manieren van data naar visualisatie, wat zijn de onderliggende principes en waaraan moeten we bij datavisualisatie vooral denken. Toch heb ik de afgelopen maand vooral veel geleerd van Cédric Scherer. Ik zag dat hij op de conferentie van R binnenkort een inleiding geeft op het onderwerp datavisualisatie en zo zag ik via zijn Github site verschillend materiaal over datavisualisatie. Mooie en duidelijke inleidingen en twee ervan heb ik in het Nederlands overgezet. Hier vind je in ieder geval een algemene inleiding op ggplot. zie
Cédrics inleiding
Terug in 2016, moest ik (Cédric vanaf hier) mijn PhD inleidende lezing voorbereiden en begon ik ggplot2 te gebruiken om mijn gegevens te visualiseren. Ik hield nooit van de syntaxis en stijl van basisplots in R, dus ik was snel verliefd op ggplot. Vooral handig was zijn ‘faceting utility’. Maar omdat ik weinig tijd had, plotte ik deze figuren met vallen en opstaan en met behulp van veel googlen. De bron waar ik altijd op terugkwam was een blog post genaamd Beautiful plotting in R: A ggplot2 cheatsheet by Zev Ross, voor het laatst bijgewerkt in januari 2016.
Na het geven van de lezing, die een aantal fatsoenlijke plots bevatte dankzij de blog post, besloot ik om deze tutorial stap-voor-stap door te nemen. Ik heb er zoveel van geleerd en ben direct begonnen met het aanpassen van de codes. In de loop van de tijd heb ik extra code snippets, grafiektypes en bronnen toegevoegd.
Omdat het blogartikel van Zev Ross al enkele jaren niet meer werd bijgewerkt en dit stap voor stap een unieke versie van een tutorial werd, besloot ik om de bijgewerkte versie op mijn GitHub te hosten. Nu vindt het zijn juiste plaats op deze homepage! (Plus ik heb een groot aantal updates toegevoegd-om er maar een paar te noemen: - De fantastische patchwork, ggtext en ggforce pakketten.
- Hoe om te gaan met aangepaste lettertypen en kleuren.
- Een verzameling van R pakketten op maat gemaakt om interactieve grafieken te maken.
- En verschillende andere soorten grafieken, waaronder taartdiagrammen (omdat iedereen van taartdiagrammen houdt.
Grote veranderingen die ik heb aangebracht:
- de R-stijlgids volgen (bv. van Hadley Wickham, Google of de stijlgidsen van de Coding Club),
- om de stijl en esthetiek van plots te veranderen (bijv. as-titels, legenda’s en mooie kleuren voor alle plots, niet alleen sommige),
- om een bijgewerkte versie te hebben die de veranderingen in
ggplot2bijhoudt (huidige versie: 3.3.2),
- om gegevensimport aan te passen (GitHub bron),
- om extra tips toe te voegen over een breed scala aan onderwerpen, waaronder bijvoorbeeld grafiekkeuze, kleurenpaletten, aanpassen van titels, toevoegen van lijnen, aanpassen van legenda’s, annotaties met labels, pijlen en boxen, multi-panel plots, interactieve visualisaties, …
Voorbereiding
- U kunt het Rmarkdown-script met de code die in deze blogpost is uitgevoerd hier vinden.
- U kunt ook het R script met alleen de code hier downloaden.
- U dient de volgende pakketten te installeren om de volledige tutorial te kunnen uitvoeren:
- {ggplot2}, onderdeel van de {tidyverse} pakketverzameling
- {tidyverse} pakket verzameling, namelijk
- {dplyr} voor het ordenen van gegevens
- {tibble} voor moderne dataframes
- {tidyr} voor het opschonen van gegevens
- {forcats} voor het hanteren van factoren
- {colorspace} voor het manipuleren van kleuren
- {corrr} voor het berekenen van correlatiematrices
- {cowplot} voor het samenstellen van ggplots
- {ggdark} voor het thematiseren en inverteren van kleuren
- {ggforce} voor sina plots en andere coole dingen
- {ggrepel} voor mooie tekstlabels
- {ggridges} voor ridge plots
- {ggsci} voor mooie kleurenpaletten
- {ggtext} voor geavanceerde tekst rendering
- {ggthemes} voor extra thema’s
- {grid} voor het maken van grafische objecten
- {gridExtra} voor extra functies voor “raster”-grafieken
- {patchwork} voor multi-paneel plots
- {rcartocolor} voor geweldige kleurenpaletten
- {scico} voor perceptuele uniforme paletten
- {showtext} voor aangepaste lettertypen
- {shiny} voor interactieve apps
een aantal pakketten voor interactieve visualisaties
- {charter}
- {echarts4r}
- {ggiraph}
- {highcharter}
- {plotly}
(Om pedagogische redenen en als mensen naar een plot springen, laadt Cédric het benodigde pakket naast {ggplot2} in de betreffende sectie).
De dataset
De studie die we gebruiken is National Morbidity and Mortality Air Pollution Study (NMMAPS). Om de plots hanteerbaar te maken, beperken we de gegevens tot Chicago en 1997-2000. Voor meer details over deze dataset, raadpleeg Roger Peng’s boek Statistical Methods in Environmental Epidemiology with R. Je kunt de gegevens die we in deze tutorial gebruiken hier downloaden (maar dat hoeft niet).
We kunnen de data importeren in onze R sessie, bijvoorbeeld met read_csv() uit het readr pakket. Om later bij de gegevens te kunnen, slaan we ze op in een variabele genaamd chic met behulp van de toewijzingspijl: <-.
chic <- readr::read_csv("https://raw.githubusercontent.com/z3tt/ggplot-courses/main/data/chicago-nmmaps-custom.csv")Rows: 1461 Columns: 11
-- Column specification --------------------------------------------------------
Delimiter: ","
chr (3): city, season, month
dbl (7): temp, o3, dewpoint, pm10, yday, month_numeric, year
date (1): date
i Use `spec()` to retrieve the full column specification for this data.
i Specify the column types or set `show_col_types = FALSE` to quiet this message.De :: wordt naamruimte genoemd en kan worden gebruikt om toegang te krijgen tot een functie zonder het pakket te laden. Hier zou je ook library(readr) eerst kunnen uitvoeren en daarna “chic <- read_csv()”.
Laten we zien hoe de dataset eruit ziet.
tibble::glimpse(chic)Rows: 1,461
Columns: 11
$ city <chr> "chic", "chic", "chic", "chic", "chic", "chic", "chic", ~
$ date <date> 1997-01-01, 1997-01-02, 1997-01-03, 1997-01-04, 1997-01~
$ temp <dbl> 36.0, 45.0, 40.0, 51.5, 27.0, 17.0, 16.0, 19.0, 26.0, 16~
$ o3 <dbl> 5.659256, 5.525417, 6.288548, 7.537758, 20.760798, 14.94~
$ dewpoint <dbl> 37.500, 47.250, 38.000, 45.500, 11.250, 5.750, 7.000, 17~
$ pm10 <dbl> 13.052268, 41.948600, 27.041751, 25.072573, 15.343121, 9~
$ season <chr> "Winter", "Winter", "Winter", "Winter", "Winter", "Winte~
$ yday <dbl> 1, 2, 3, 4, 5, 6, 7, 8, 9, 10, 11, 12, 13, 14, 15, 16, 1~
$ month <chr> "Jan", "Jan", "Jan", "Jan", "Jan", "Jan", "Jan", "Jan", ~
$ month_numeric <dbl> 1, 1, 1, 1, 1, 1, 1, 1, 1, 1, 1, 1, 1, 1, 1, 1, 1, 1, 1,~
$ year <dbl> 1997, 1997, 1997, 1997, 1997, 1997, 1997, 1997, 1997, 19~head(chic, 10)# A tibble: 10 x 11
city date temp o3 dewpoint pm10 season yday month month_~1 year
<chr> <date> <dbl> <dbl> <dbl> <dbl> <chr> <dbl> <chr> <dbl> <dbl>
1 chic 1997-01-01 36 5.66 37.5 13.1 Winter 1 Jan 1 1997
2 chic 1997-01-02 45 5.53 47.2 41.9 Winter 2 Jan 1 1997
3 chic 1997-01-03 40 6.29 38 27.0 Winter 3 Jan 1 1997
4 chic 1997-01-04 51.5 7.54 45.5 25.1 Winter 4 Jan 1 1997
5 chic 1997-01-05 27 20.8 11.2 15.3 Winter 5 Jan 1 1997
6 chic 1997-01-06 17 14.9 5.75 9.36 Winter 6 Jan 1 1997
7 chic 1997-01-07 16 11.9 7 20.2 Winter 7 Jan 1 1997
8 chic 1997-01-08 19 8.68 17.8 33.1 Winter 8 Jan 1 1997
9 chic 1997-01-09 26 13.4 24 12.1 Winter 9 Jan 1 1997
10 chic 1997-01-10 16 10.4 5.38 24.8 Winter 10 Jan 1 1997
# ... with abbreviated variable name 1: month_numericHet ggplot2 pakket
ggplot2is a systeem voor het maken van grafieken gebaseerd op The Grammar of Graphics. Je levert de gegevens aan, verteltggplot2hoe variabelen af te beelden met een bepaalde esthetiek, welke grafische technieken te gebruiken en het zorgt voor de details.
Een ggplot is opgebouwd uit een paar basis elementen:
- Data: De ruwe data die je wil plotten.
- **Geometries*
geom_: De geometrische vormen die de gegevens zullen weergeven.
- Aesthetics
aes(): Esthetica van de geometrische en statistische objecten, zoals positie, kleur, grootte, vorm en transparantie.
- Scales
scale_: Kaarten tussen de gegevens en de esthetische dimensies, zoals gegevensbereik naar plotbreedte of factorwaarden naar kleuren.
- Statistical transformations
stat_: Statistische samenvattingen van de gegevens, zoals kwantielen, passende curven, en sommen.
- Coordinate system
coord_: De transformatie die wordt gebruikt om gegevenscoördinaten om te zetten in het vlak van de gegevensrechthoek.
- Facets
facet_: De ordening van de gegevens in een raster van plots.
- Visual themes
theme(): De algemene visuele standaardinstellingen van een plot, zoals achtergrond, rasters, assen, standaard lettertype, afmetingen en kleuren.
Het aantal elementen kan variëren, afhankelijk van hoe u ze groepeert en aan wie u het vraagt.
Een standaard ggplot
Allereerst, om de functionaliteit van ggplot2 te kunnen gebruiken, moeten we het pakket laden (dat we ook kunnen laden via tidyverse suite):
#library(ggplot2)
library(tidyverse)
De syntax van ggplot2 is anders dan die van basic R. Volgens de basiselementen heeft een standaard ggplot drie dingen nodig die je moet specificeren: de gegevens, de esthetiek en een geometrie.
We beginnen altijd met het definiëren van een plot-object door ggplot(data = df) aan te roepen, wat ggplot2 alleen vertelt dat we met die data gaan werken. In de meeste gevallen wil je twee variabelen plotten-één op de x-as en één op de y-as. Dit zijn positie-esthetica en dus voegen we aes(x = var1, y = var2) toe aan de ggplot() aanroep (ja, de aes() staat voor esthetica). Er zijn echter ook gevallen waarin men één of zelfs drie of meer variabelen moet specificeren.
We specificeren de gegevens buiten
aes()en voegen de variabelen toe waarnaar ggplot de esthetica binnenaes()tot uitdrukking brengt.
Hier maken we de variabele datum zichtbaar naar de x-positie en de variabele temp naar de y-positie. Later zullen we ook de variabelen toewijzen aan allerlei andere esthetica zoals kleur, grootte en vorm.
(g <- ggplot(chic, aes(x = date, y = temp)))
Hm, alleen een paneel wordt aangemaakt als je dit uitvoert. Waarom? Dat komt omdat ggplot2 niet weet hoe we de gegevens willen plotten-we moeten nog een geometrie opgeven!
Met ggplot2 kun je het huidige ggobject opslaan in een variabele van jouw keuze door het toe te wijzen aan een variabele, in ons geval genaamd g. Je kunt dit ggobject later uitbreiden door andere lagen toe te voegen, hetzij allemaal tegelijk of door het toe te wijzen aan dezelfde of een andere variabele.
Door haakjes te gebruiken tijdens het toewijzen van een object, zal het object onmiddellijk worden afgedrukt (in plaats van
g <- ggplot(...)en dangte schrijven schrijven we gewoon(g <- ggplot(...))).
Er zijn vele, vele verschillende geometrieën (geoms genoemd omdat elke functie gewoonlijk begint met geom_) die je standaard aan een ggplot kunt toevoegen (zie hier voor een volledige lijst) en nog meer die door uitbreidingspakketten worden aangeboden (zie hier voor een verzameling van uitbreidingspakketten). Laten we ggplot2 vertellen welke stijl we willen gebruiken, bijvoorbeeld door geom_pint() toe te voegen om een scatter plot te maken:
g + geom_point()
Nooi! Maar deze data kunnen ook gevisualiseerd worden als een lijnplot (niet optimaal, maar mensen doen dit soort dingen de hele tijd). Dus voegen we simpelweg geom_line() toe en voilá:
g + geom_line()
Je kunt ook verschillende geometrische lagen combineren - en dit is waar de magie en het plezier begint!
g + geom_line() + geom_point()
Dat is het voor nu over geometrieën. Geen zorgen, we gaan later nog verschillende plot types leren.
Verander de eigenschappen van geometrieën
Binnen het geom_* commando, kun je al visuele esthetiek manipuleren, zoals de kleur, vorm, en grootte van je punten. Laten we alle punten in grote vuurrode diamanten veranderen!
g + geom_point(color = "firebrick", shape = "diamond", size = 2)
ggplot2begrijpt zowel color als colour als de korte versie col.
*Je kunt voorgedefinieerde kleuren gebruiken (hier is een volledige lijst) of hex-kleurcodes, en zelfs RGB/RGBA kleuren gebruiken met rgb() functie.
Elke geom komt met z’n eigen eigenschappen (genoemd arguments) en hetzelfde argument kan in iets anders veranderen afhankelijk van de geom die je gebruikt.
g + geom_point(color = "firebrick", shape = "diamond", size = 2) +
    geom_line(color = "firebrick", linetype = "dotted", size = .3)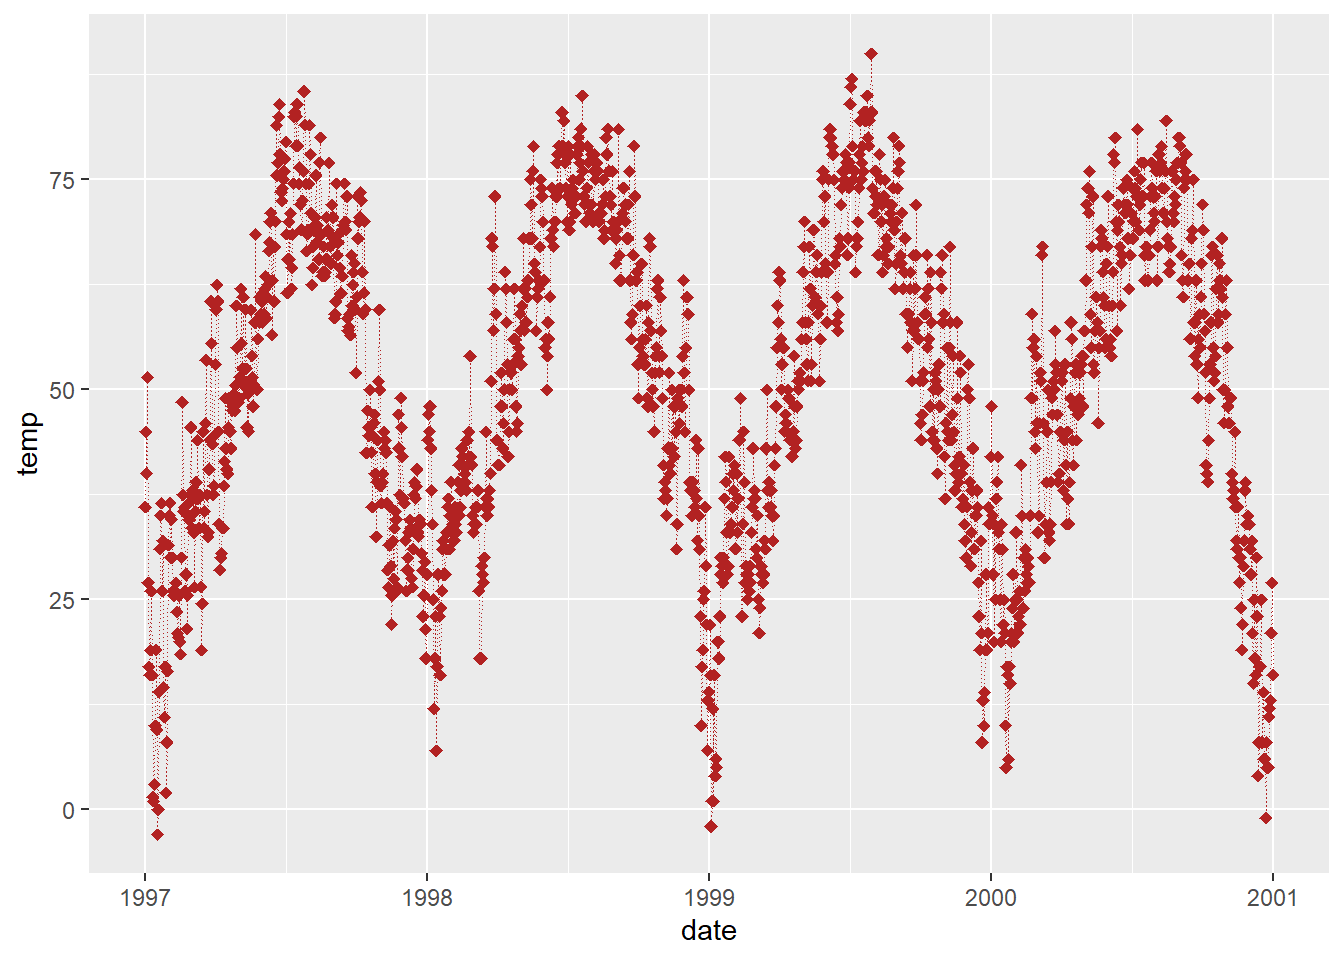
Verander het standaard ggplot2-thema
En om nog wat meer van ggplot’s veelzijdigheid te illustreren, laten we ons ontdoen van het grijzige standaard ggplot2 uiterlijk door een ander ingebouwd thema in te stellen, b.v. theme_bw()-door theme_set() op te roepen zullen alle volgende plots hetzelfde zwart-wit thema hebben. De rode punten zien er nu veel beter uit!
theme_set(theme_bw())

g + geom_point(color = "firebrick")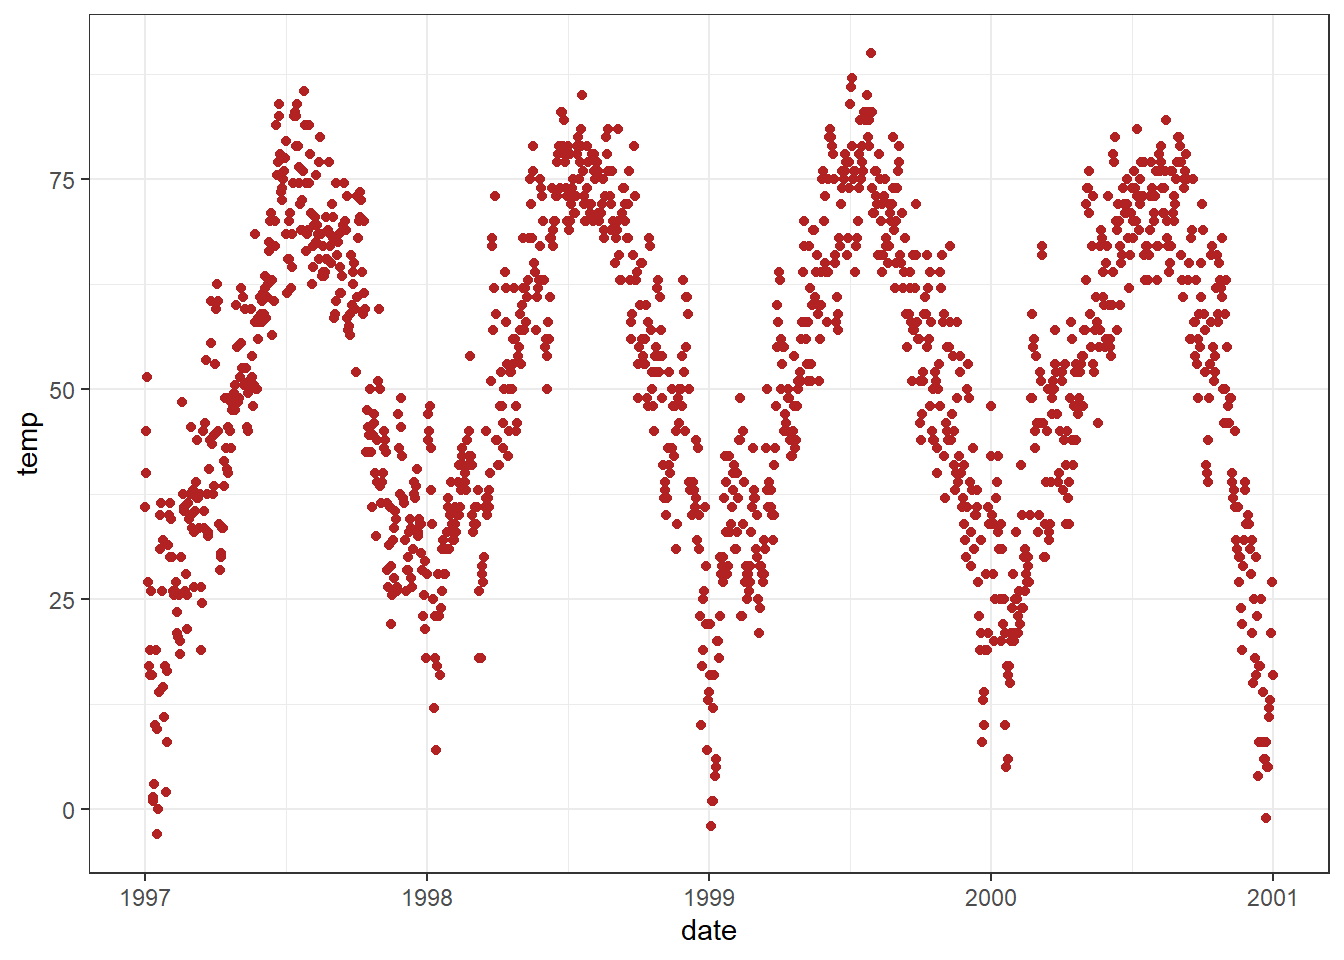
Meer informatie over het gebruik van ingebouwde thema’s en het aanpassen van thema’s vind je in “Working with Themes”. Vanaf het volgende hoofdstuk, zullen we ook de theme() functie gebruiken om bepaalde elementen van het thema aan te passen.
theme()is een essentieel commando om handmatig allerlei thema-elementen (teksten, rechthoeken, en lijnen) aan te passen.
Om te zien welke details van een ggplot thema kunnen worden aangepast, kijk hier - en neem even de tijd, dit is een lange lijst.
Werken met assen
Verander astitels
Laten we wat goed geschreven labels toevoegen aan de assen. Hiervoor voegen we labs() toe met een tekenreeks voor elk label dat we willen veranderen (hier x en y):
ggplot(chic, aes(x = date, y = temp)) +
  geom_point(color = "firebrick") +
  labs(x = "Jaar", y = "Temperatuur (°F)")
Je kunt ook elke astitel toevoegen via xlab() en ylab(). *
ggplot(chic, aes(x = date, y = temp)) +
  geom_point(color = "firebrick") +
  xlab("Jaar") +
  ylab("Temperatuur (°F)")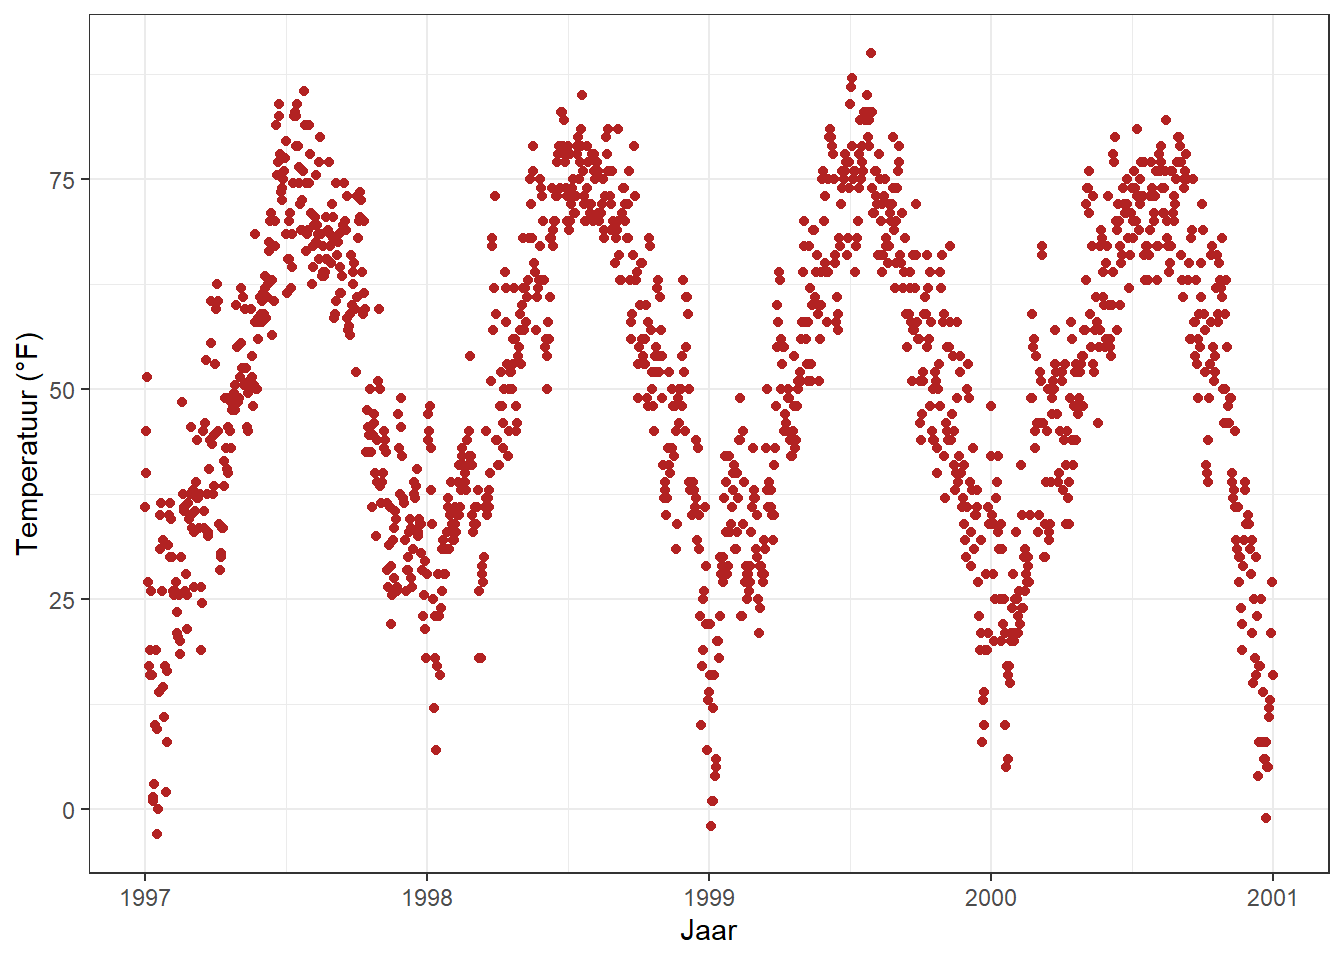
Normaal kan je ook symbolen specificeren door gewoon het symbool zelf toe te voegen, maar onderstaande code laat ook toe om niet alleen symbolen toe te voegen, maar bv. superscripts:
ggplot(chic, aes(x = date, y = temp)) +
  geom_point(color = "firebrick") +
  labs(x = "Jaar", y = expression(paste("Temperatuur (", degree ~ F, ")"^"(Hey, waarom zouden we metrische eenheden gebruiken?!)")))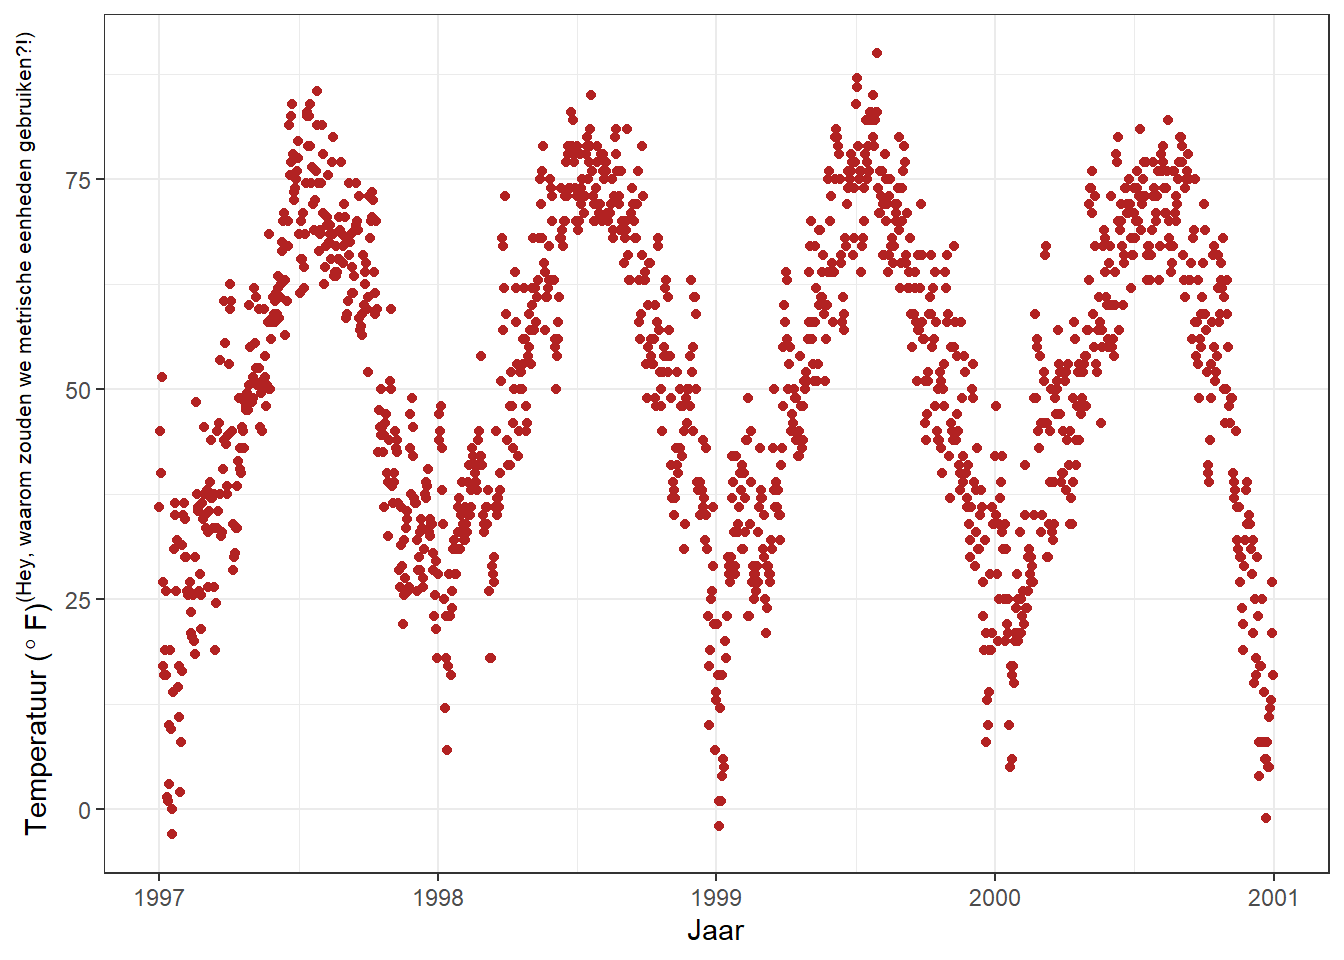
Vergroot de ruimte tussen assen en as-titels
theme() is een essentieel commando om bepaalde thema-elementen aan te passen (teksten en titels, kaders, symbolen, achtergronden, …). We gaan ze veel gebruiken! Voor nu gaan we tekstelementen wijzigen. We kunnen de eigenschappen van alle of bepaalde tekstelementen (hier as-titels) wijzigen door het overschrijven van het standaard element_text() binnen de theme() aanroep:
ggplot(chic, aes(x = date, y = temp)) +
  geom_point(color = "firebrick") +
  labs(x = "Jaar", y = "Temperatuur (°F)") +
  theme(axis.title.x = element_text(vjust = 0, size = 15),
        axis.title.y = element_text(vjust = 2, size = 15))
vjust verwijst naar de verticale uitlijning, die gewoonlijk tussen 0 en 1 ligt, maar je kunt ook waarden buiten dat bereik opgeven. Merk op dat, hoewel we de as-titel op de y-as horizontaal verplaatsen, we vjust moeten specificeren (wat correct is vanuit het perspectief van het label). Je kunt de afstand ook veranderen door de marge van beide tekst elementen op te geven:
ggplot(chic, aes(x = date, y = temp)) +
  geom_point(color = "firebrick") +
  labs(x = "Jaar", y = "Temperatuur (°F)") +
  theme(axis.title.x = element_text(margin = margin(t = 10), size = 15),
        axis.title.y = element_text(margin = margin(r = 10), size = 15))
De labels t en r in het margin() object verwijzen naar boven en rechts, respectievelijk. Je kunt de vier marges ook opgeven als margin(t, r, b, l). Merk op dat we nu de rechtermarge moeten veranderen om de ruimte op de y-as aan te passen, niet de ondermarge.
Een goede manier om de volgorde van de marges te onthouden is “t-r-ou-b-l-e”.
Wijzig de esthetiek van de as-titels
We gebruiken weer de theme() functie en wijzigen het element axis.title en/of de ondergeschikte elementen axis.title.x en axis.title.y. Binnen de element_text() kunnen we bijvoorbeeld de standaardwaarden voor size, color, en face overschrijven:
ggplot(chic, aes(x = date, y = temp)) +
  geom_point(color = "firebrick") +
  labs(x = "Jaar", y = "Temperatuur (°F)") +
  theme(axis.title = element_text(size = 15, color = "firebrick",
                                  face = "italic"))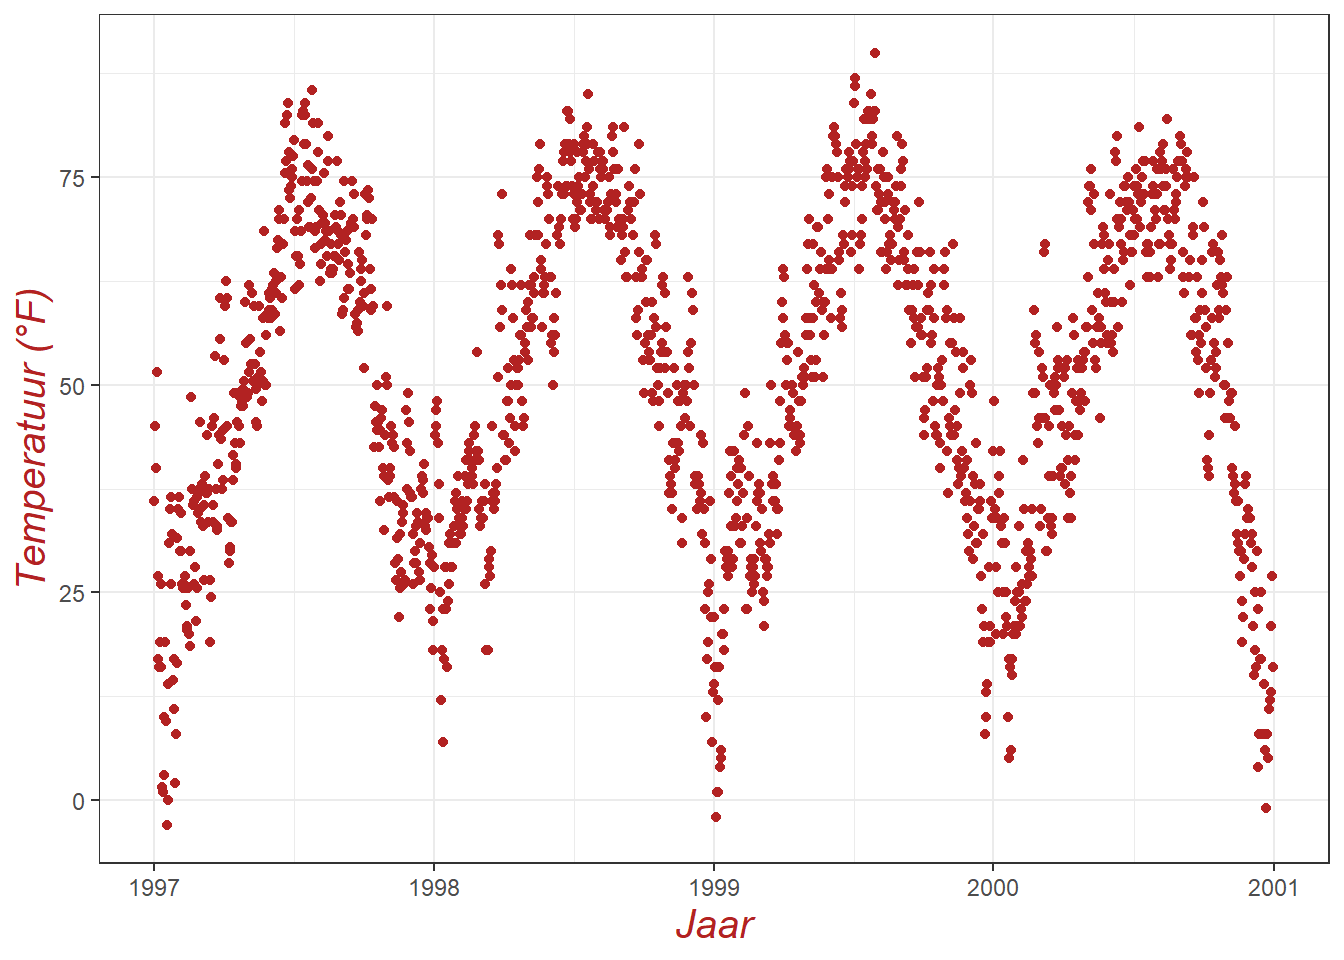
Het face argument kan worden gebruikt om het lettertype vet or schuin of zelfd bold.italic(vet.schuin) te krijgen.
ggplot(chic, aes(x = date, y = temp)) +
  geom_point(color = "firebrick") +
  labs(x = "Jaar", y = "Temperatuur (°F)") +
  theme(axis.title.x = element_text(color = "sienna", size = 15),
        axis.title.y = element_text(color = "orangered", size = 15))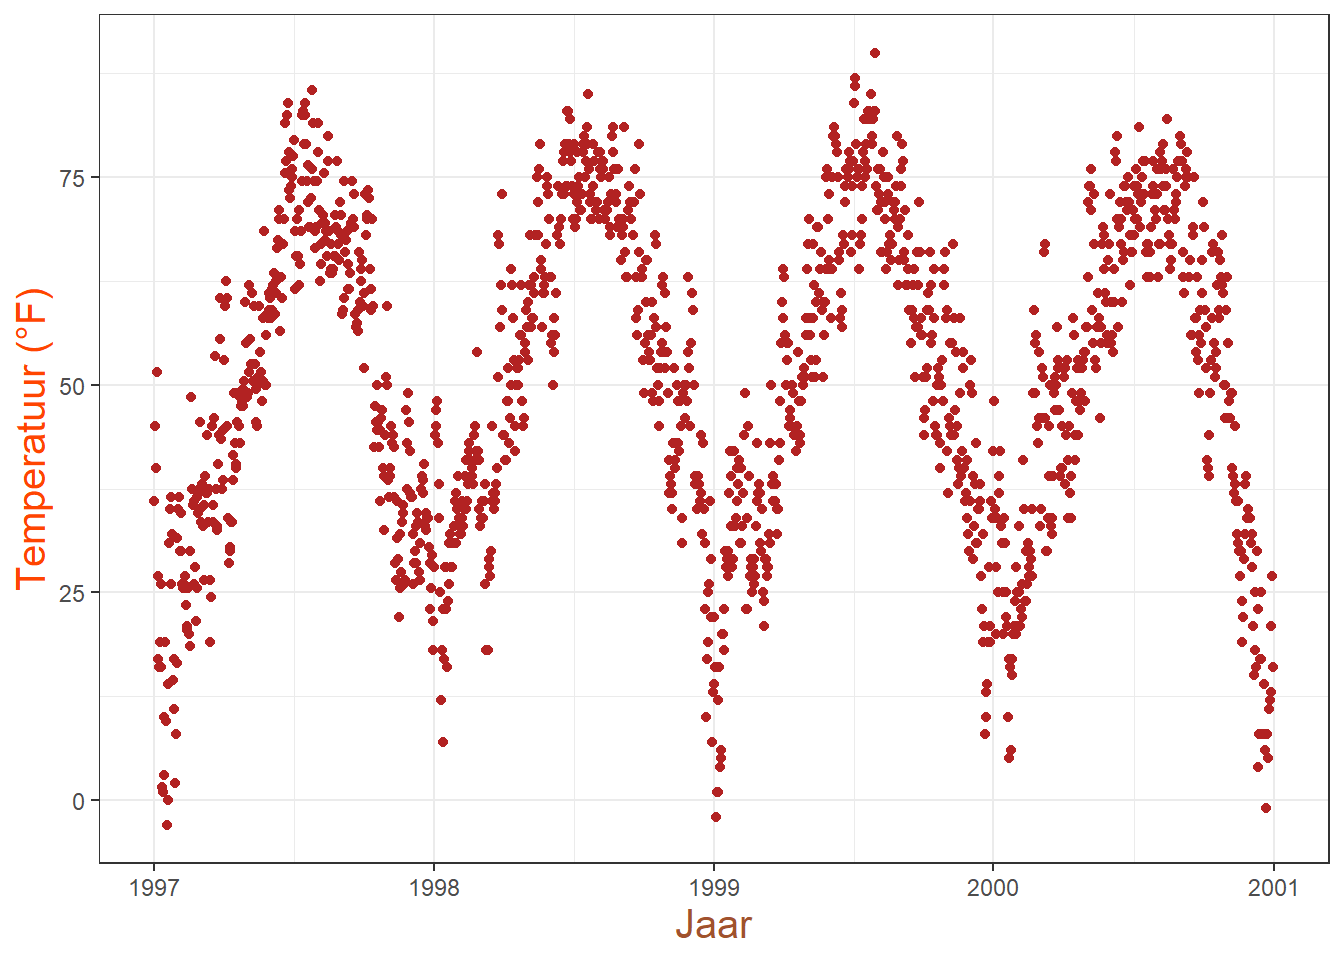
Je kunt ook een combinatie gebruiken van
axis.titleenaxis.title.y, omdataxis.title.xde waarden erft vanaxis.title. Zie hieronder.
ggplot(chic, aes(x = date, y = temp)) +
  geom_point(color = "firebrick") +
  labs(x = "Jaar", y = "Temperatuur (°F)") +
  theme(axis.title = element_text(color = "sienna", size = 15),
        axis.title.y = element_text(color = "orangered", size = 15))
Men kan sommige eigenschappen voor beide assen wijzigen en andere slechts voor één of eigenschappen voor elke as afzonderlijk:
ggplot(chic, aes(x = date, y = temp)) +
  geom_point(color = "firebrick") +
  labs(x = "Jaar", y = "Temperatuur (°F)") +
  theme(axis.title = element_text(color = "sienna", size = 15, face = "bold"),
        axis.title.y = element_text(face = "bold.italic"))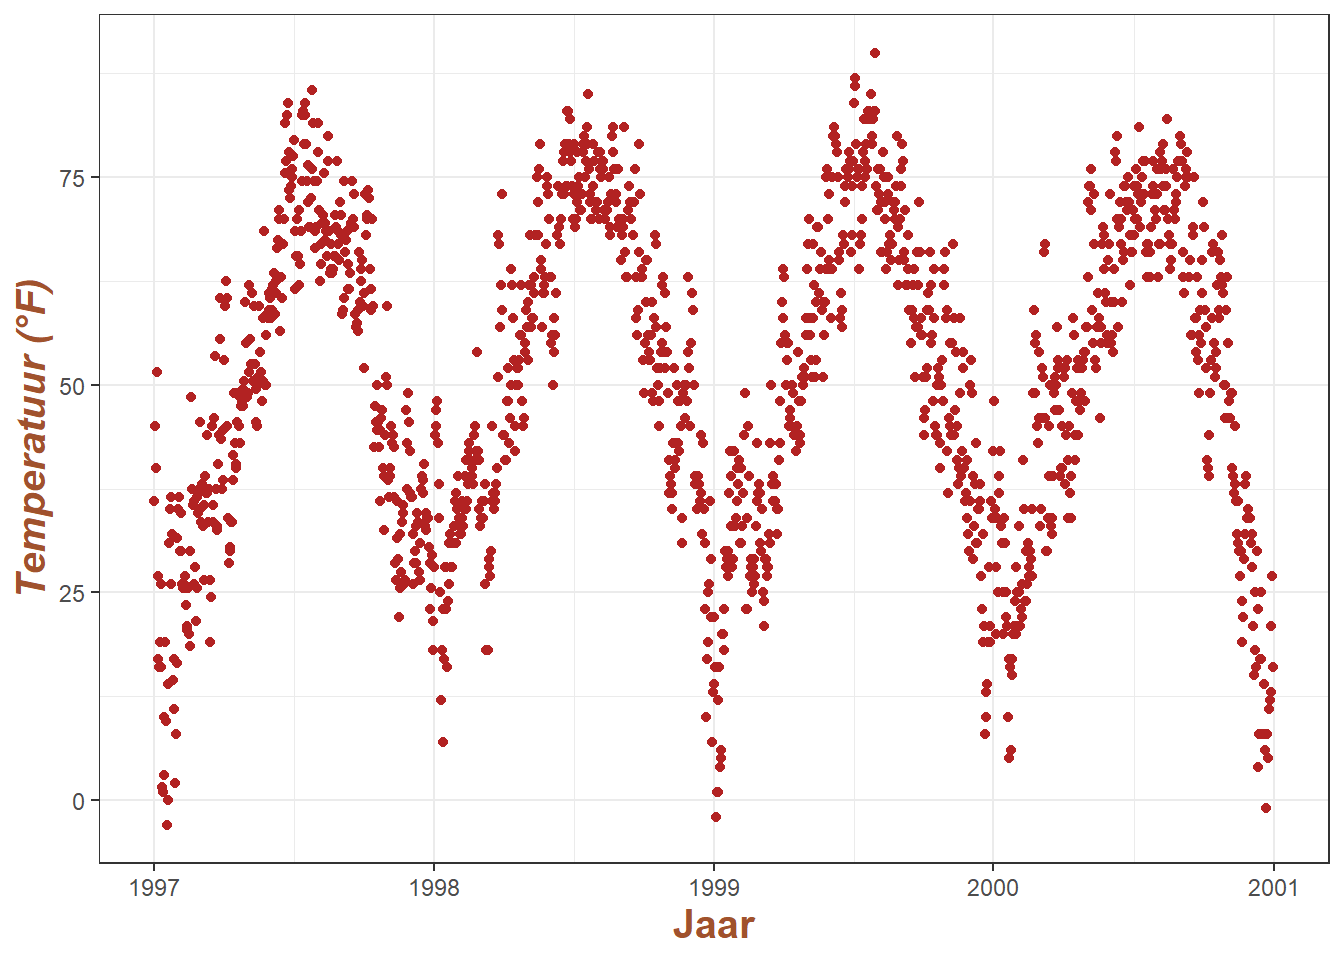
Verander de aesthetics van de astekst
Op dezelfde manier kun je ook het uiterlijk van de as-tekst (hier de getallen) veranderen door axis.text en/of de ondergeschikte elementen axis.text.x en axis.text.y te gebruiken:
ggplot(chic, aes(x = date, y = temp)) +
  geom_point(color = "firebrick") +
  labs(x = "Jaar", y = "Temperatuur (°F)") +
  theme(axis.text = element_text(color = "dodgerblue", size = 12),
        axis.text.x = element_text(face = "italic"))
Roteer astekst
Door een angle op te geven kun je alle tekstelementen draaien. Met hjust en vjust kun je de positie van de tekst achteraf horizontaal (0 = left, 1 = right) en verticaal (0 = top, 1 = bottom) aanpassen:
ggplot(chic, aes(x = date, y = temp)) +
  geom_point(color = "firebrick") +
  labs(x = "Year", y = "Temperature (°F)") +
  theme(axis.text.x = element_text(angle = 50, vjust = 1, hjust = 1, size = 12))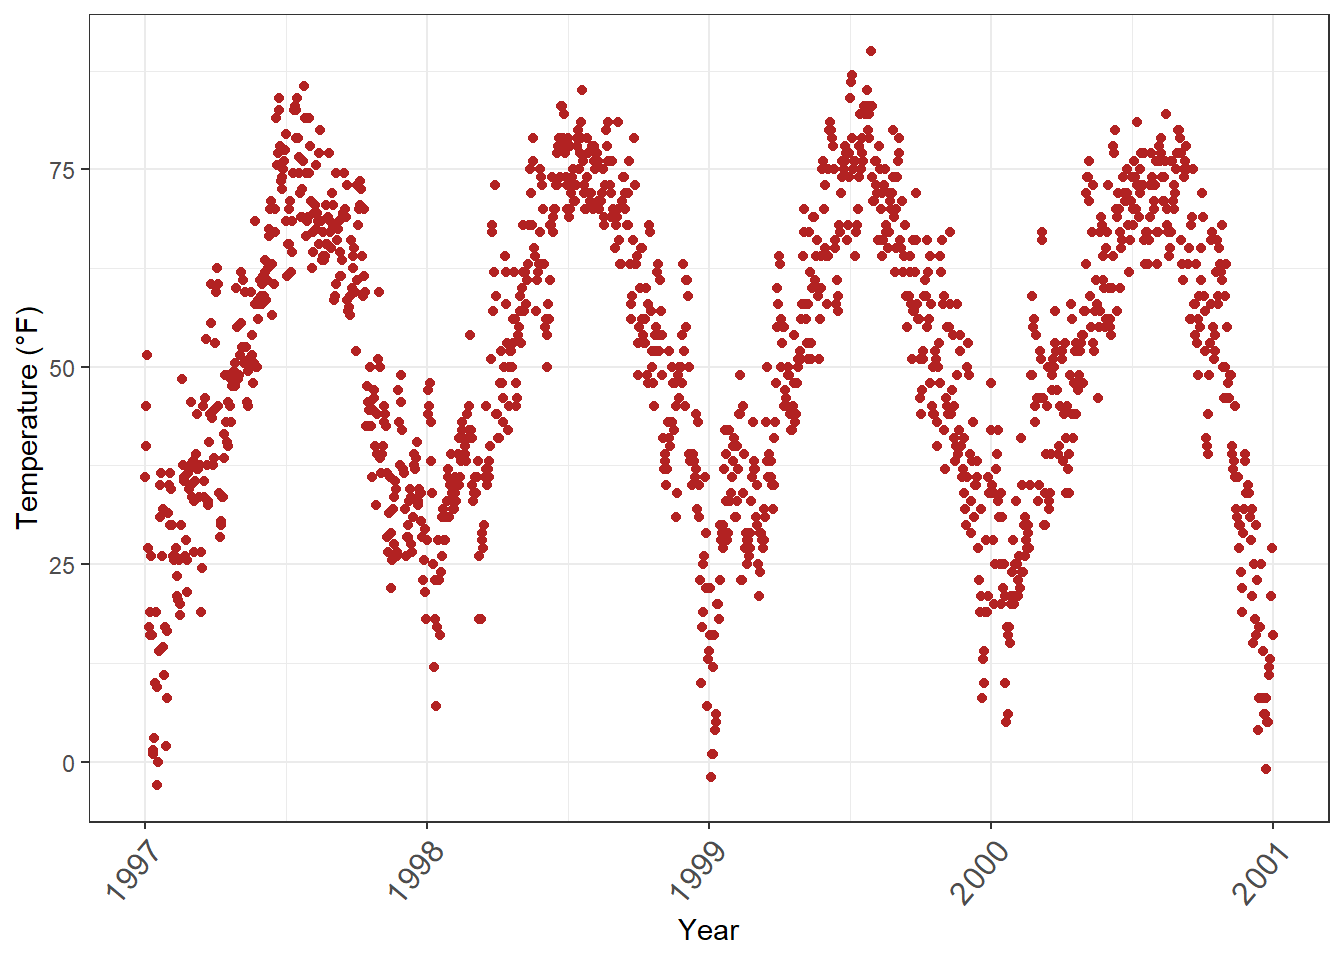
Astekst en tekens weghalen
Er zal niet snel een reden voor zijn—maar zo werkt het:
ggplot(chic, aes(x = date, y = temp)) +
  geom_point(color = "firebrick") +
  labs(x = "Jaar", y = "Temperatuur (°F)") +
  theme(axis.ticks.y = element_blank(),
        axis.text.y = element_blank())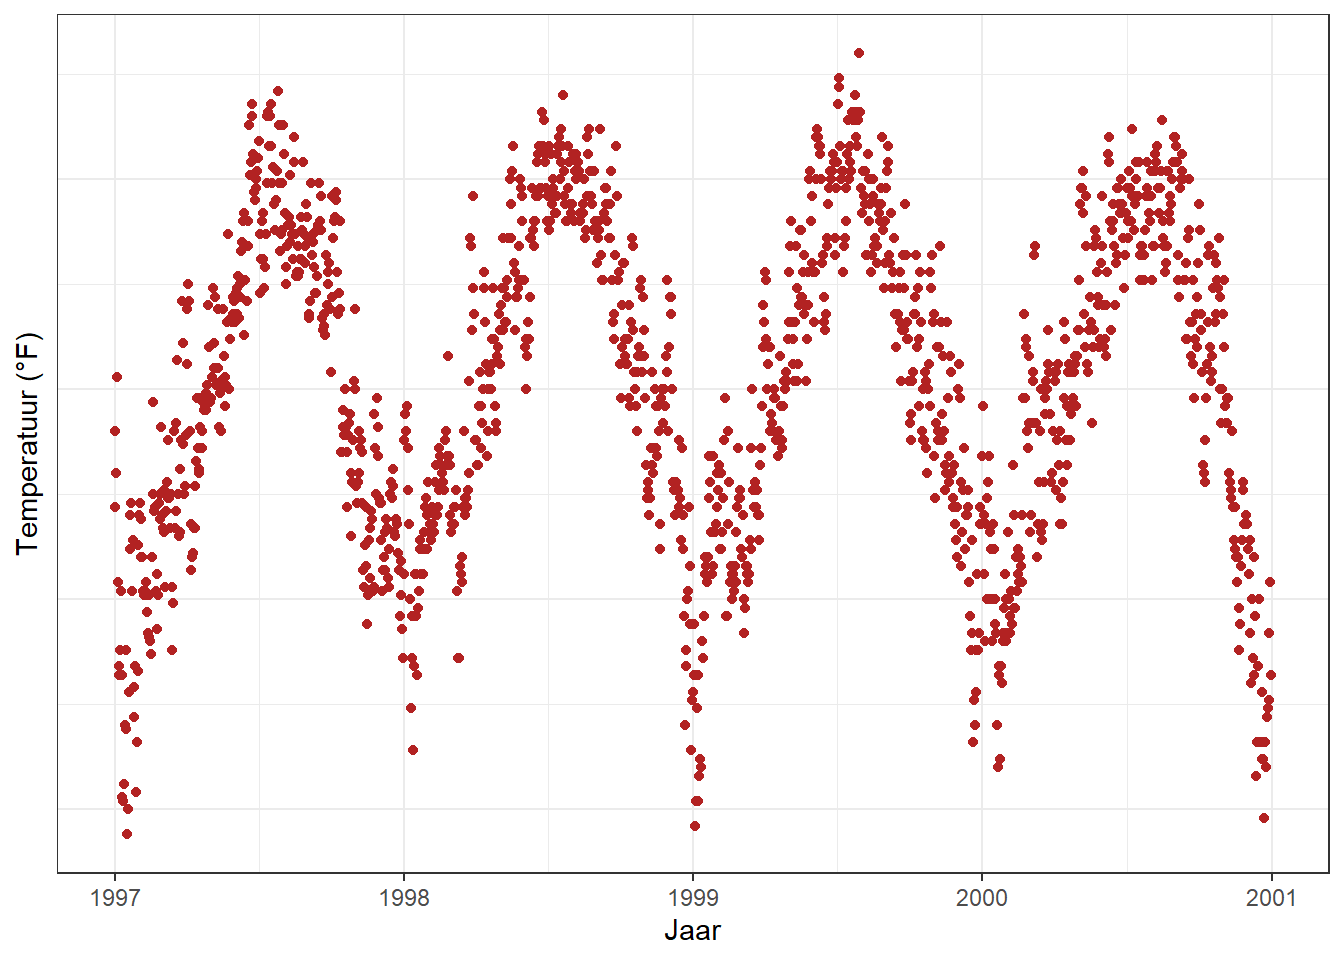
Ik heb drie thema-elementen geïntroduceerd - tekst, lijnen en rechthoeken - maar eigenlijk is er nog een: element_blank() dat het element verwijdert (en dus niet als een officieel element wordt beschouwd).
Als je van een
theme-element af wilt, is het element altijdelement_blank().
Haal astitels weg
We zouden opnieuw theme_blank() kunnen gebruiken, maar het is veel eenvoudiger om gewoon het label te verwijderen in de labs() (of xlab()) aanroep:
ggplot(chic, aes(x = date, y = temp)) +
  geom_point(color = "firebrick") +
  labs(x = NULL, y = "")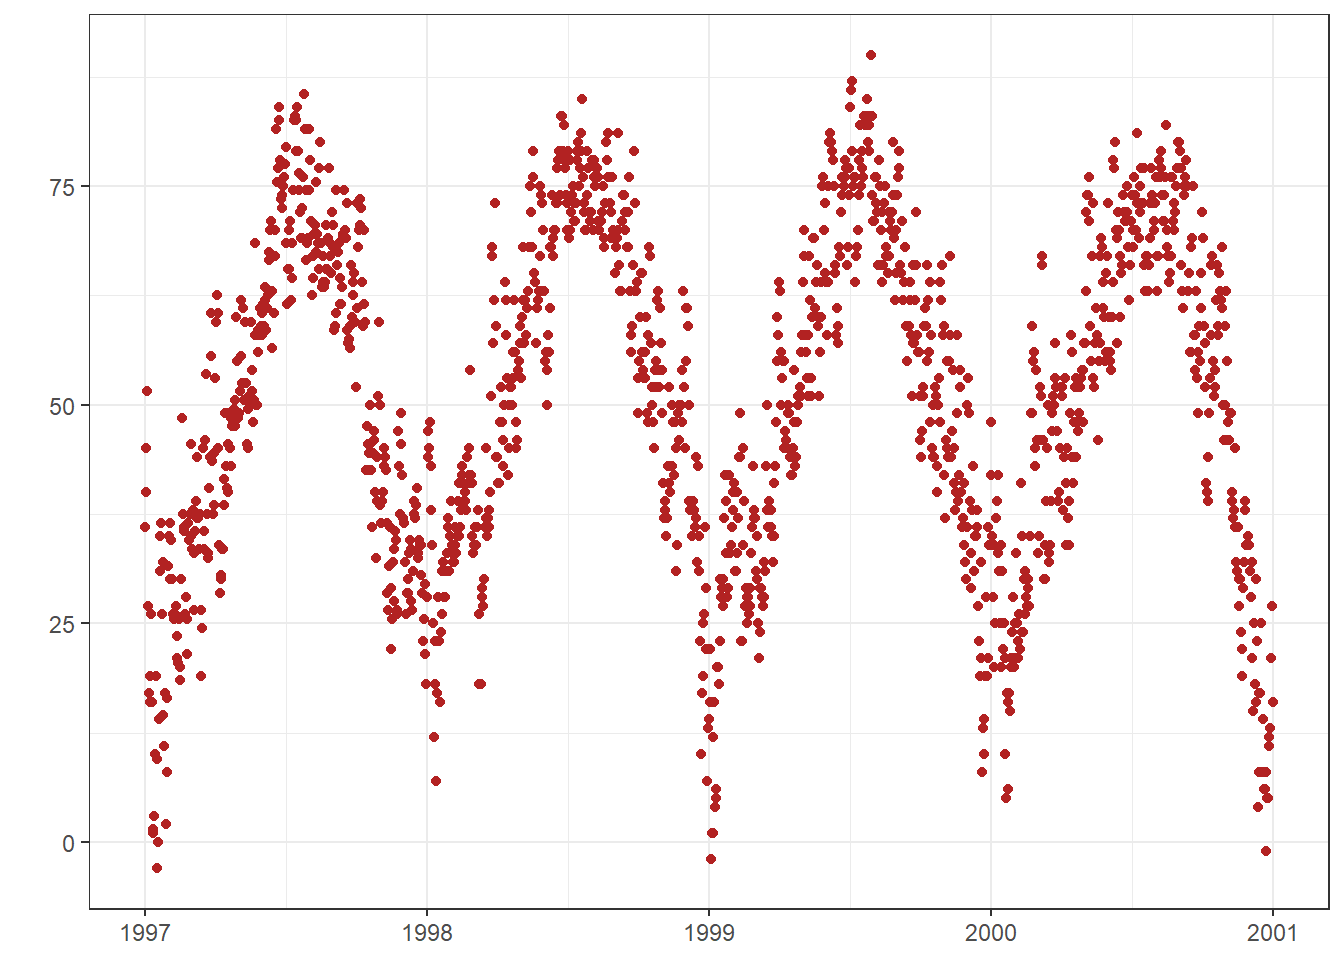
Merk op dat
NULLhet element verwijdert (vergelijkbaar metelement_blank()) terwijl lege aanhalingstekens""de spatiëring voor de as-titel behouden en gewoon niets afdrukken.
Asbereik beperken
Soms wil je een bepaald bereik van je gegevens nader bekijken. Je kunt dit doen zonder je gegevens te splitsen:
ggplot(chic, aes(x = date, y = temp)) +
  geom_point(color = "firebrick") +
  labs(x = "Jaar", y = "Temperatuur (°F)") +
  ylim(c(0, 50))
Warning: Removed 777 rows containing missing values (geom_point).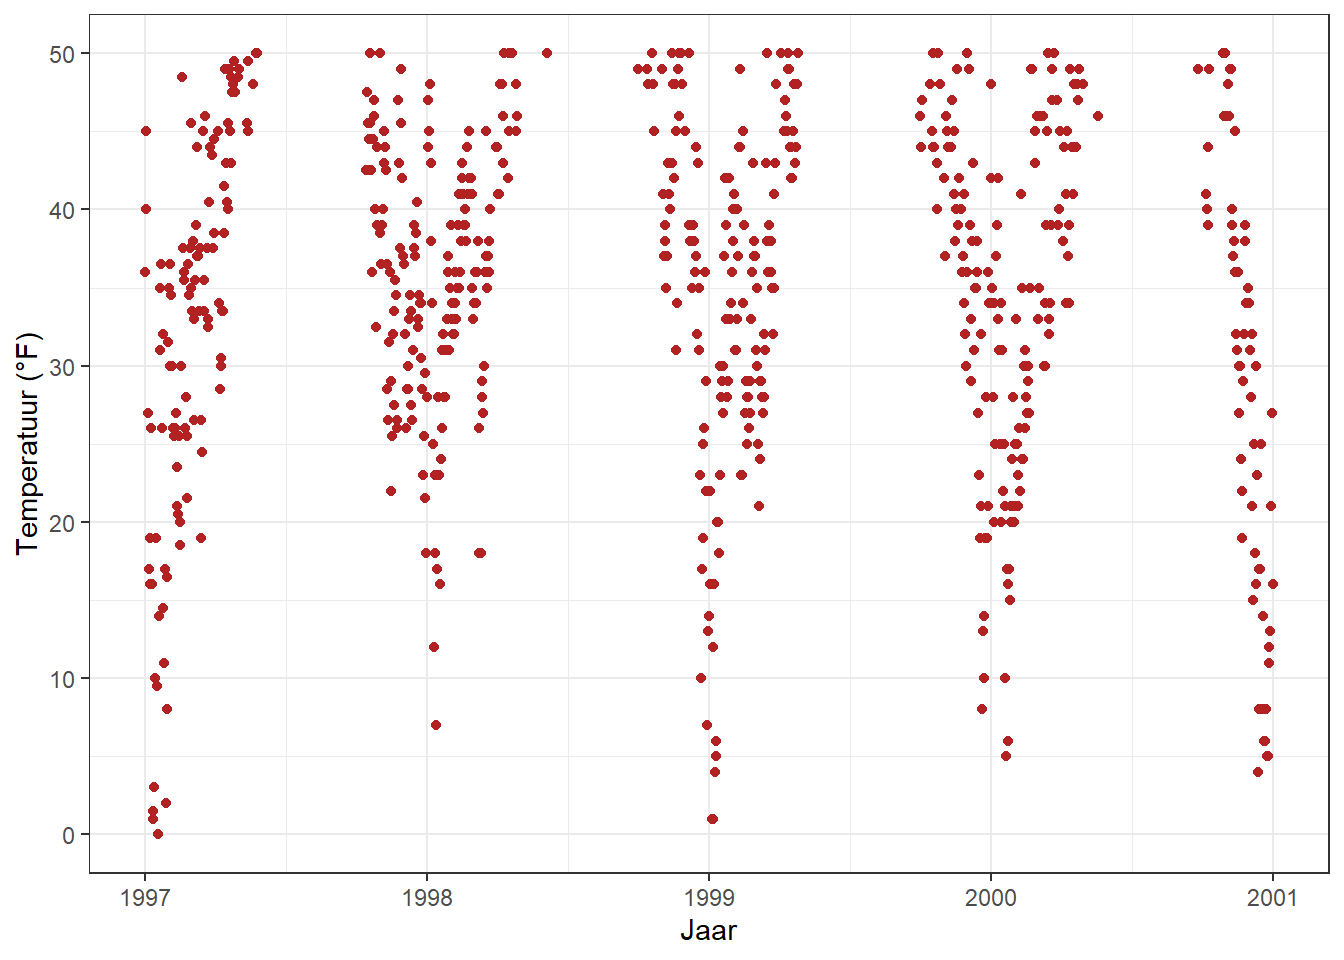
Als alternatief kun je scale_y_continuous(limits = c(0, 50)) of coord_cartesian(ylim = c(0, 50)) gebruiken. De eerste verwijdert alle datapunten buiten het bereik, terwijl de tweede het zichtbare gebied aanpast en vergelijkbaar is met ylim(c(0, 50)). Je kunt je afvragen: Dus uiteindelijk leveren beide hetzelfde op. Niet echt, er is een belangrijk verschil-vergelijk de twee volgende plots:
Plaatje2.PNG)
Je hebt misschien gezien dat er links een lege buffer is rond de y-grens, terwijl er rechts punten tot aan de grens en zelfs verder worden uitgezet. Dit illustreert perfect het subsetting (links) versus het zoomen (rechts). Om te tonen waarom dit belangrijk is, laten we eens kijken naar een ander grafiektype, een box plot:
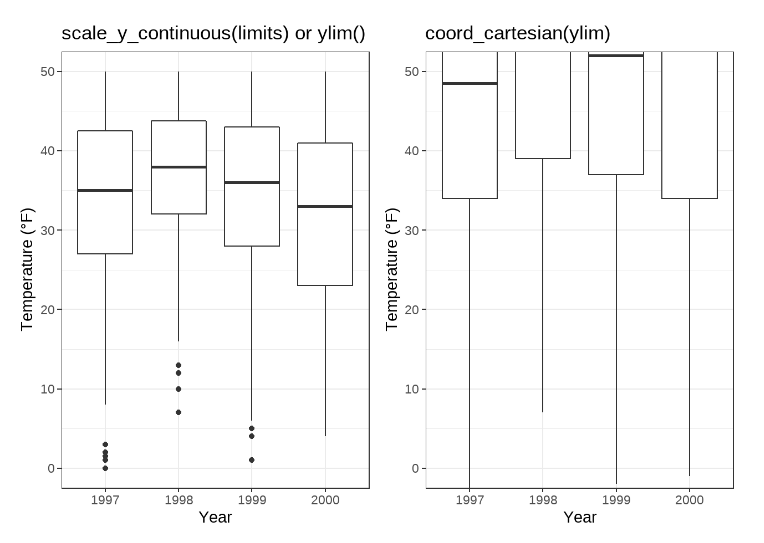
Omdat scale_x|y_continuous() de data eerst subset, krijgen we totaal verschillende (en verkeerde, tenminste als dit niet je doel was) schattingen voor de boxp-lots! Ik hoop dat je nu niet terug hoeft te gaan naar je oude scripts om te controleren of je misschien je data hebt gemanipuleerd tijdens het plotten en verkeerde samenvattende statistieken hebt gerapporteerd in je rapport, paper of thesis…
Forceer Plot om te starten bij Origin
Verwant hiermee, je kan R forceren om de grafiek te plotten startend bij de oorsprong:
library(tidyverse)

chic_high <- dplyr::filter(chic, temp > 25, o3 > 20)

ggplot(chic_high, aes(x = temp, y = o3)) +
  geom_point(color = "darkcyan") +
  labs(x = "Temperatuur hoger dan 25°F",
       y = "Ozon hoger dan 20 ppb") +
  expand_limits(x = 0, y = 0)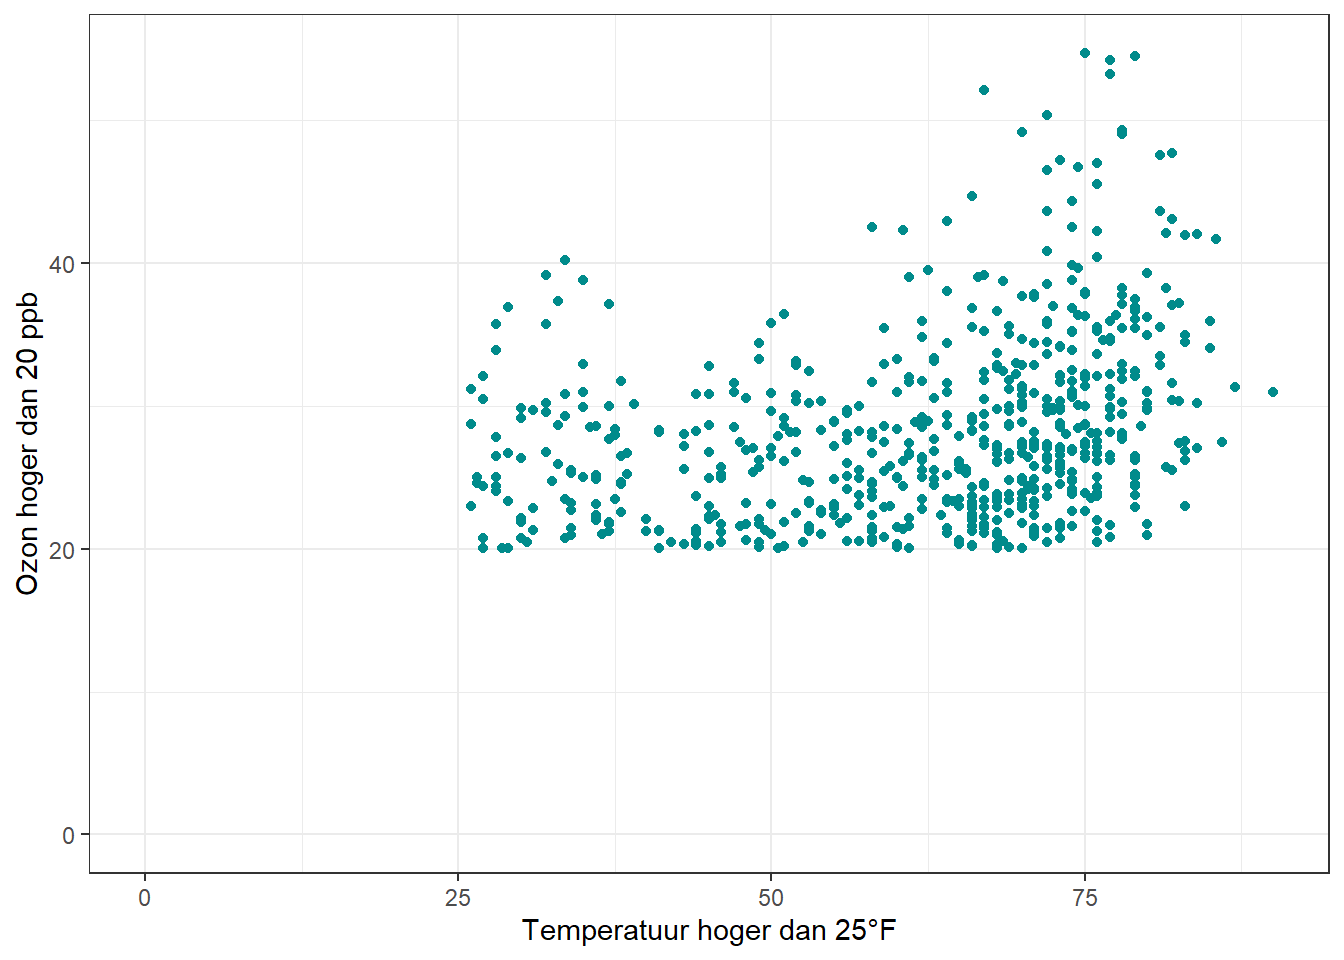
Gebruik van
coord_cartesian(xlim = c(0, NA), ylim = c(0, NA))levert hetzelfde resultaat op.
library(tidyverse)

chic_high <- dplyr::filter(chic, temp > 25, o3 > 20)

ggplot(chic_high, aes(x = temp, y = o3)) +
  geom_point(color = "darkcyan") +
  labs(x = "Temperatuur hoger dan25°F",
       y = "Ozon hoger dan 20 ppb") +
  coord_cartesian(xlim = c(0, NA), ylim = c(0, NA))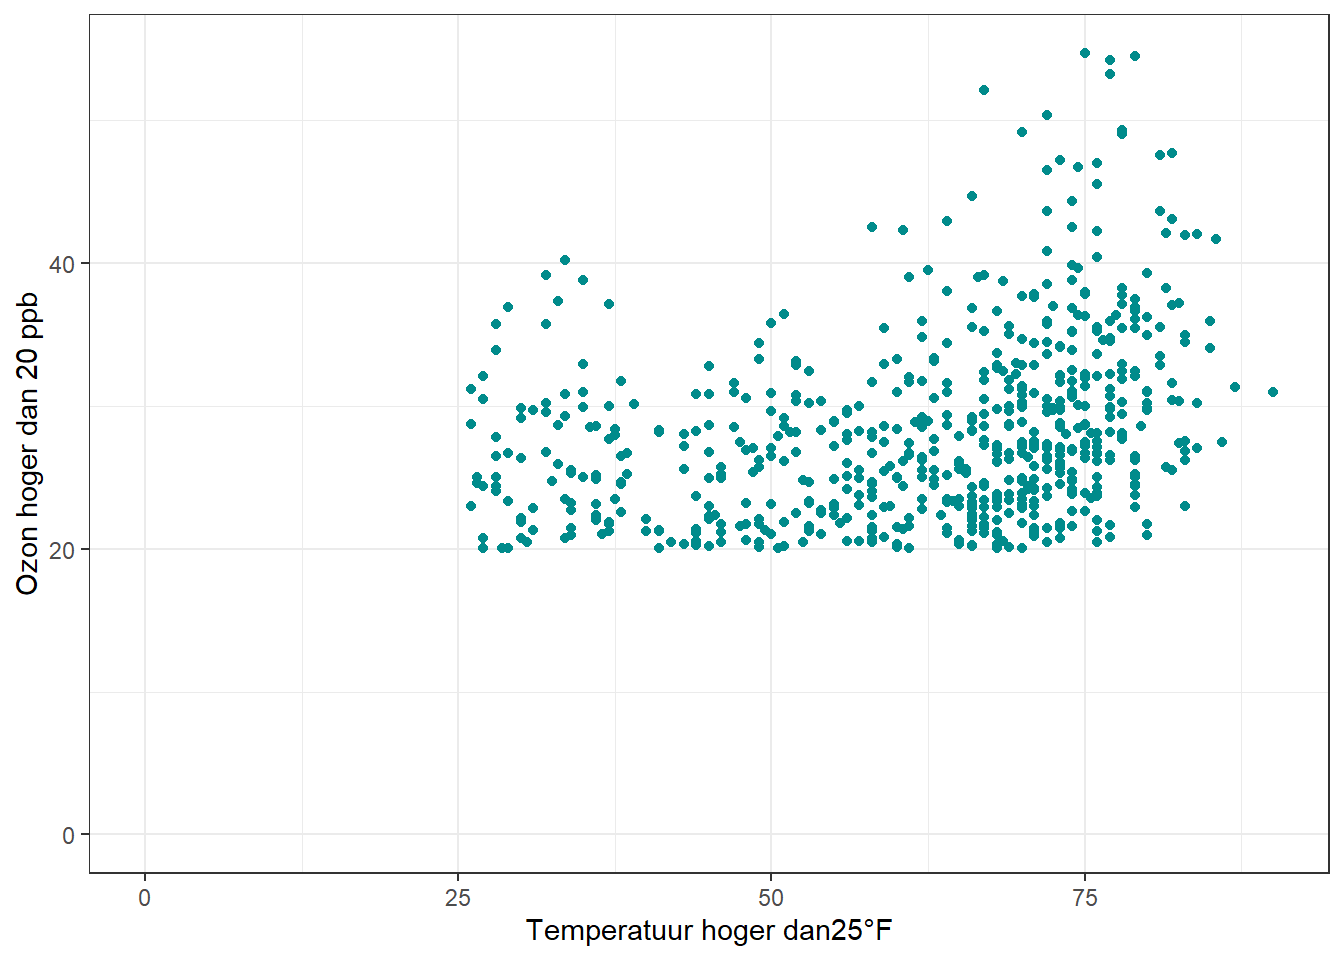
Maar we kunnen het ook forceren om letterlijk bij het begin te beginnen.
ggplot(chic_high, aes(x = temp, y = o3)) +
  geom_point(color = "darkcyan") +
  labs(x = "Temperatuur hoger dan 25°F",
       y = "Ozon hoger dan 20 ppb") +
  expand_limits(x = 0, y = 0) +
  coord_cartesian(expand = FALSE, clip = "off")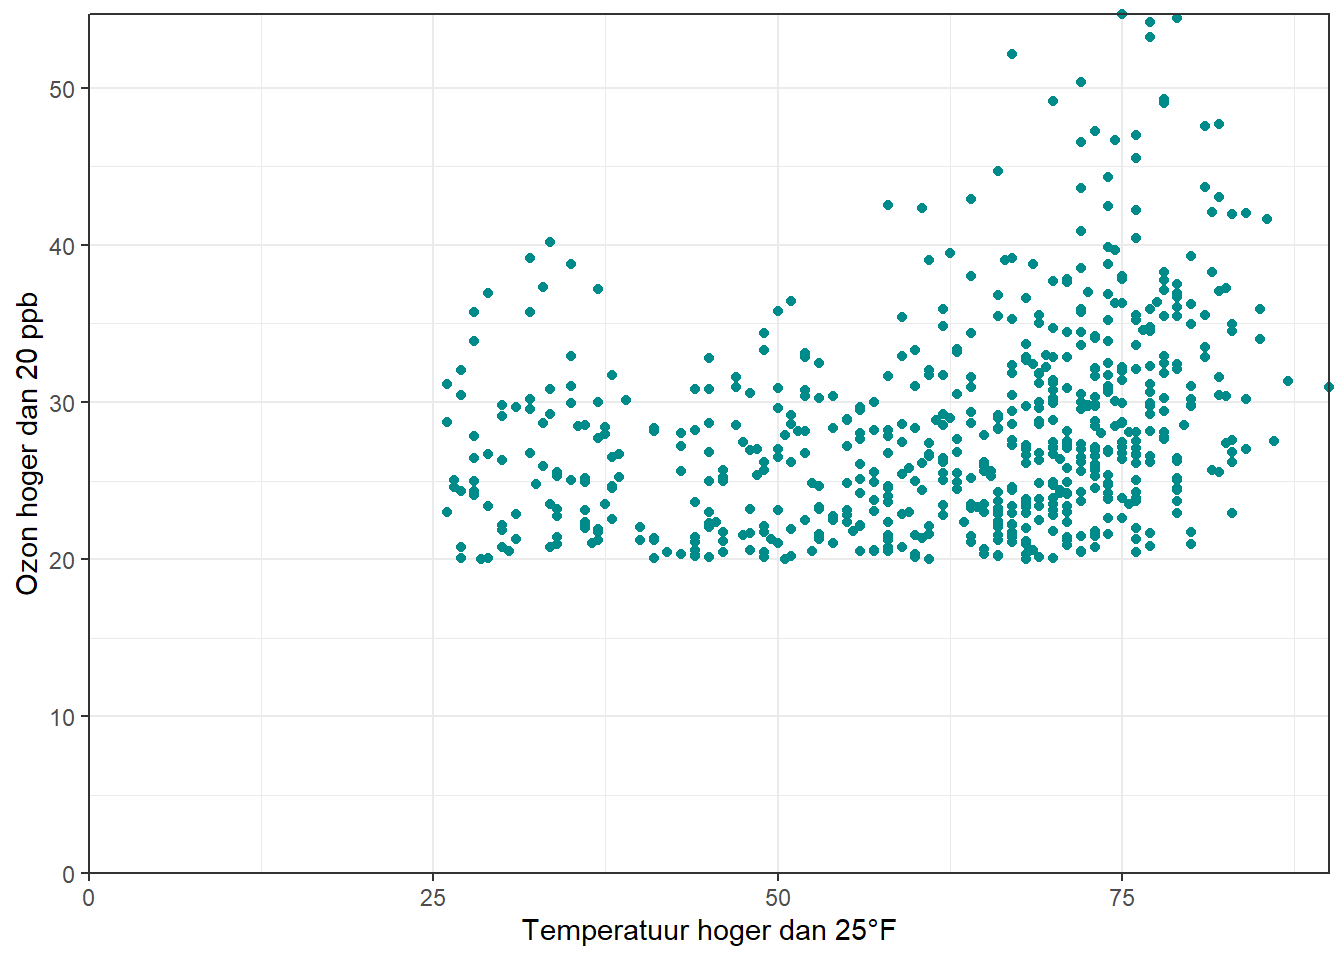
Het argument
clip = "off"in elk coördinatensysteem, altijd beginnend metcoord_*, stelt je in staat om buiten het paneelgebied te tekenen.
Hier zorg ik ervoor dat de tikmerken op c(0, 0) niet weggesneden worden. Voor meer details zie ook Twitter thread door Claus Wilke.
Assen met dezelfde schalen
Laten we ter demonstratie de temperatuur uitzetten tegen de temperatuur met wat willekeurige ruis. De coord_equal() is een coördinatensysteem met een gespecificeerde verhouding die het aantal eenheden op de y-as weergeeft dat gelijk is aan één eenheid op de x-as.
De standaardwaarde, ratio = 1, zorgt ervoor dat één eenheid op de x-as even lang is als één eenheid op de y-as:
ggplot(chic, aes(x = temp, y = temp + rnorm(nrow(chic), sd = 20))) +
  geom_point(color = "sienna") +
  labs(x = "Temperatuur (°F)", y = "Temperatuur (°F) + random ruis") +
  xlim(c(0, 100)) + ylim(c(0, 150)) +
  coord_fixed()
Warning: Removed 49 rows containing missing values (geom_point).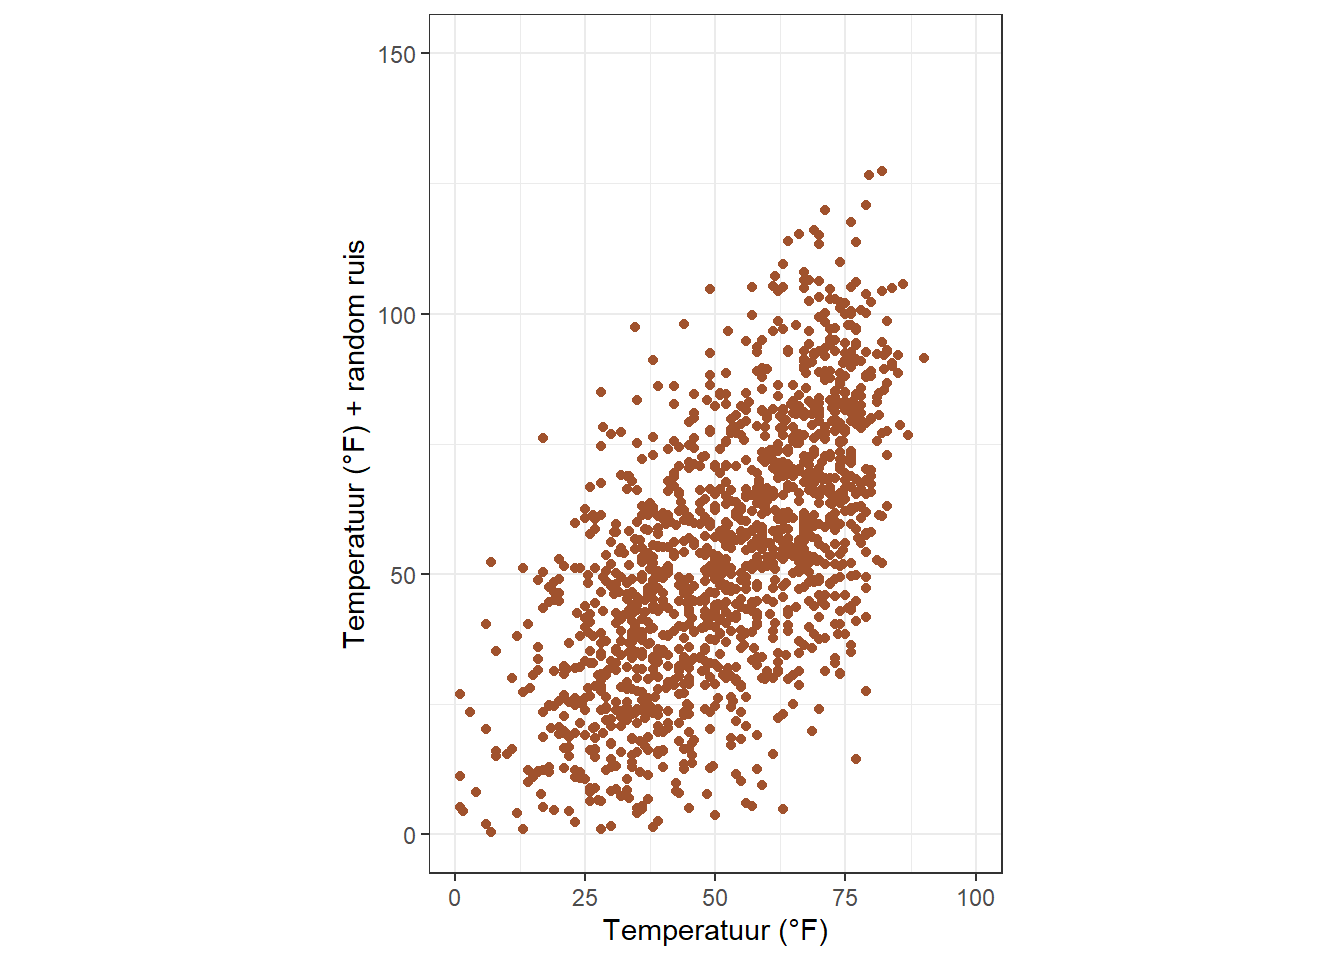
Verhoudingen hoger dan één maken eenheden op de y-as langer dan eenheden op de x-as, en omgekeerd:
ggplot(chic, aes(x = temp, y = temp + rnorm(nrow(chic), sd = 20))) +
  geom_point(color = "sienna") +
  labs(x = "Temperatuur (°F)", y = "Temperatuur (°F) + random ruis") +
  xlim(c(0, 100)) + ylim(c(0, 150)) +
  coord_fixed(ratio = 1/5)
Warning: Removed 62 rows containing missing values (geom_point).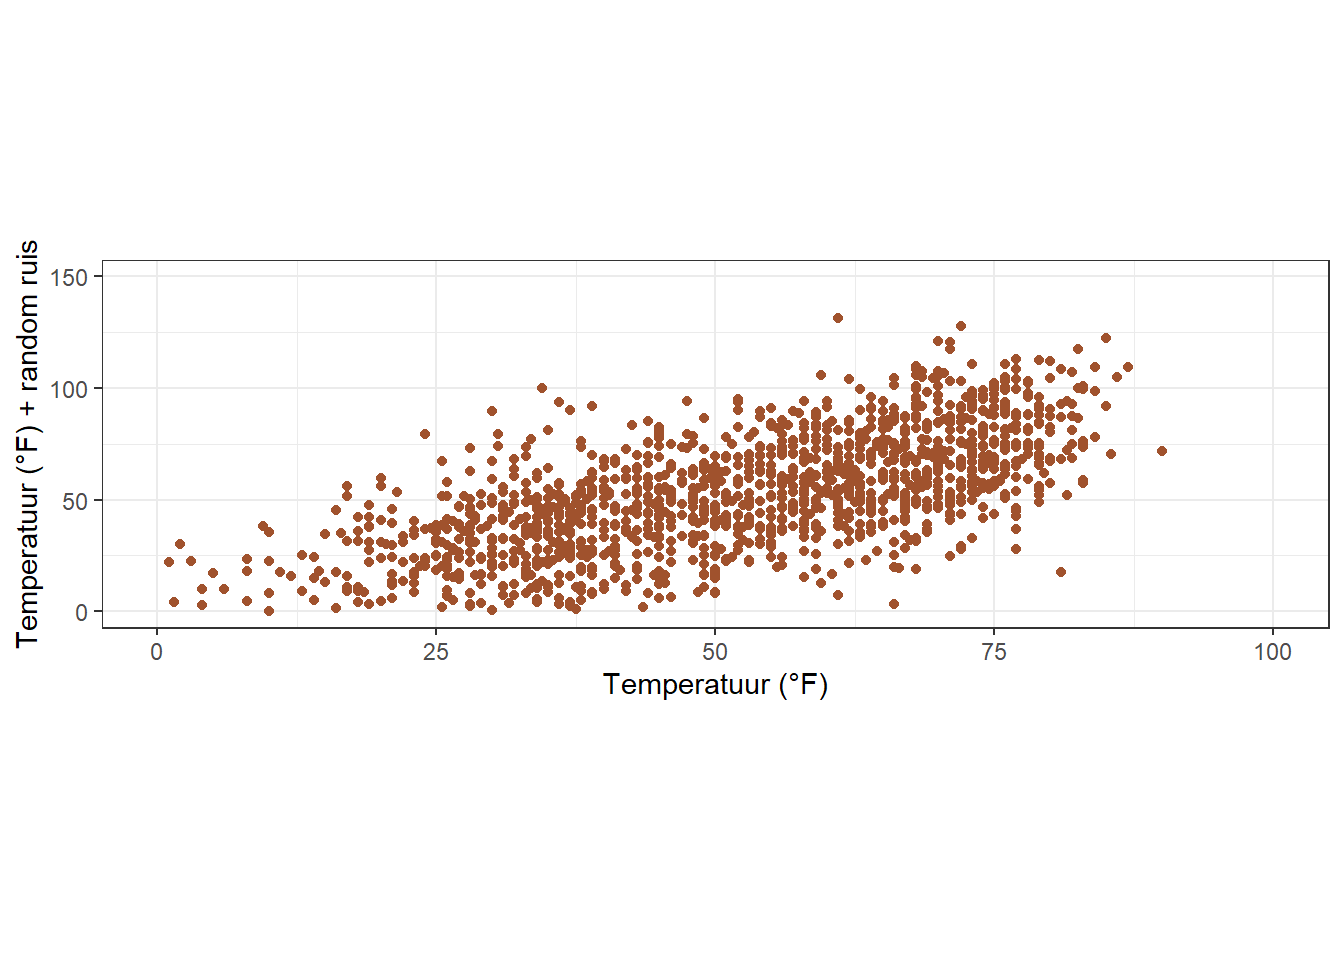
Gebruik een functie om labels te veranderen
Soms is het handig om uw labels een beetje te wijzigen, bijvoorbeeld door eenheden of procenttekens toe te voegen zonder ze aan uw gegevens toe te voegen. In dat geval kun je een functie gebruiken:
ggplot(chic, aes(x = date, y = temp)) +
  geom_point(color = "firebrick") +
  labs(x = "Jaar", y = NULL) +
  scale_y_continuous(label = function(x) {return(paste(x, "Graden Fahrenheit"))})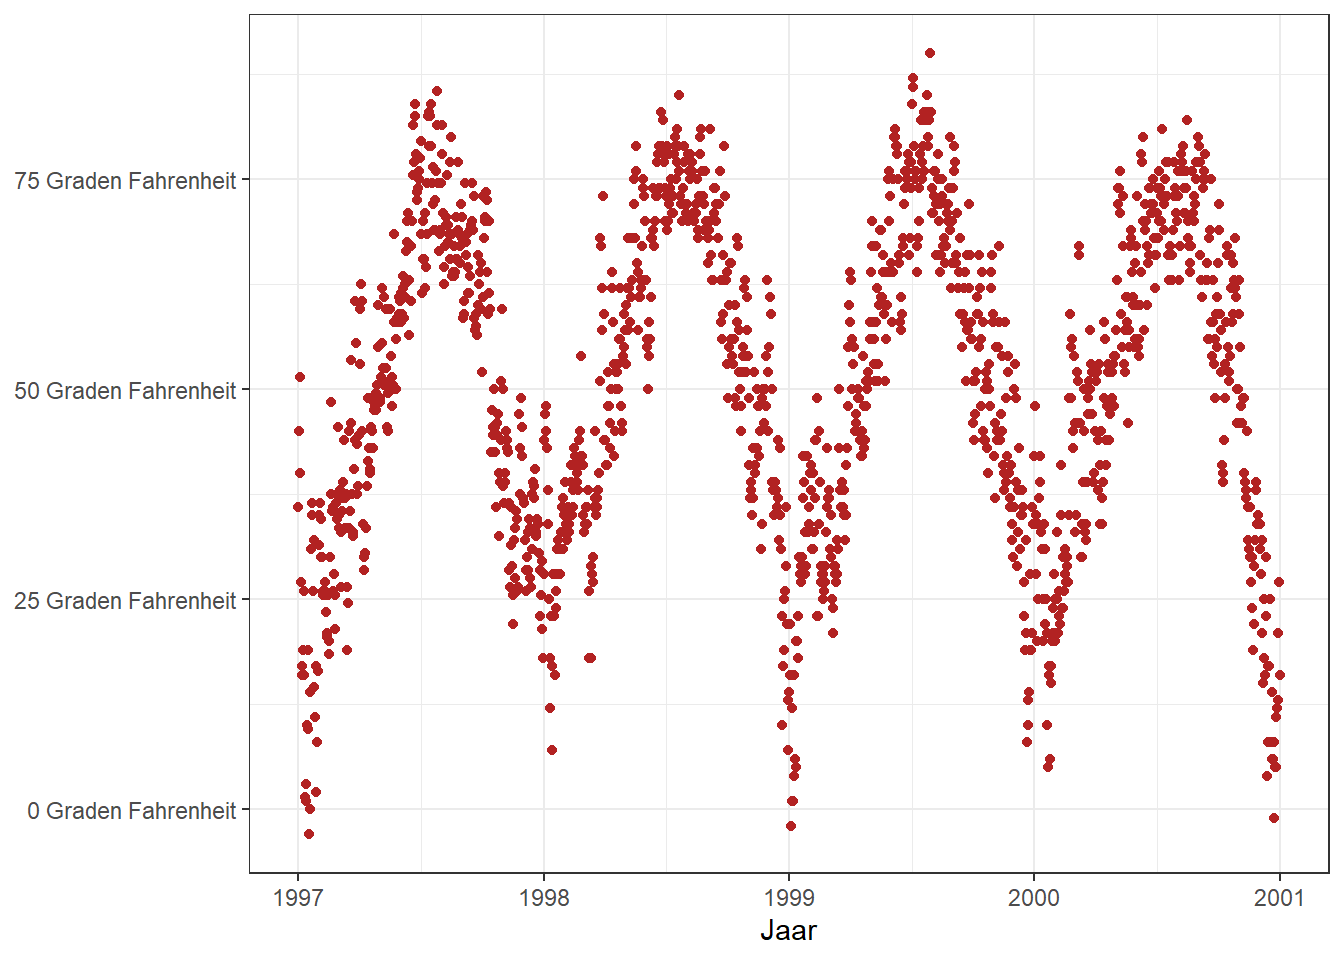
Met titels werken
Een titel toevoegen
We kunnen een titel toevoegen via de ggtitle() functie:
ggplot(chic, aes(x = date, y = temp)) +
  geom_point(color = "firebrick") +
  labs(x = "Jaar", y = "Temperatuur (°F)") +
  ggtitle("Temperaturen in Chicago")
Als alternatief kun je labs() gebruiken. Hier kun je meerdere argumenten toevoegen, bijvoorbeeld een ondertitel, een onderschrift en een tag (en ook as-titels zoals eerder getoond):
ggplot(chic, aes(x = date, y = temp)) +
  geom_point(color = "firebrick") +
  labs(x = "Jaar", y = "Temperatuur (°F)",
       title = "Temperaturen in Chicago",
       subtitle = "Seizoenspatroon van dagelijkse temperaturen van 1997 tot 2001",
       caption = "Data: NMMAPS",
       tag = "Figuur 1")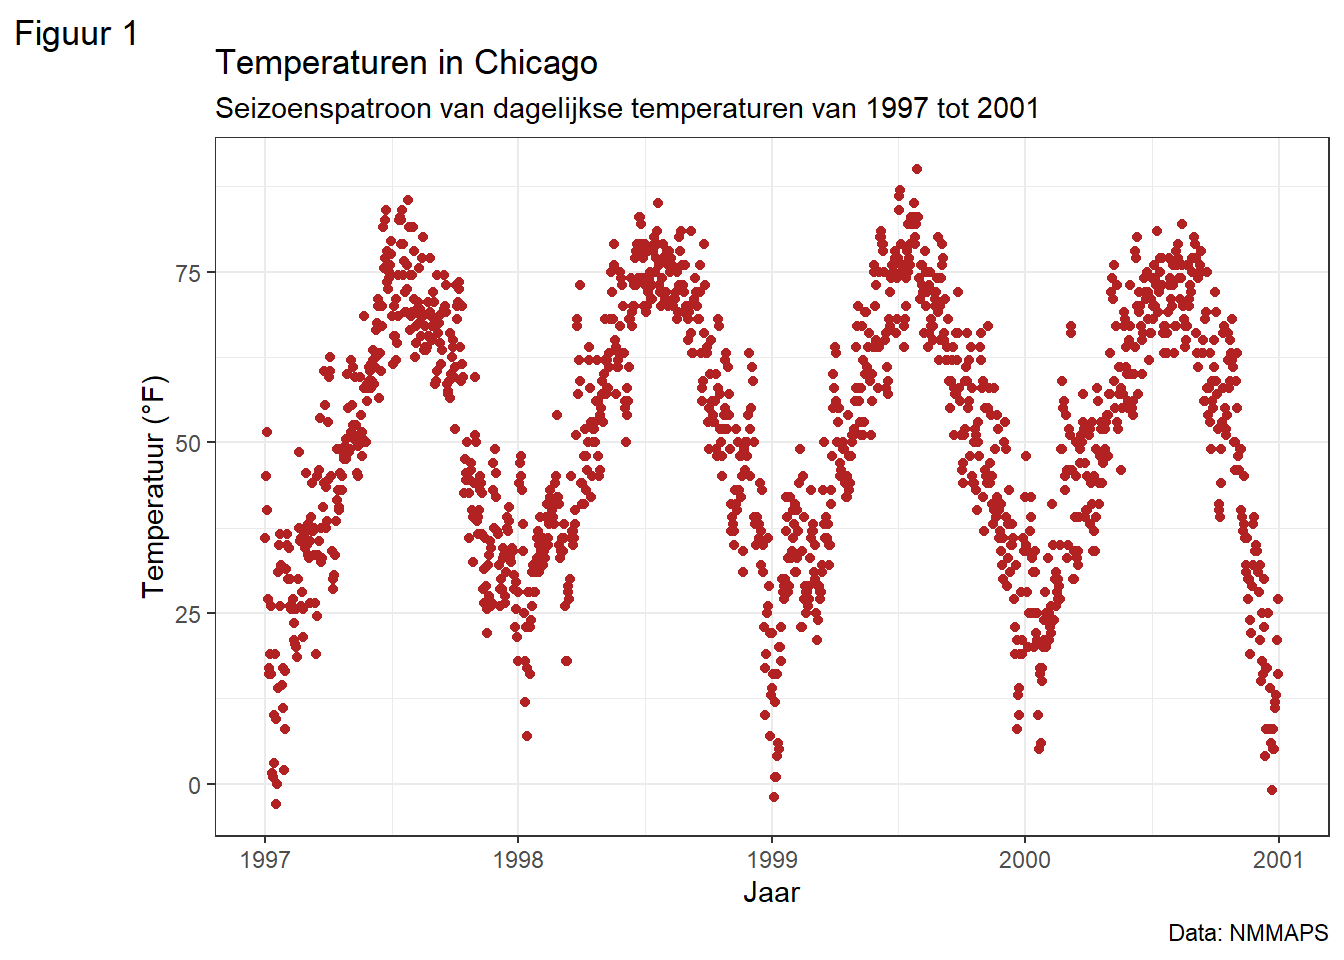
Titel vet maken & spatie toevoegen aan de basislijn
Nogmaals, omdat we de eigenschappen van een themaelement willen wijzigen, gebruiken we de theme() functie en zoals voor de tekstelementen axis.title en axis.text wijzigen we het lettertype en de marge. Alle volgende wijzigingen van thema-elementen werken niet alleen voor de titel, maar voor alle andere labels zoals plot.subtitle, plot.caption, plot.caption, legend.title, legend.text, axis.title en axis.text.
ggplot(chic, aes(x = date, y = temp)) +
  geom_point(color = "firebrick") +
  labs(x = "Jaar", y = "Temperatuur (°F)",
       title = "Temperaturen in Chicago") +
  theme(plot.title = element_text(face = "bold",
                                  margin = margin(10, 0, 10, 0),
                                  size = 14))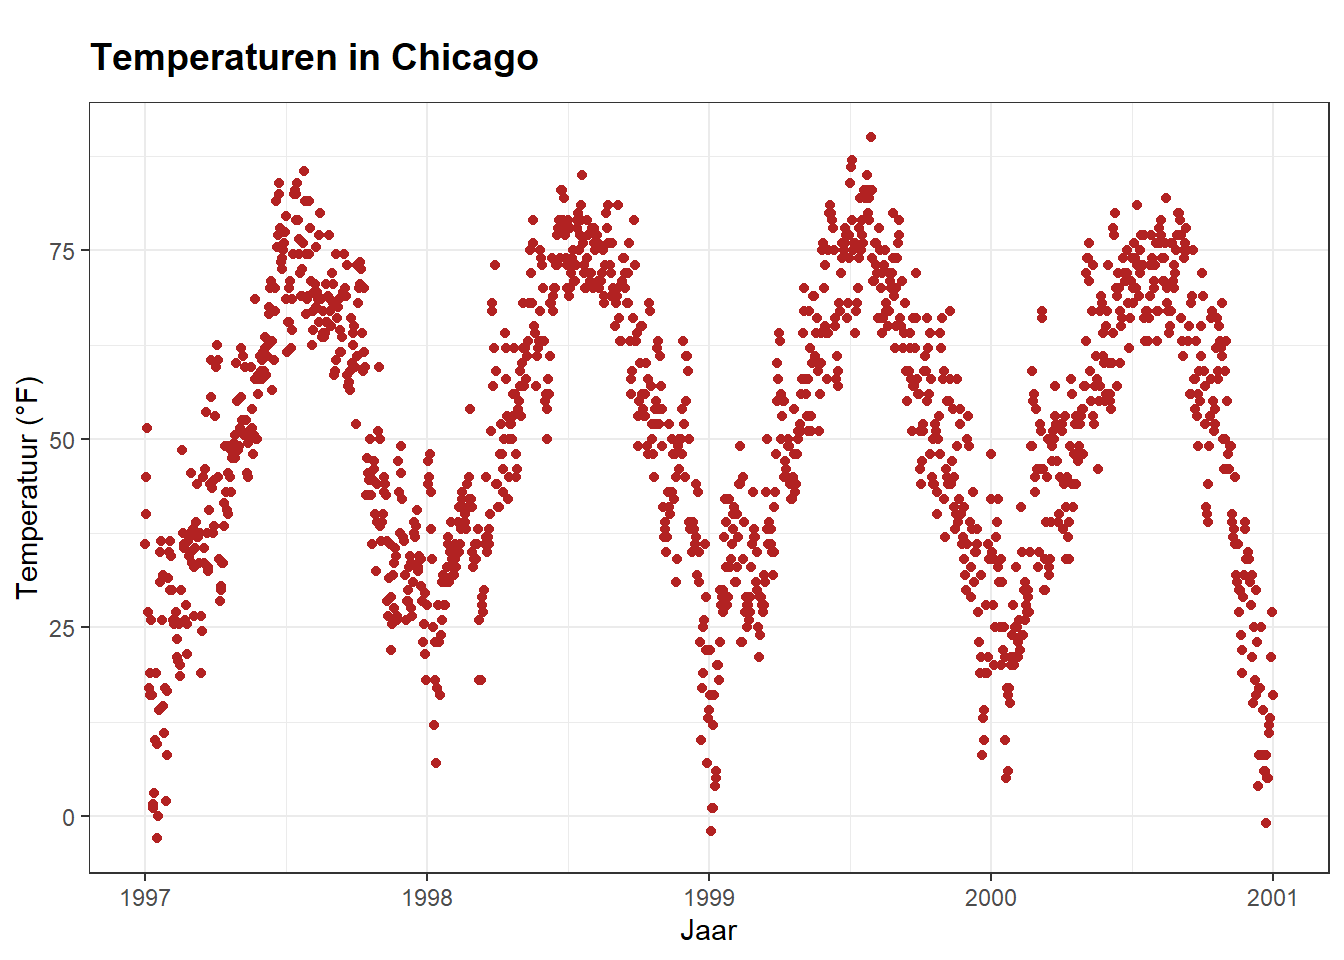
Een mooie manier om de volgorde van de marge-argumenten te onthouden is “t-r-oub-l-e”.
Positie van titels aanpassen
De algemene uitlijning (links, midden, rechts) wordt geregeld met hjust (dat staat voor horizontale aanpassing):
ggplot(chic, aes(x = date, y = temp)) +
  geom_point(color = "firebrick") +
  labs(x = "Year", y = NULL,
       title = "Temperaturen in Chicago",
       caption = "Data: NMMAPS") +
  theme(plot.title = element_text(hjust = 1, size = 16, face = "bold.italic"))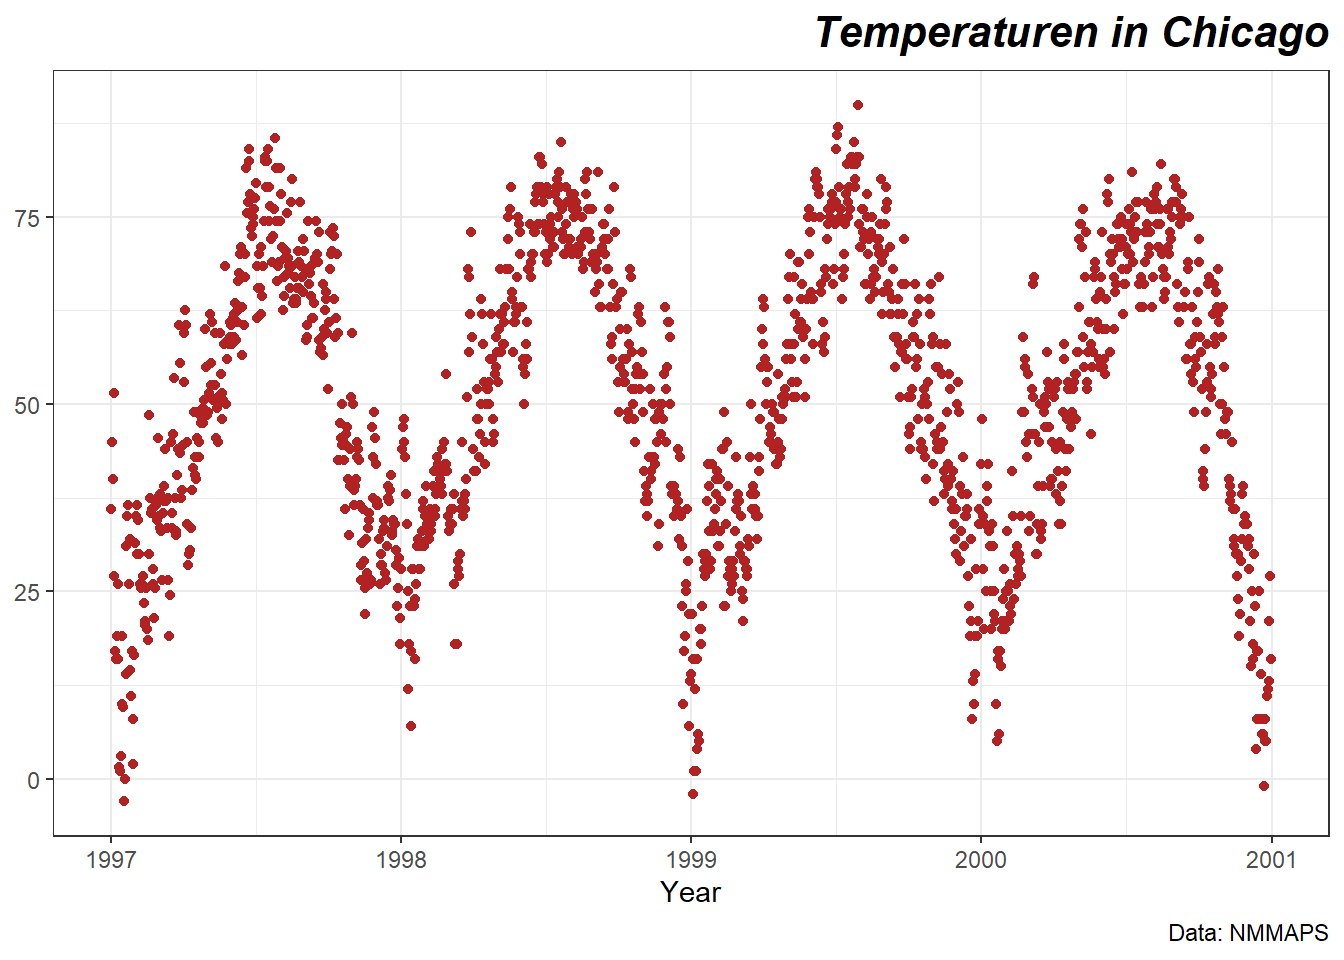
Natuurlijk is het daar ook mogelijk om de verticale uitlijning aan te passen, geregeld door vjust.
De gebruiker de uitlijning van de titel, ondertitel en bijschrift opgeven op basis van het paneelgebied (de standaard) of de plotmarge via plot.title.position en plot.caption.position. De laatste optie is in de meeste gevallen de betere keuze en veel mensen waren erg blij met deze nieuwe functie, omdat met name bij zeer lange y-as labels de uitlijning er verschrikkelijk uitziet:
(g <- ggplot(chic, aes(x = date, y = temp)) +
  geom_point(color = "firebrick") +
  scale_y_continuous(label = function(x) {return(paste(x, "Graden Fahrenheit"))}) +
  labs(x = "Jaar", y = NULL,
       title = "Temperaturen in Chicago 1997-2001
       in Graden Fahrenheit",
       caption = "Data: NMMAPS") +
  theme(plot.title = element_text(size = 14, face = "bold.italic"),
       plot.caption = element_text(hjust = 0)))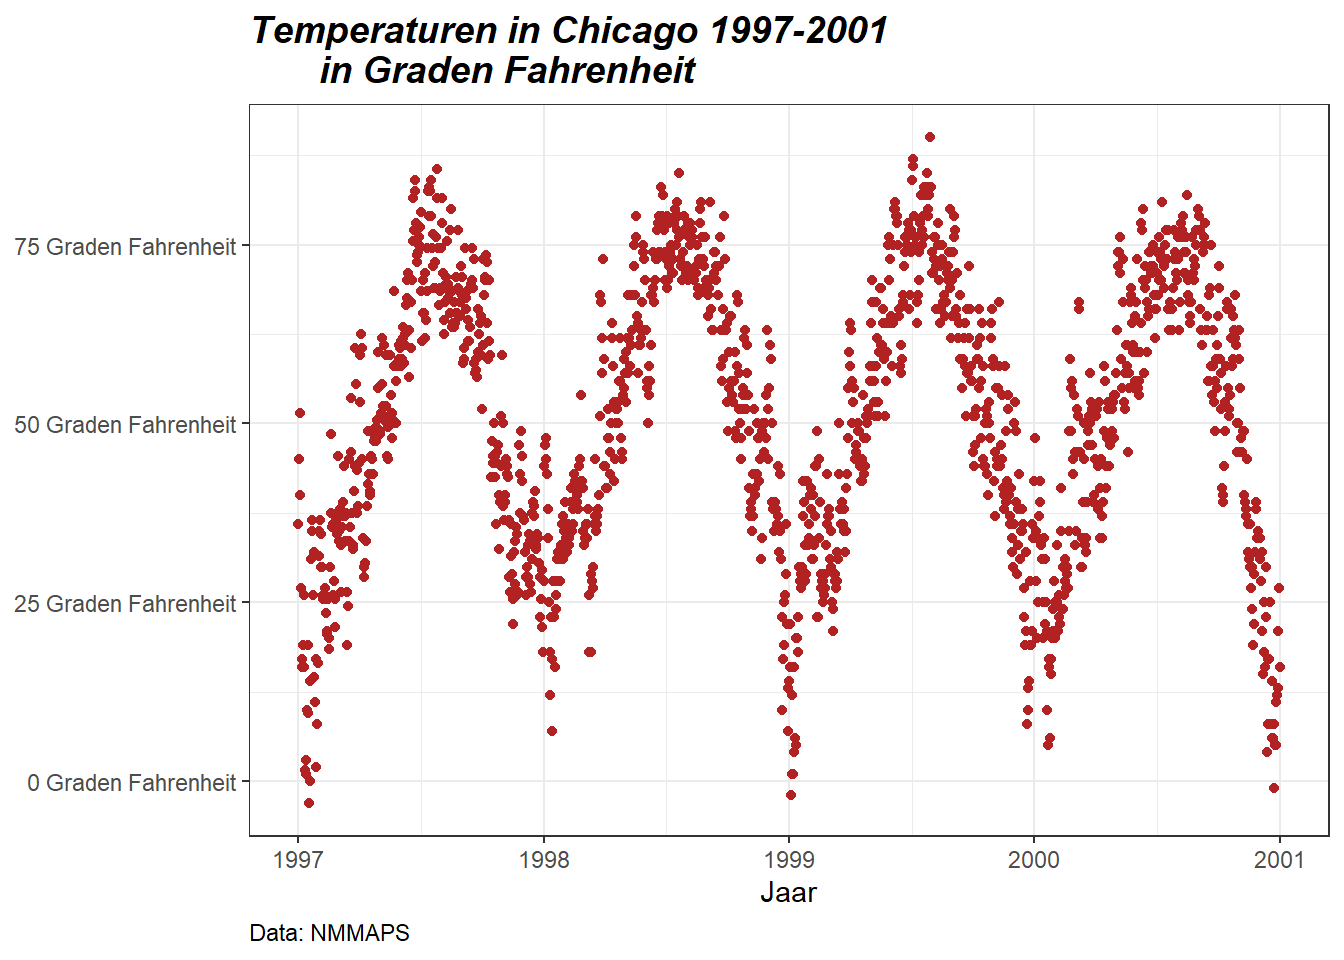
g + theme(plot.title.position = "plot",
          plot.caption.position = "plot")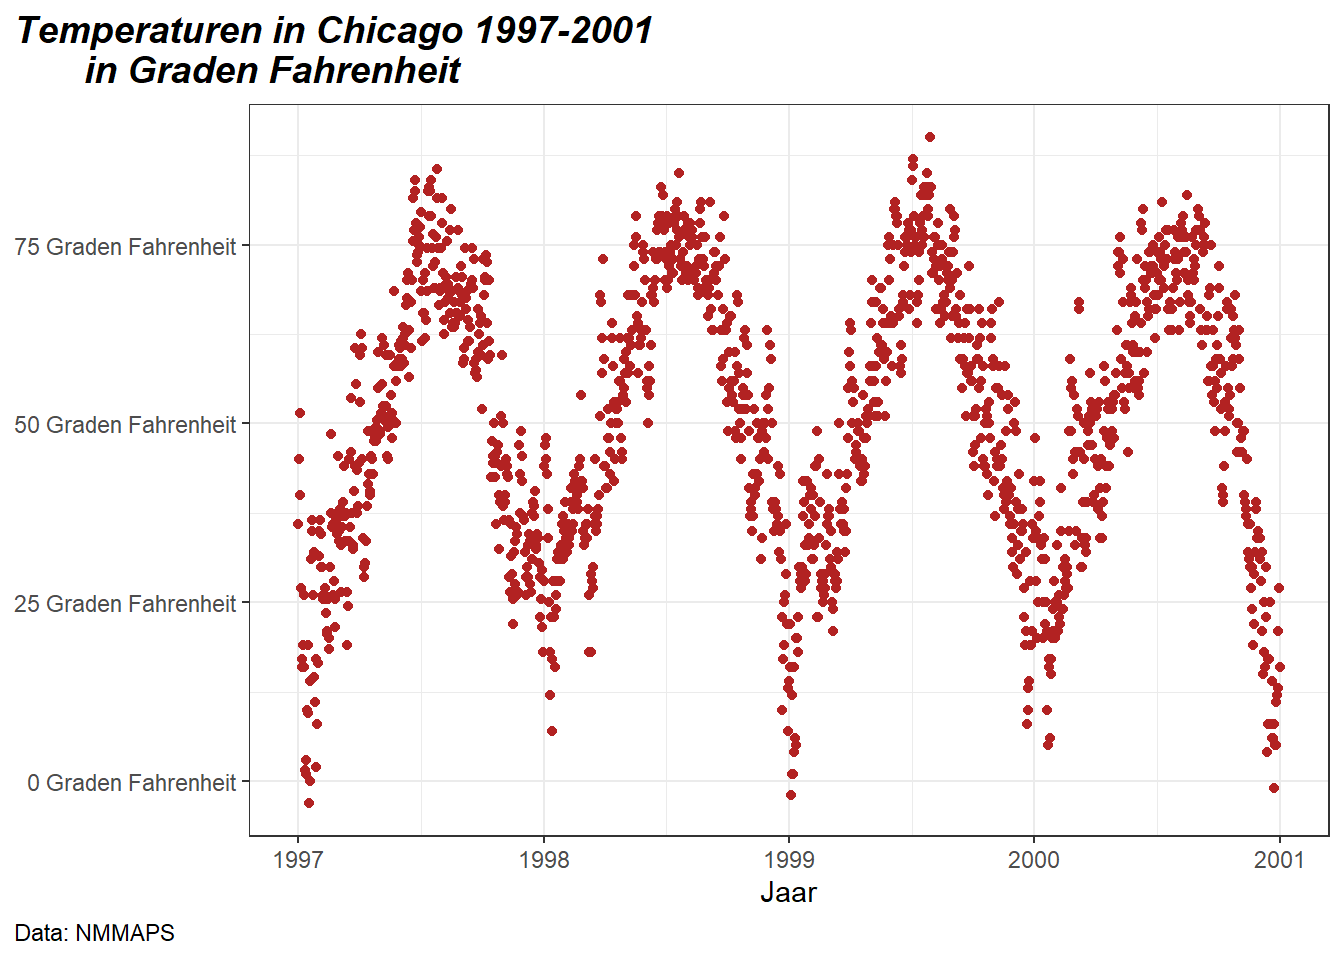
Gebruik een niet traditioneel lettertype in jouw titel
Je kunt ook verschillende lettertypes gebruiken, niet alleen het standaard lettertype dat door ggplot wordt geleverd (en dat verschilt van besturingssysteem tot besturingssysteem). Er zijn verschillende pakketten die je helpen om lettertypes te gebruiken die op je machine geïnstalleerd zijn (en die je misschien gebruikt in je office programma). Hier gebruik ik het showtext pakket dat het makkelijk maakt om verschillende types lettertypes (TrueType, OpenType, Type 1, web fonts, etc.) te gebruiken in R plots. Nadat we het pakket hebben geladen, moet je het lettertype importeren dat ook op je apparaat moet zijn geïnstalleerd. Ik gebruik regelmatig Google fonts dat geïmporteerd kan worden met de functie font_add_google() maar je kunt ook andere lettertypen toevoegen met font_add(). (Merk op dat zelfs in het geval van het gebruik van Google fonts je het font moet installeren - en Rstudio opnieuw moet opstarten - om het font te kunnen gebruiken).
library(showtext)
font_add_google("Playfair Display", ## name of Google font
                "Playfair")  ## name that will be used in R
font_add_google("Bangers", "Bangers")
Nu kunnen we die lettertype families gebruiken met - ja, je raadt het al - theme():
ggplot(chic, aes(x = date, y = temp)) +
  geom_point(color = "firebrick") +
  labs(x = "Jaar", y = "Temperatuur (°F)",
       title = "Temperaturen in Chicago",
       subtitle = "Dagelijkese temperaturen in °F van 1997 tot 2001") +
  theme(plot.title = element_text(family = "Bangers", hjust = .5, size = 25),
        plot.subtitle = element_text(family = "Playfair", hjust = .5, size = 15))
Warning in grid.Call(C_stringMetric, as.graphicsAnnot(x$label)): font family not
found in Windows font database
Warning in grid.Call(C_stringMetric, as.graphicsAnnot(x$label)): font family not
found in Windows font databaseWarning in grid.Call(C_textBounds, as.graphicsAnnot(x$label), x$x, x$y, : font
family not found in Windows font database
Warning in grid.Call(C_textBounds, as.graphicsAnnot(x$label), x$x, x$y, : font
family not found in Windows font database
Warning in grid.Call(C_textBounds, as.graphicsAnnot(x$label), x$x, x$y, : font
family not found in Windows font database
Warning in grid.Call(C_textBounds, as.graphicsAnnot(x$label), x$x, x$y, : font
family not found in Windows font database
Warning in grid.Call(C_textBounds, as.graphicsAnnot(x$label), x$x, x$y, : font
family not found in Windows font database
Warning in grid.Call(C_textBounds, as.graphicsAnnot(x$label), x$x, x$y, : font
family not found in Windows font database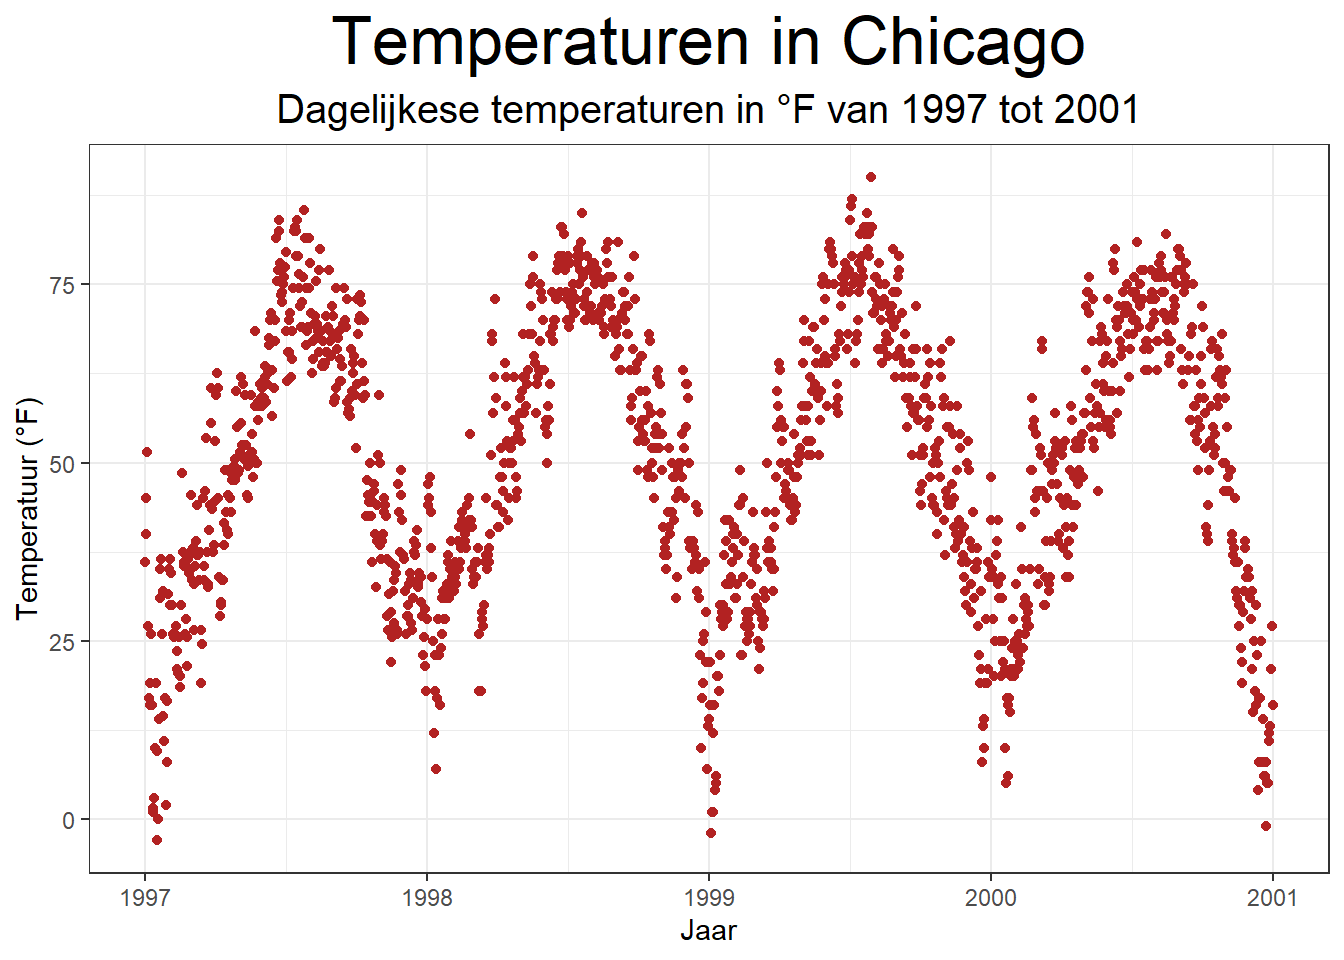
Je kunt ook een niet-standaard lettertype instellen voor alle tekstelementen van jouw plots, voor meer details zie “Working with themes”. Ik ga Roboto Condensed gebruiken als het nieuwe lettertype voor alle volgende plots.
font_add_google("Roboto Condensed", "Roboto Condensed")
theme_set(theme_bw(base_size = 12, base_family = "Roboto Condensed"))(Voorheen gebruikte deze handleiding het extrafont pakket, dat het tot vorig jaar prima deed. Plotseling kon ik geen nieuwe lettertypen meer toevoegen en nadat ik een nieuwe laptop had, vond het pakket helemaal geen lettertypen meer… Ik stel nu meestal het ragg pakket voor. Het is me echter niet gelukt om het te laten werken voor mijn homepage dus gebruik ik het showtext pakket dat ook geweldig is met het enige verschil dat je het lettertype dat je wilt gebruiken expliciet moet importeren met showtext. Het lijkt er echter op dat er enkele technische details zijn die niet optimaal door showtext worden opgelost, zodat je het pakket misschien als allerlaatste redmiddel wilt gebruiken.).
Afstand veranderen in multi-line tekst
Je kunt het lineheight argument gebruiken om de afstand tussen de regels te veranderen. In dit voorbeeld, heb ik de regels samengeknepen (lineheight < 1).
Wijzig de spatiëring in meer-regelige tekst
Je kunt het lineheight argument gebruiken om de afstand tussen de regels te veranderen. In dit voorbeeld, heb ik de regels samengeknepen (lineheight < 1).
ggplot(chic, aes(x = date, y = temp)) +
geom_point(color = "firebrick") +
labs(x = "Year", y = "Temperature (°F)") +
ggtitle("Temperatures in Chicago\nfrom 1997 to 2001") +
theme(plot.title = element_text(lineheight = .8, size = 16))Warning in grid.Call(C_stringMetric, as.graphicsAnnot(x$label)): font family not
found in Windows font database
Warning in grid.Call(C_stringMetric, as.graphicsAnnot(x$label)): font family not
found in Windows font database

Warning in grid.Call(C_stringMetric, as.graphicsAnnot(x$label)): font family not
found in Windows font database
Warning in grid.Call(C_textBounds, as.graphicsAnnot(x$label), x$x, x$y, : font
family not found in Windows font database
Warning in grid.Call(C_textBounds, as.graphicsAnnot(x$label), x$x, x$y, : font
family not found in Windows font database

Warning in grid.Call(C_textBounds, as.graphicsAnnot(x$label), x$x, x$y, : font
family not found in Windows font database

Warning in grid.Call(C_textBounds, as.graphicsAnnot(x$label), x$x, x$y, : font
family not found in Windows font database

Warning in grid.Call(C_textBounds, as.graphicsAnnot(x$label), x$x, x$y, : font
family not found in Windows font database

Warning in grid.Call(C_textBounds, as.graphicsAnnot(x$label), x$x, x$y, : font
family not found in Windows font database

Warning in grid.Call(C_textBounds, as.graphicsAnnot(x$label), x$x, x$y, : font
family not found in Windows font database
Warning in grid.Call(C_textBounds, as.graphicsAnnot(x$label), x$x, x$y, : font
family not found in Windows font database
Warning in grid.Call(C_textBounds, as.graphicsAnnot(x$label), x$x, x$y, : font
family not found in Windows font database
Warning in grid.Call(C_textBounds, as.graphicsAnnot(x$label), x$x, x$y, : font
family not found in Windows font databaseWarning in grid.Call.graphics(C_text, as.graphicsAnnot(x$label), x$x, x$y, :
font family not found in Windows font databaseWarning in grid.Call(C_textBounds, as.graphicsAnnot(x$label), x$x, x$y, : font
family not found in Windows font database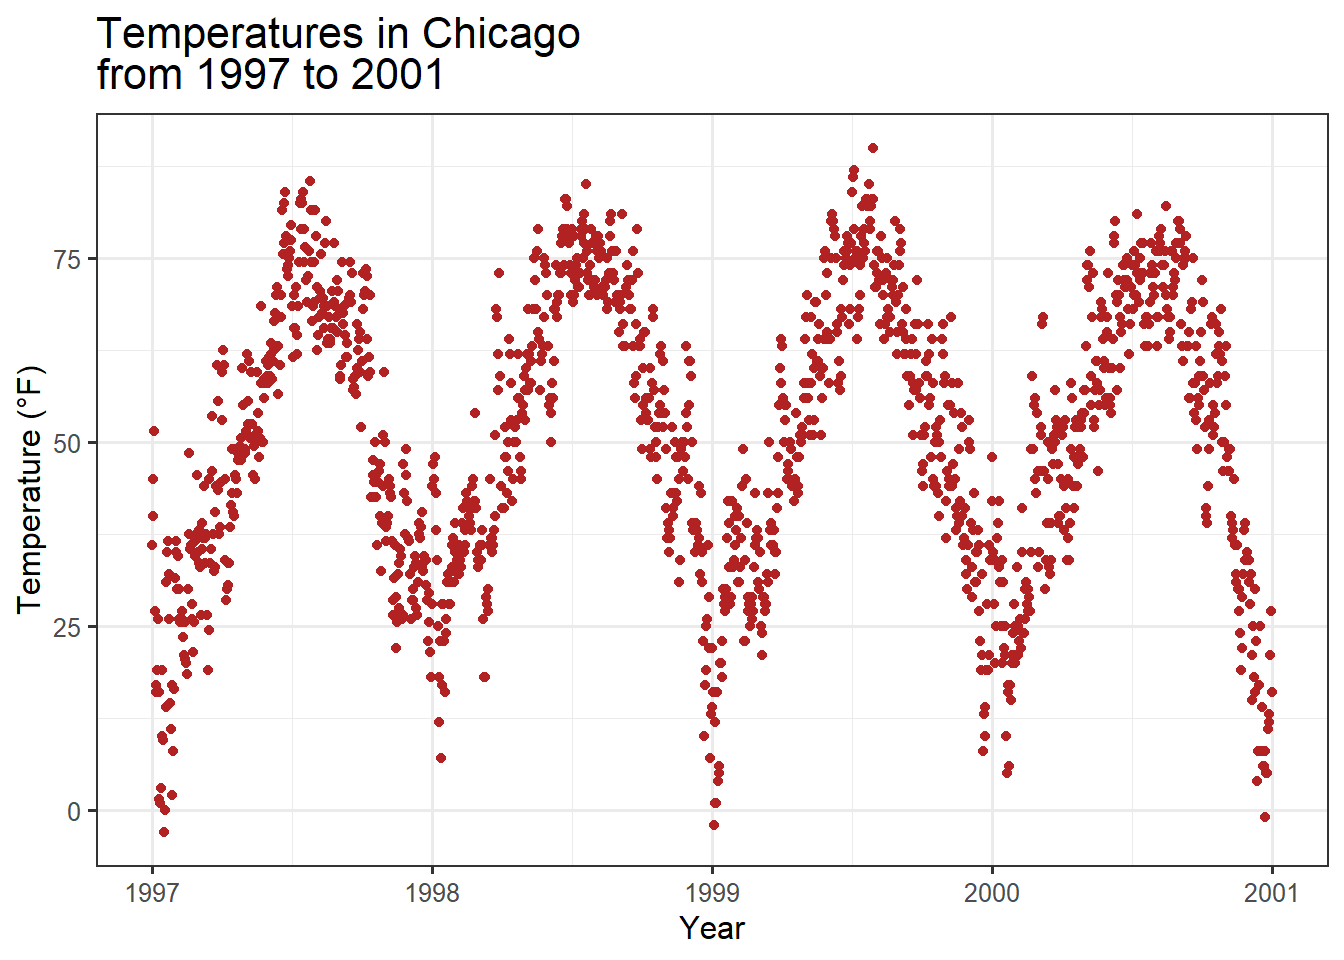
Met legenda’s werken
We zullen de plot een kleurcode geven op basis van het seizoen. Of om het op een meer ggplot-achtige manier te zeggen: we koppelen de variabele season aan de aesthetic color. Een leuke eigenschap van ggplot2 is dat het standaard een legenda toevoegt wanneer het een variabele aan een esthetiek koppelt. Je kunt zien dat de titel van de legenda standaard is wat we in het kleur argument hebben opgegeven:
ggplot(chic,
aes(x = date, y = temp, color = season)) +
geom_point() +
labs(x = "Jaar", y = "Temperatuur (°F)")Warning in grid.Call(C_textBounds, as.graphicsAnnot(x$label), x$x, x$y, : font
family not found in Windows font database
Warning in grid.Call(C_textBounds, as.graphicsAnnot(x$label), x$x, x$y, : font
family not found in Windows font database
Warning in grid.Call(C_textBounds, as.graphicsAnnot(x$label), x$x, x$y, : font
family not found in Windows font database
Warning in grid.Call(C_textBounds, as.graphicsAnnot(x$label), x$x, x$y, : font
family not found in Windows font database
Warning in grid.Call(C_textBounds, as.graphicsAnnot(x$label), x$x, x$y, : font
family not found in Windows font database
Warning in grid.Call(C_textBounds, as.graphicsAnnot(x$label), x$x, x$y, : font
family not found in Windows font database
Warning in grid.Call(C_textBounds, as.graphicsAnnot(x$label), x$x, x$y, : font
family not found in Windows font database
Warning in grid.Call(C_textBounds, as.graphicsAnnot(x$label), x$x, x$y, : font
family not found in Windows font database
Warning in grid.Call(C_textBounds, as.graphicsAnnot(x$label), x$x, x$y, : font
family not found in Windows font databaseWarning in grid.Call.graphics(C_text, as.graphicsAnnot(x$label), x$x, x$y, :
font family not found in Windows font databaseWarning in grid.Call(C_textBounds, as.graphicsAnnot(x$label), x$x, x$y, : font
family not found in Windows font database
Warning in grid.Call(C_textBounds, as.graphicsAnnot(x$label), x$x, x$y, : font
family not found in Windows font database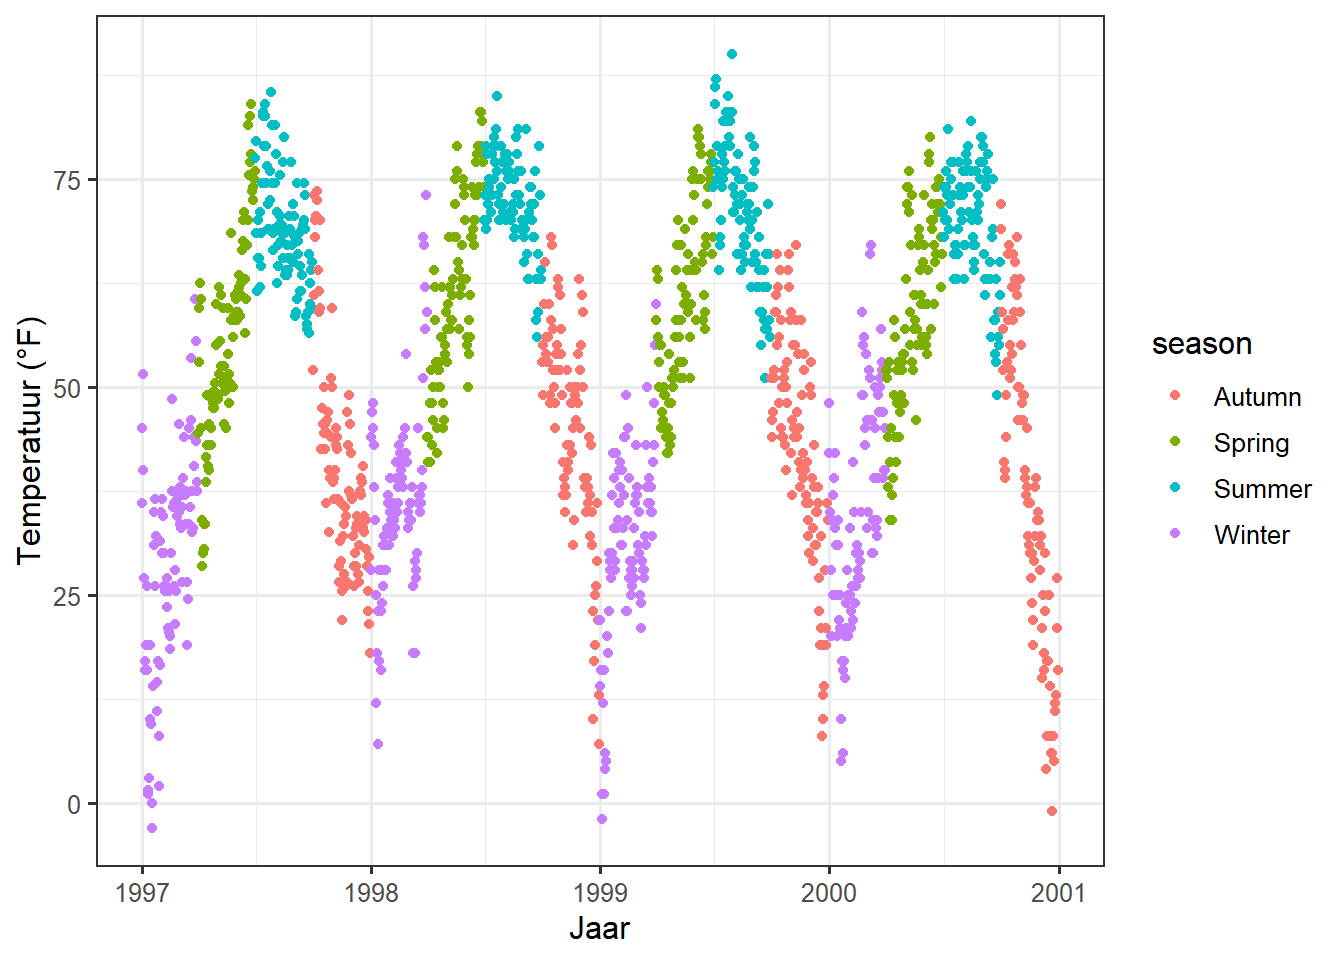
De legenda uitzetten
Een van de eerste vragen is vaak: “Hoe kan ik de legenda uitzetten?”.
Het is vrij eenvoudig en werkt altijd met theme(legend.position = "none"):
ggplot(chic,
aes(x = date, y = temp, color = season)) +
geom_point() +
labs(x = "Jaar", y = "Temperatuur (°F)") +
theme(legend.position = "none")Warning in grid.Call(C_textBounds, as.graphicsAnnot(x$label), x$x, x$y, : font
family not found in Windows font database
Warning in grid.Call(C_textBounds, as.graphicsAnnot(x$label), x$x, x$y, : font
family not found in Windows font database
Warning in grid.Call(C_textBounds, as.graphicsAnnot(x$label), x$x, x$y, : font
family not found in Windows font database
Warning in grid.Call(C_textBounds, as.graphicsAnnot(x$label), x$x, x$y, : font
family not found in Windows font database
Warning in grid.Call(C_textBounds, as.graphicsAnnot(x$label), x$x, x$y, : font
family not found in Windows font database
Warning in grid.Call(C_textBounds, as.graphicsAnnot(x$label), x$x, x$y, : font
family not found in Windows font database
Warning in grid.Call(C_textBounds, as.graphicsAnnot(x$label), x$x, x$y, : font
family not found in Windows font databaseWarning in grid.Call.graphics(C_text, as.graphicsAnnot(x$label), x$x, x$y, :
font family not found in Windows font database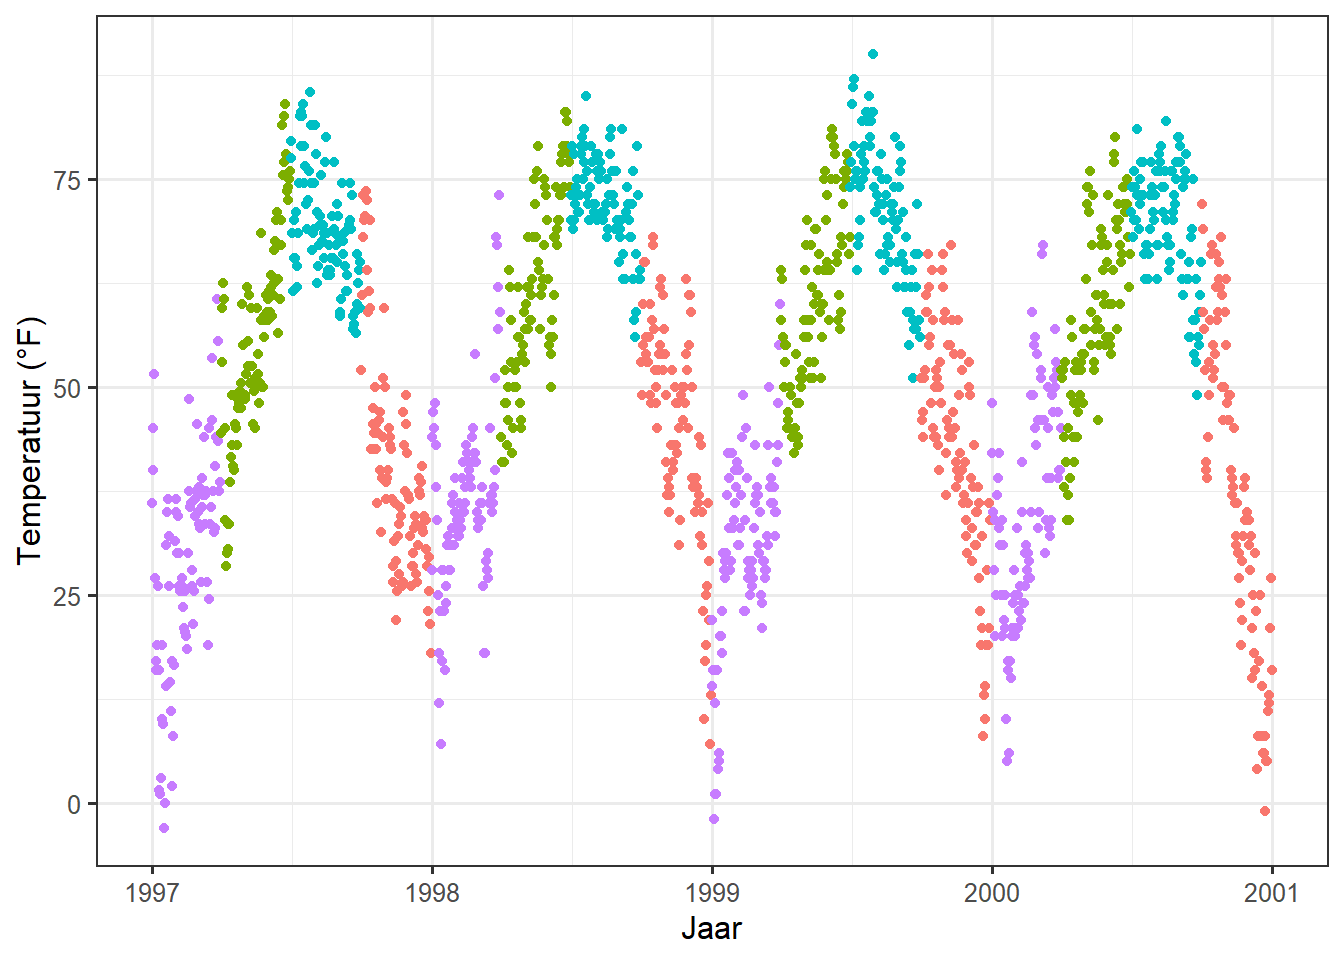
Je kunt ook guides(color = "none") of scale_color_discrete(guide = "none") gebruiken, afhankelijk van het specifieke geval. Terwijl de verandering van het thema-element alle legenda’s in een keer verwijdert, kunt je met de laatstgenoemde opties bepaalde legenda’s verwijderen terwijl sommige andere behouden blijven:
ggplot(chic,
aes(x = date, y = temp,
color = season, shape = season)) +
geom_point() +
labs(x = "Jaar", y = "Temperatuur (°F)") +
guides(color = "none")Warning in grid.Call(C_textBounds, as.graphicsAnnot(x$label), x$x, x$y, : font
family not found in Windows font database
Warning in grid.Call(C_textBounds, as.graphicsAnnot(x$label), x$x, x$y, : font
family not found in Windows font database
Warning in grid.Call(C_textBounds, as.graphicsAnnot(x$label), x$x, x$y, : font
family not found in Windows font database
Warning in grid.Call(C_textBounds, as.graphicsAnnot(x$label), x$x, x$y, : font
family not found in Windows font database
Warning in grid.Call(C_textBounds, as.graphicsAnnot(x$label), x$x, x$y, : font
family not found in Windows font database
Warning in grid.Call(C_textBounds, as.graphicsAnnot(x$label), x$x, x$y, : font
family not found in Windows font database
Warning in grid.Call(C_textBounds, as.graphicsAnnot(x$label), x$x, x$y, : font
family not found in Windows font database
Warning in grid.Call(C_textBounds, as.graphicsAnnot(x$label), x$x, x$y, : font
family not found in Windows font database
Warning in grid.Call(C_textBounds, as.graphicsAnnot(x$label), x$x, x$y, : font
family not found in Windows font databaseWarning in grid.Call.graphics(C_text, as.graphicsAnnot(x$label), x$x, x$y, :
font family not found in Windows font databaseWarning in grid.Call(C_textBounds, as.graphicsAnnot(x$label), x$x, x$y, : font
family not found in Windows font database
Warning in grid.Call(C_textBounds, as.graphicsAnnot(x$label), x$x, x$y, : font
family not found in Windows font database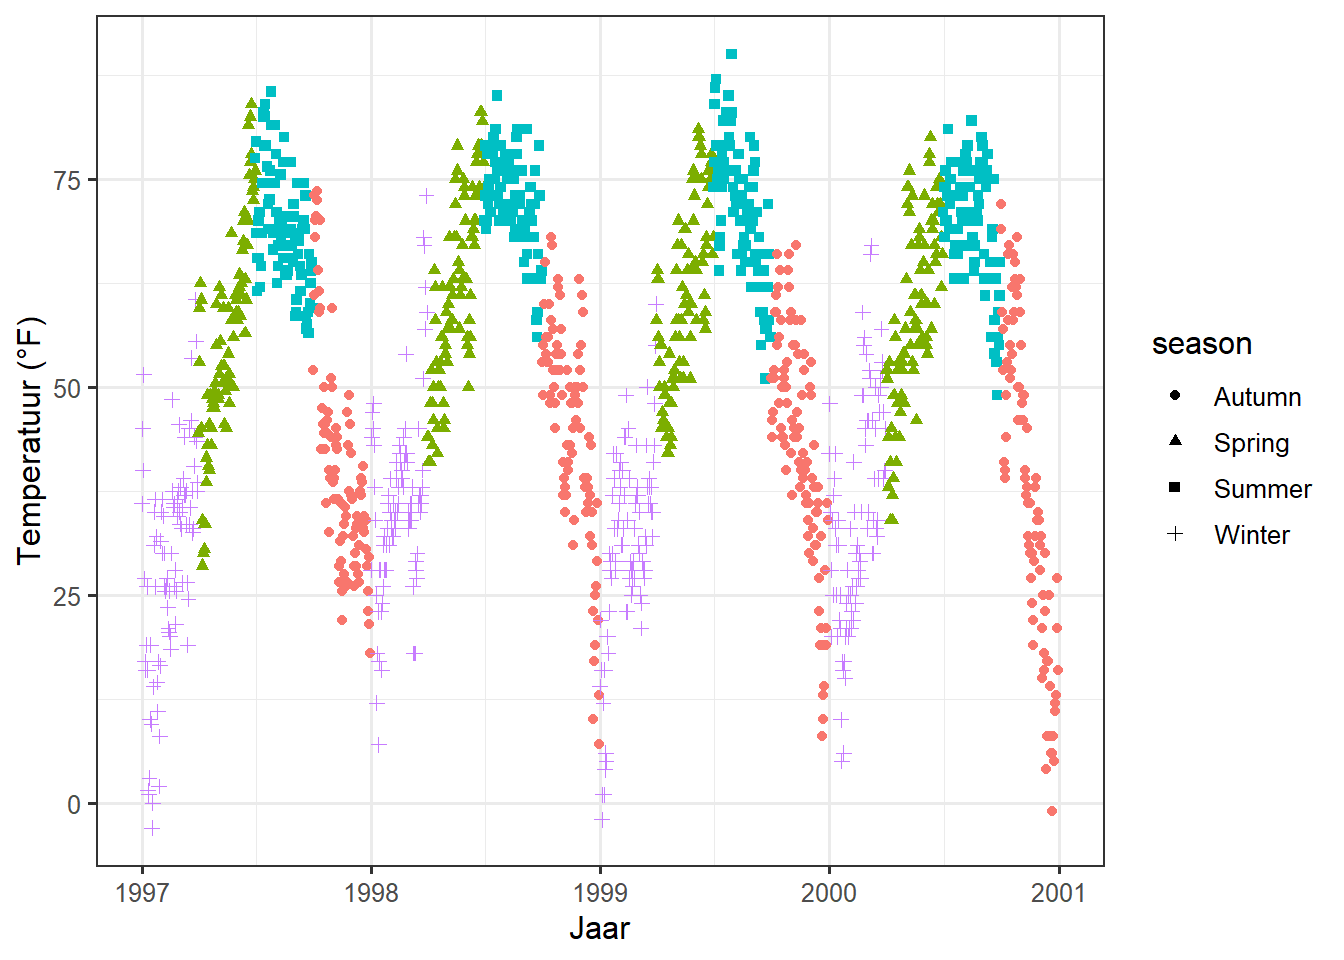
Hier, bijvoorbeeld, behouden we de legende voor de vormen terwijl we die voor de kleuren weggooien.
Verwijder legenda titels
Zoals we al geleerd hebben, gebruik element_blank() om niets te tekenen:
ggplot(chic, aes(x = date, y = temp, color = season)) +
geom_point() +
labs(x = "Jaar", y = "Temperatuur (°F)") +
theme(legend.title = element_blank())Warning in grid.Call(C_textBounds, as.graphicsAnnot(x$label), x$x, x$y, : font
family not found in Windows font database
Warning in grid.Call(C_textBounds, as.graphicsAnnot(x$label), x$x, x$y, : font
family not found in Windows font database
Warning in grid.Call(C_textBounds, as.graphicsAnnot(x$label), x$x, x$y, : font
family not found in Windows font database
Warning in grid.Call(C_textBounds, as.graphicsAnnot(x$label), x$x, x$y, : font
family not found in Windows font database
Warning in grid.Call(C_textBounds, as.graphicsAnnot(x$label), x$x, x$y, : font
family not found in Windows font database
Warning in grid.Call(C_textBounds, as.graphicsAnnot(x$label), x$x, x$y, : font
family not found in Windows font database
Warning in grid.Call(C_textBounds, as.graphicsAnnot(x$label), x$x, x$y, : font
family not found in Windows font database
Warning in grid.Call(C_textBounds, as.graphicsAnnot(x$label), x$x, x$y, : font
family not found in Windows font databaseWarning in grid.Call.graphics(C_text, as.graphicsAnnot(x$label), x$x, x$y, :
font family not found in Windows font databaseWarning in grid.Call(C_textBounds, as.graphicsAnnot(x$label), x$x, x$y, : font
family not found in Windows font database
Je kunt hetzelfde bereiken door de legendanaam op NULL te zetten, ofwel via
scale_color_discrete(name = NULL)oflabs(color = NULL).
Legenda positie veranderen
Als men de legenda niet rechts wil plaatsen, gebruikt men legend.position als argument in theme. Mogelijke posities zijn “boven”, “rechts” (wat de standaard is), “onder”, en “links”.You can achieve the same by setting the legend name to NULL, either via scale_color_discrete(name = NULL) or labs(color = NULL).
ggplot(chic, aes(x = date, y = temp, color = season)) +
geom_point() +
labs(x = "Jaar", y = "Temperatuur (°F)") +
theme(legend.position = "top")Warning in grid.Call(C_textBounds, as.graphicsAnnot(x$label), x$x, x$y, : font
family not found in Windows font database
Warning in grid.Call(C_textBounds, as.graphicsAnnot(x$label), x$x, x$y, : font
family not found in Windows font database
Warning in grid.Call(C_textBounds, as.graphicsAnnot(x$label), x$x, x$y, : font
family not found in Windows font database
Warning in grid.Call(C_textBounds, as.graphicsAnnot(x$label), x$x, x$y, : font
family not found in Windows font database
Warning in grid.Call(C_textBounds, as.graphicsAnnot(x$label), x$x, x$y, : font
family not found in Windows font database
Warning in grid.Call(C_textBounds, as.graphicsAnnot(x$label), x$x, x$y, : font
family not found in Windows font database
Warning in grid.Call(C_textBounds, as.graphicsAnnot(x$label), x$x, x$y, : font
family not found in Windows font database
Warning in grid.Call(C_textBounds, as.graphicsAnnot(x$label), x$x, x$y, : font
family not found in Windows font database
Warning in grid.Call(C_textBounds, as.graphicsAnnot(x$label), x$x, x$y, : font
family not found in Windows font databaseWarning in grid.Call.graphics(C_text, as.graphicsAnnot(x$label), x$x, x$y, :
font family not found in Windows font databaseWarning in grid.Call(C_textBounds, as.graphicsAnnot(x$label), x$x, x$y, : font
family not found in Windows font database
Warning in grid.Call(C_textBounds, as.graphicsAnnot(x$label), x$x, x$y, : font
family not found in Windows font database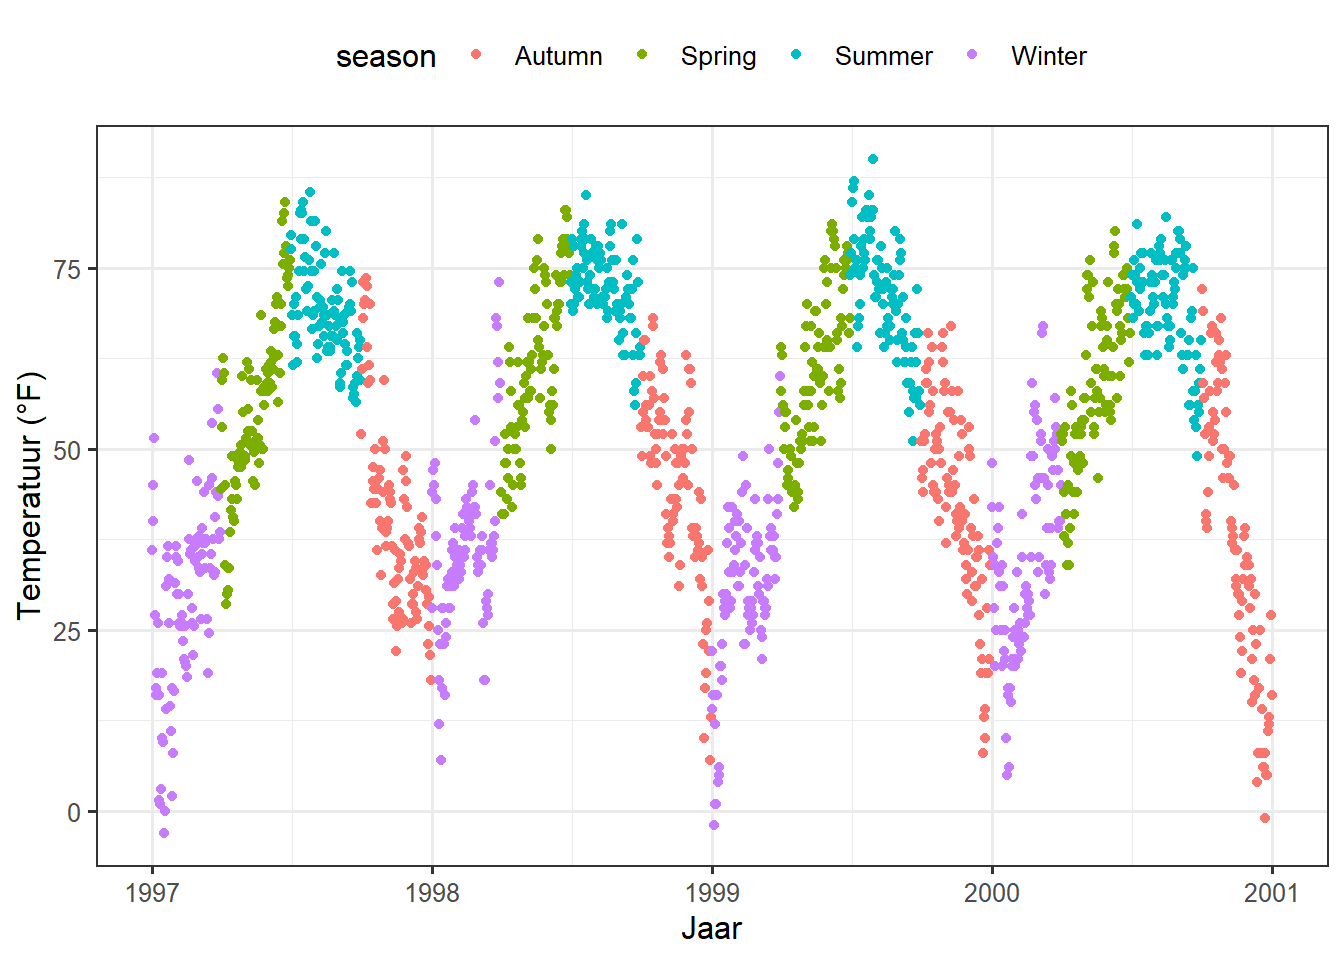
Je kunt de legenda ook binnen het paneel plaatsen door een vector op te geven met relatieve x en y coördinaten variërend van 0 (links of onder) tot 1 (rechts of boven):
ggplot(chic, aes(x = date, y = temp, color = season)) +
geom_point() +
labs(x = "Jaar", y = "Temperatuur (°F)",
color = NULL) +
theme(legend.position = c(.15, .15),
legend.background = element_rect(fill = "transparent"))Warning in grid.Call(C_textBounds, as.graphicsAnnot(x$label), x$x, x$y, : font
family not found in Windows font database
Warning in grid.Call(C_textBounds, as.graphicsAnnot(x$label), x$x, x$y, : font
family not found in Windows font database
Warning in grid.Call(C_textBounds, as.graphicsAnnot(x$label), x$x, x$y, : font
family not found in Windows font database
Warning in grid.Call(C_textBounds, as.graphicsAnnot(x$label), x$x, x$y, : font
family not found in Windows font database
Warning in grid.Call(C_textBounds, as.graphicsAnnot(x$label), x$x, x$y, : font
family not found in Windows font database
Warning in grid.Call(C_textBounds, as.graphicsAnnot(x$label), x$x, x$y, : font
family not found in Windows font database
Warning in grid.Call(C_textBounds, as.graphicsAnnot(x$label), x$x, x$y, : font
family not found in Windows font database
Warning in grid.Call(C_textBounds, as.graphicsAnnot(x$label), x$x, x$y, : font
family not found in Windows font databaseWarning in grid.Call.graphics(C_text, as.graphicsAnnot(x$label), x$x, x$y, :
font family not found in Windows font databaseWarning in grid.Call(C_textBounds, as.graphicsAnnot(x$label), x$x, x$y, : font
family not found in Windows font database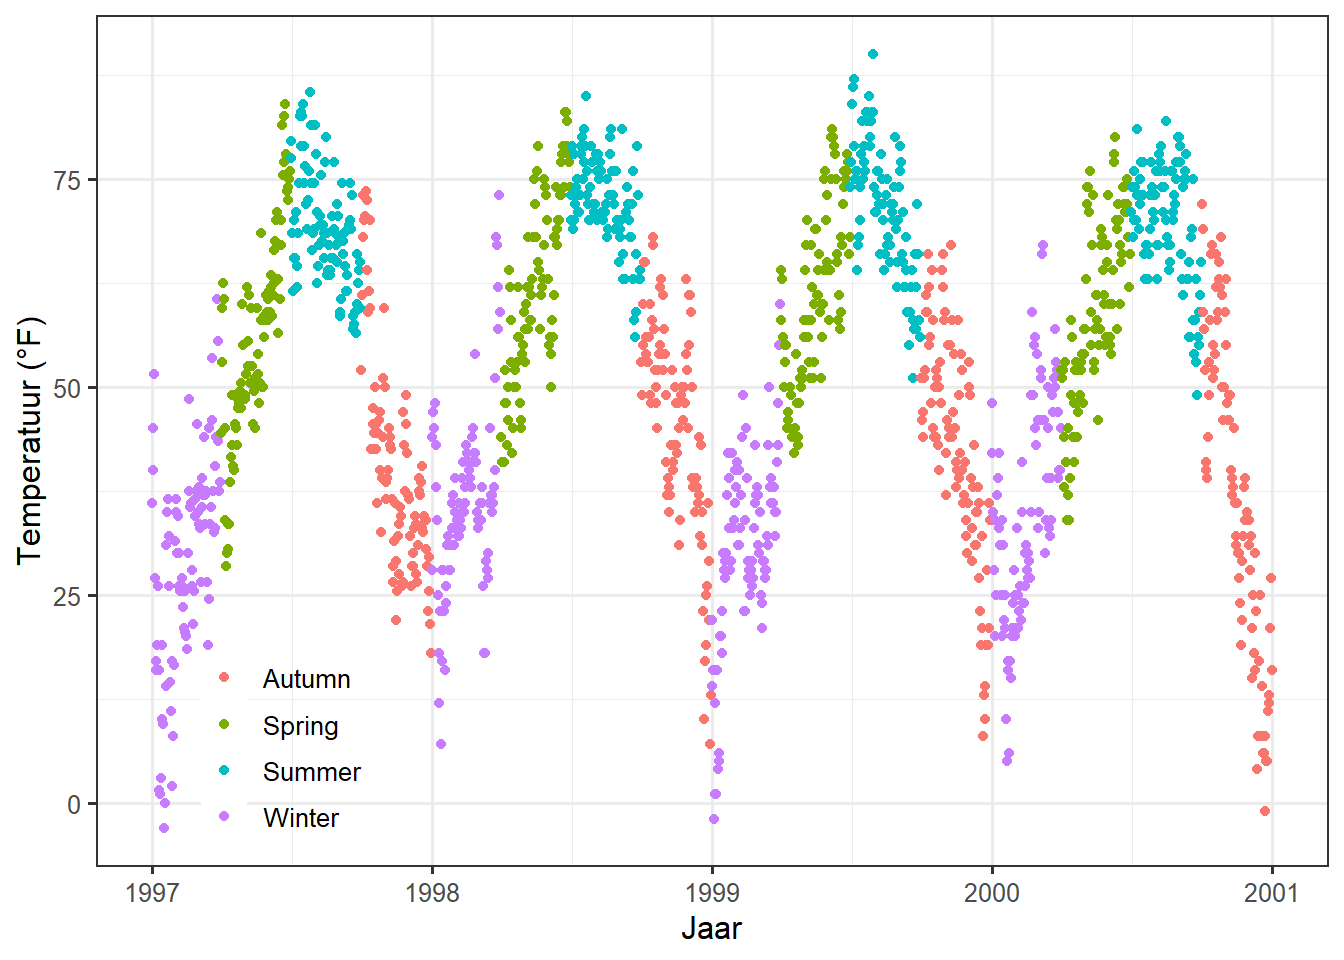
Hier overschrijf ik ook de standaard witte legende achtergrond met een transparante vulling om er zeker van te zijn dat de legende geen data punten verbergt.
Legenda richting wijzigen
Zoals je gezien hebt, is de legende-richting standaard verticaal, maar horizontaal als je de “top” of “bottom” positie kiest. Maar u kunt de richting ook veranderen zoals u wilt:
ggplot(chic, aes(x = date, y = temp, color = season)) +
geom_point() +
labs(x = "Jaar", y = "Temperatuur (°F)") +
theme(legend.position = c(.5, .97),
legend.background = element_rect(fill = "transparent")) +
guides(color = guide_legend(direction = "horizontal"))Warning in grid.Call(C_textBounds, as.graphicsAnnot(x$label), x$x, x$y, : font
family not found in Windows font database
Warning in grid.Call(C_textBounds, as.graphicsAnnot(x$label), x$x, x$y, : font
family not found in Windows font database
Warning in grid.Call(C_textBounds, as.graphicsAnnot(x$label), x$x, x$y, : font
family not found in Windows font database
Warning in grid.Call(C_textBounds, as.graphicsAnnot(x$label), x$x, x$y, : font
family not found in Windows font database
Warning in grid.Call(C_textBounds, as.graphicsAnnot(x$label), x$x, x$y, : font
family not found in Windows font database
Warning in grid.Call(C_textBounds, as.graphicsAnnot(x$label), x$x, x$y, : font
family not found in Windows font database
Warning in grid.Call(C_textBounds, as.graphicsAnnot(x$label), x$x, x$y, : font
family not found in Windows font database
Warning in grid.Call(C_textBounds, as.graphicsAnnot(x$label), x$x, x$y, : font
family not found in Windows font database
Warning in grid.Call(C_textBounds, as.graphicsAnnot(x$label), x$x, x$y, : font
family not found in Windows font databaseWarning in grid.Call.graphics(C_text, as.graphicsAnnot(x$label), x$x, x$y, :
font family not found in Windows font databaseWarning in grid.Call(C_textBounds, as.graphicsAnnot(x$label), x$x, x$y, : font
family not found in Windows font database
Warning in grid.Call(C_textBounds, as.graphicsAnnot(x$label), x$x, x$y, : font
family not found in Windows font database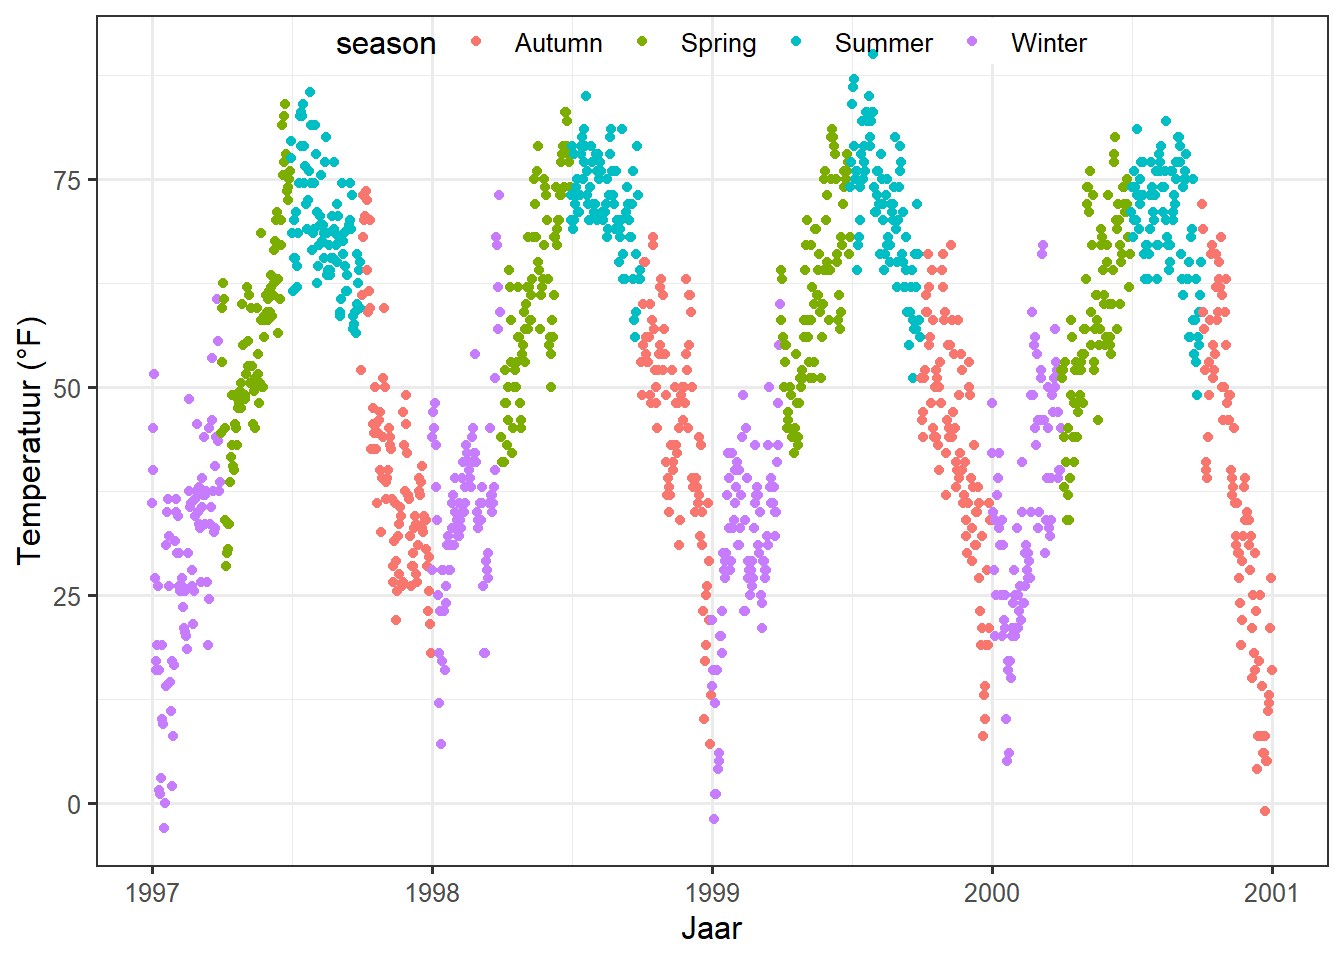
Stijl van de legende titel veranderen
U kunt het uiterlijk van de legendatitel veranderen door het thema-element legend.title aan te passen:
ggplot(chic, aes(x = date, y = temp, color = season)) +
geom_point() +
labs(x = "Jaar", y = "Temperatuur (°F)") +
theme(legend.title = element_text(family = "Playfair",
color = "chocolate",
size = 14, face = "bold"))Warning in grid.Call(C_stringMetric, as.graphicsAnnot(x$label)): font family not
found in Windows font databaseWarning in grid.Call(C_textBounds, as.graphicsAnnot(x$label), x$x, x$y, : font
family not found in Windows font database
Warning in grid.Call(C_textBounds, as.graphicsAnnot(x$label), x$x, x$y, : font
family not found in Windows font database
Warning in grid.Call(C_textBounds, as.graphicsAnnot(x$label), x$x, x$y, : font
family not found in Windows font database
Warning in grid.Call(C_textBounds, as.graphicsAnnot(x$label), x$x, x$y, : font
family not found in Windows font database
Warning in grid.Call(C_textBounds, as.graphicsAnnot(x$label), x$x, x$y, : font
family not found in Windows font database
Warning in grid.Call(C_textBounds, as.graphicsAnnot(x$label), x$x, x$y, : font
family not found in Windows font database
Warning in grid.Call(C_textBounds, as.graphicsAnnot(x$label), x$x, x$y, : font
family not found in Windows font database
Warning in grid.Call(C_textBounds, as.graphicsAnnot(x$label), x$x, x$y, : font
family not found in Windows font database
Warning in grid.Call(C_textBounds, as.graphicsAnnot(x$label), x$x, x$y, : font
family not found in Windows font databaseWarning in grid.Call.graphics(C_text, as.graphicsAnnot(x$label), x$x, x$y, :
font family not found in Windows font databaseWarning in grid.Call(C_textBounds, as.graphicsAnnot(x$label), x$x, x$y, : font
family not found in Windows font database
Warning in grid.Call(C_textBounds, as.graphicsAnnot(x$label), x$x, x$y, : font
family not found in Windows font database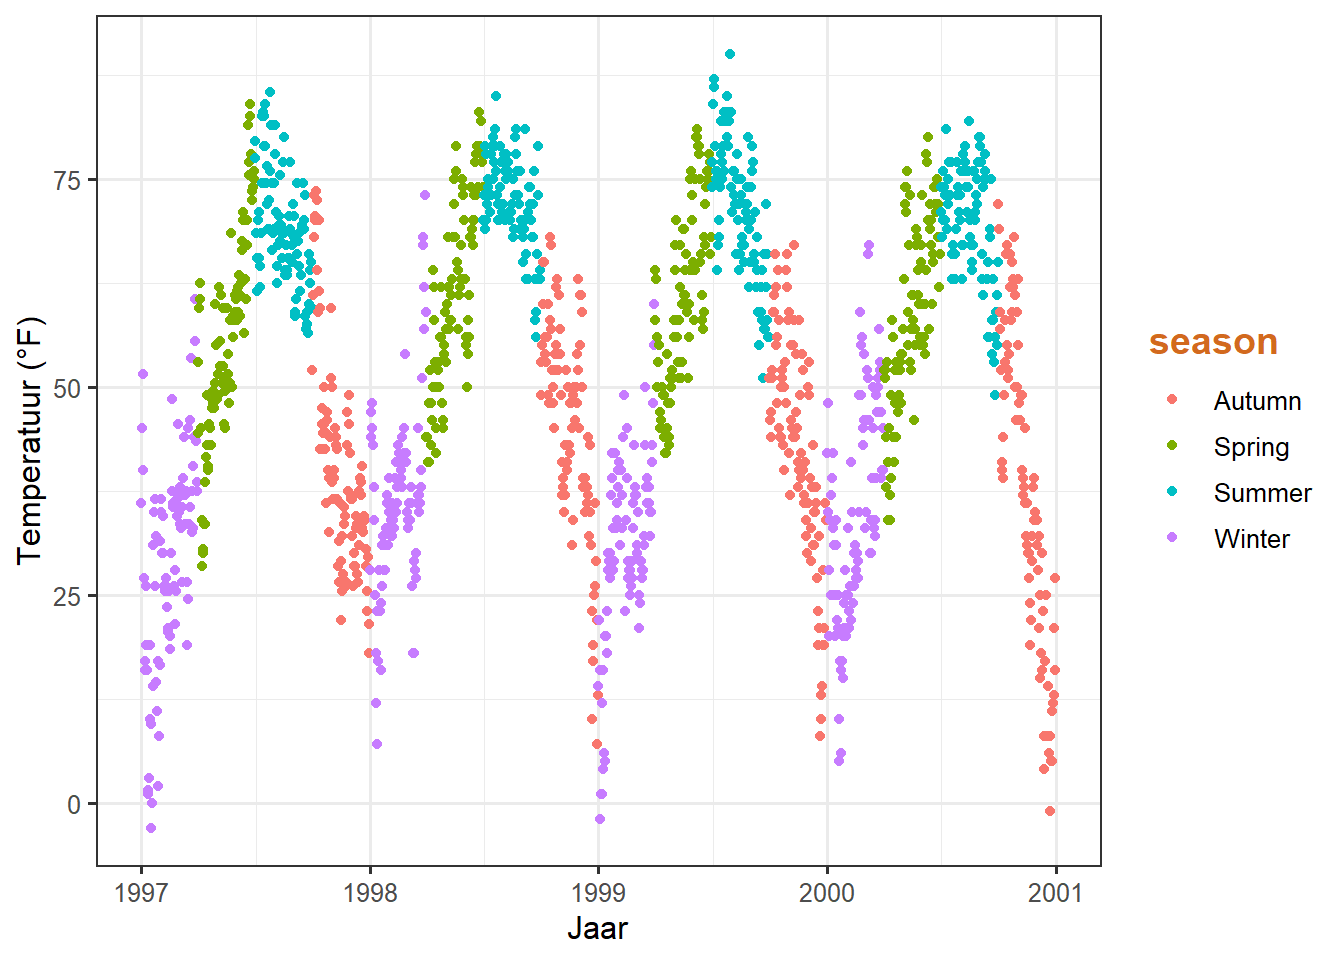
Titel legenda wijzigen
De eenvoudigste manier om de titel van de legenda te veranderen is de labs() laag:
ggplot(chic, aes(x = date, y = temp, color = season)) +
geom_point() +
labs(x = "Jaar", y = "Temperatuur (°F)",
color = "Seizoenen\ngeïndiceerd\ndoor kleuren:") +
theme(legend.title = element_text(family = "Playfair",
color = "chocolate",
size = 14, face = "bold"))Warning in grid.Call(C_textBounds, as.graphicsAnnot(x$label), x$x, x$y, : font
family not found in Windows font database
Warning in grid.Call(C_textBounds, as.graphicsAnnot(x$label), x$x, x$y, : font
family not found in Windows font database
Warning in grid.Call(C_textBounds, as.graphicsAnnot(x$label), x$x, x$y, : font
family not found in Windows font database
Warning in grid.Call(C_textBounds, as.graphicsAnnot(x$label), x$x, x$y, : font
family not found in Windows font database
Warning in grid.Call(C_textBounds, as.graphicsAnnot(x$label), x$x, x$y, : font
family not found in Windows font database
Warning in grid.Call(C_textBounds, as.graphicsAnnot(x$label), x$x, x$y, : font
family not found in Windows font database
Warning in grid.Call(C_textBounds, as.graphicsAnnot(x$label), x$x, x$y, : font
family not found in Windows font database
Warning in grid.Call(C_textBounds, as.graphicsAnnot(x$label), x$x, x$y, : font
family not found in Windows font database
Warning in grid.Call(C_textBounds, as.graphicsAnnot(x$label), x$x, x$y, : font
family not found in Windows font databaseWarning in grid.Call.graphics(C_text, as.graphicsAnnot(x$label), x$x, x$y, :
font family not found in Windows font databaseWarning in grid.Call(C_textBounds, as.graphicsAnnot(x$label), x$x, x$y, : font
family not found in Windows font database
Warning in grid.Call(C_textBounds, as.graphicsAnnot(x$label), x$x, x$y, : font
family not found in Windows font database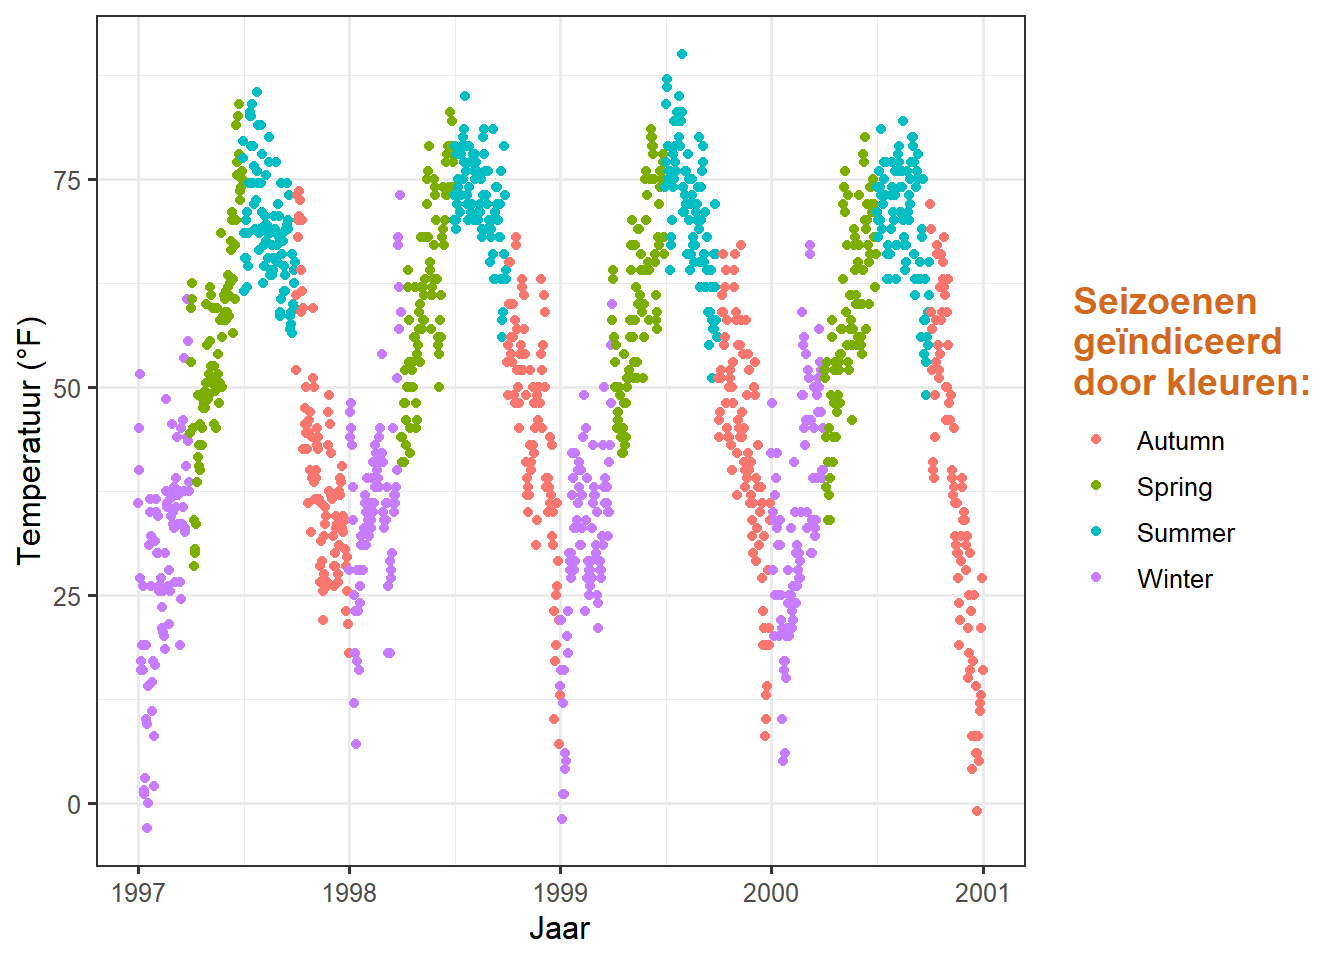
De legenda details kunnen worden veranderd via scale_color_discrete(name = "title") of guides(color = guide_legend("title")):
ggplot(chic, aes(x = date, y = temp, color = season)) +
geom_point() +
labs(x = "Jaar", y = "Temperatuur (°F)") +
theme(legend.title = element_text(family = "Playfair",
color = "chocolate",
size = 14, face = "bold")) +
scale_color_discrete(name = "Seizoenen\ngeïndiceerd\ndoor kleuren:")Warning in grid.Call(C_textBounds, as.graphicsAnnot(x$label), x$x, x$y, : font
family not found in Windows font database
Warning in grid.Call(C_textBounds, as.graphicsAnnot(x$label), x$x, x$y, : font
family not found in Windows font database
Warning in grid.Call(C_textBounds, as.graphicsAnnot(x$label), x$x, x$y, : font
family not found in Windows font database
Warning in grid.Call(C_textBounds, as.graphicsAnnot(x$label), x$x, x$y, : font
family not found in Windows font database
Warning in grid.Call(C_textBounds, as.graphicsAnnot(x$label), x$x, x$y, : font
family not found in Windows font database
Warning in grid.Call(C_textBounds, as.graphicsAnnot(x$label), x$x, x$y, : font
family not found in Windows font database
Warning in grid.Call(C_textBounds, as.graphicsAnnot(x$label), x$x, x$y, : font
family not found in Windows font database
Warning in grid.Call(C_textBounds, as.graphicsAnnot(x$label), x$x, x$y, : font
family not found in Windows font database
Warning in grid.Call(C_textBounds, as.graphicsAnnot(x$label), x$x, x$y, : font
family not found in Windows font databaseWarning in grid.Call.graphics(C_text, as.graphicsAnnot(x$label), x$x, x$y, :
font family not found in Windows font databaseWarning in grid.Call(C_textBounds, as.graphicsAnnot(x$label), x$x, x$y, : font
family not found in Windows font database
Warning in grid.Call(C_textBounds, as.graphicsAnnot(x$label), x$x, x$y, : font
family not found in Windows font database
Verander de volgorde van de legenda toetsen
We kunnen dit bereiken door de niveaus van season te veranderen:
chic$season <-
factor(chic$season,
levels = c("Winter", "Spring", "Summer", "Autumn"))
ggplot(chic, aes(x = date, y = temp, color = season)) +
geom_point() +
labs(x = "Jaar", y = "Temperatuur (°F)")Warning in grid.Call(C_textBounds, as.graphicsAnnot(x$label), x$x, x$y, : font
family not found in Windows font database
Warning in grid.Call(C_textBounds, as.graphicsAnnot(x$label), x$x, x$y, : font
family not found in Windows font database
Warning in grid.Call(C_textBounds, as.graphicsAnnot(x$label), x$x, x$y, : font
family not found in Windows font database
Warning in grid.Call(C_textBounds, as.graphicsAnnot(x$label), x$x, x$y, : font
family not found in Windows font database
Warning in grid.Call(C_textBounds, as.graphicsAnnot(x$label), x$x, x$y, : font
family not found in Windows font database
Warning in grid.Call(C_textBounds, as.graphicsAnnot(x$label), x$x, x$y, : font
family not found in Windows font database
Warning in grid.Call(C_textBounds, as.graphicsAnnot(x$label), x$x, x$y, : font
family not found in Windows font database
Warning in grid.Call(C_textBounds, as.graphicsAnnot(x$label), x$x, x$y, : font
family not found in Windows font database
Warning in grid.Call(C_textBounds, as.graphicsAnnot(x$label), x$x, x$y, : font
family not found in Windows font databaseWarning in grid.Call.graphics(C_text, as.graphicsAnnot(x$label), x$x, x$y, :
font family not found in Windows font databaseWarning in grid.Call(C_textBounds, as.graphicsAnnot(x$label), x$x, x$y, : font
family not found in Windows font database
Warning in grid.Call(C_textBounds, as.graphicsAnnot(x$label), x$x, x$y, : font
family not found in Windows font database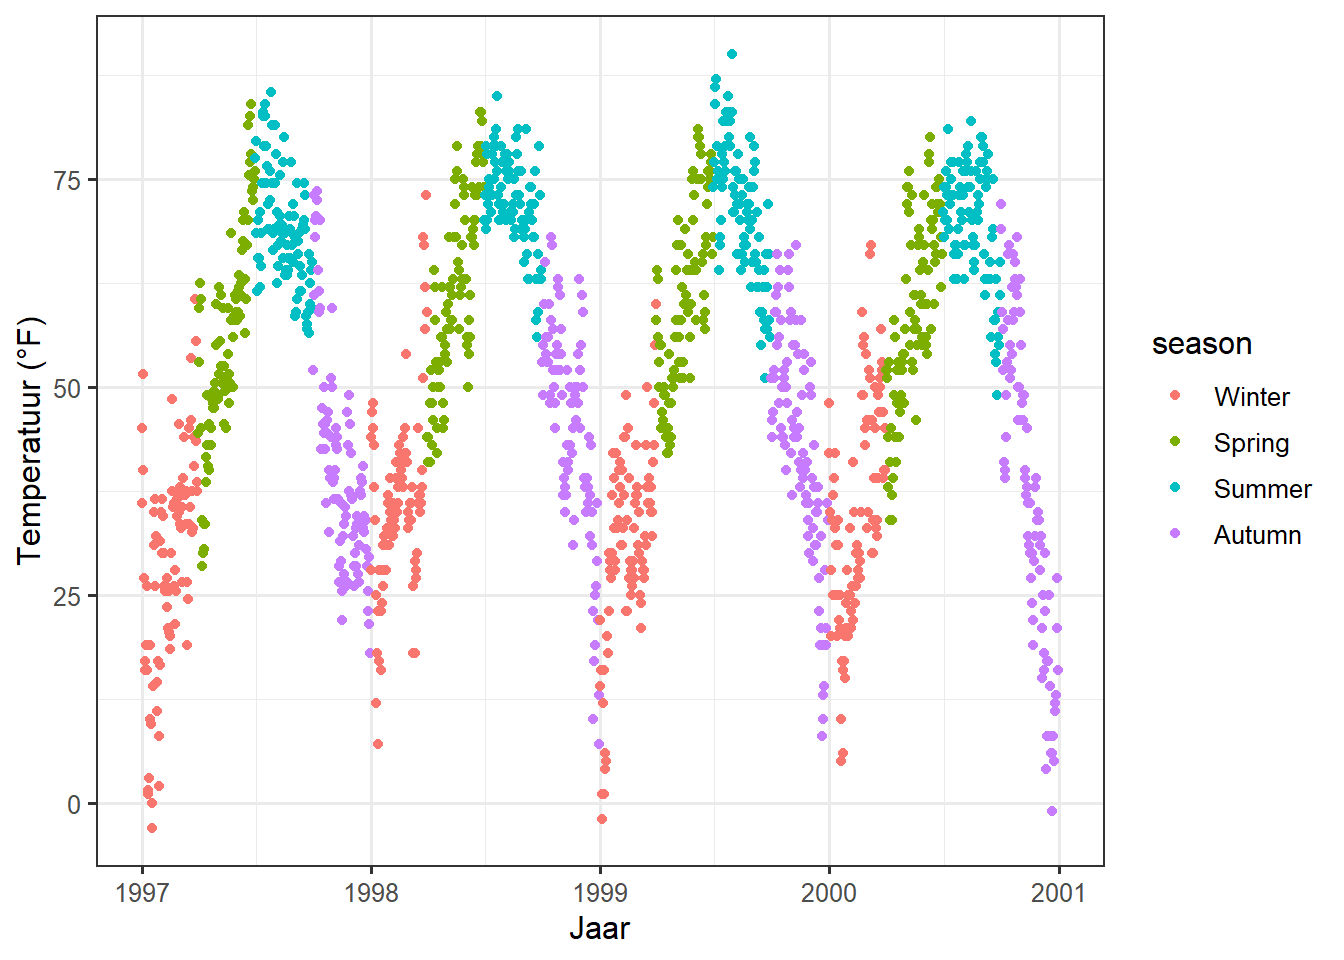
Legendalabels veranderen
We gaan de seizoenen vervangen door de maanden die ze bestrijken door een vector van namen op te geven in de scale_color_discrete() aanroep:
ggplot(chic, aes(x = date, y = temp, color = season)) +
geom_point() +
labs(x = "Jaar", y = "Temperatuur (°F)") +
scale_color_discrete(
name = "Seasons:",
labels = c("Mar—May", "Jun—Aug", "Sep—Nov", "Dec—Feb")
) +
theme(legend.title = element_text(
family = "Playfair", color = "chocolate", size = 14, face = 2
))Warning in grid.Call(C_textBounds, as.graphicsAnnot(x$label), x$x, x$y, : font
family not found in Windows font database
Warning in grid.Call(C_textBounds, as.graphicsAnnot(x$label), x$x, x$y, : font
family not found in Windows font database
Warning in grid.Call(C_textBounds, as.graphicsAnnot(x$label), x$x, x$y, : font
family not found in Windows font database
Warning in grid.Call(C_textBounds, as.graphicsAnnot(x$label), x$x, x$y, : font
family not found in Windows font database
Warning in grid.Call(C_textBounds, as.graphicsAnnot(x$label), x$x, x$y, : font
family not found in Windows font database
Warning in grid.Call(C_textBounds, as.graphicsAnnot(x$label), x$x, x$y, : font
family not found in Windows font database
Warning in grid.Call(C_textBounds, as.graphicsAnnot(x$label), x$x, x$y, : font
family not found in Windows font database
Warning in grid.Call(C_textBounds, as.graphicsAnnot(x$label), x$x, x$y, : font
family not found in Windows font database
Warning in grid.Call(C_textBounds, as.graphicsAnnot(x$label), x$x, x$y, : font
family not found in Windows font databaseWarning in grid.Call.graphics(C_text, as.graphicsAnnot(x$label), x$x, x$y, :
font family not found in Windows font databaseWarning in grid.Call(C_textBounds, as.graphicsAnnot(x$label), x$x, x$y, : font
family not found in Windows font database
Warning in grid.Call(C_textBounds, as.graphicsAnnot(x$label), x$x, x$y, : font
family not found in Windows font database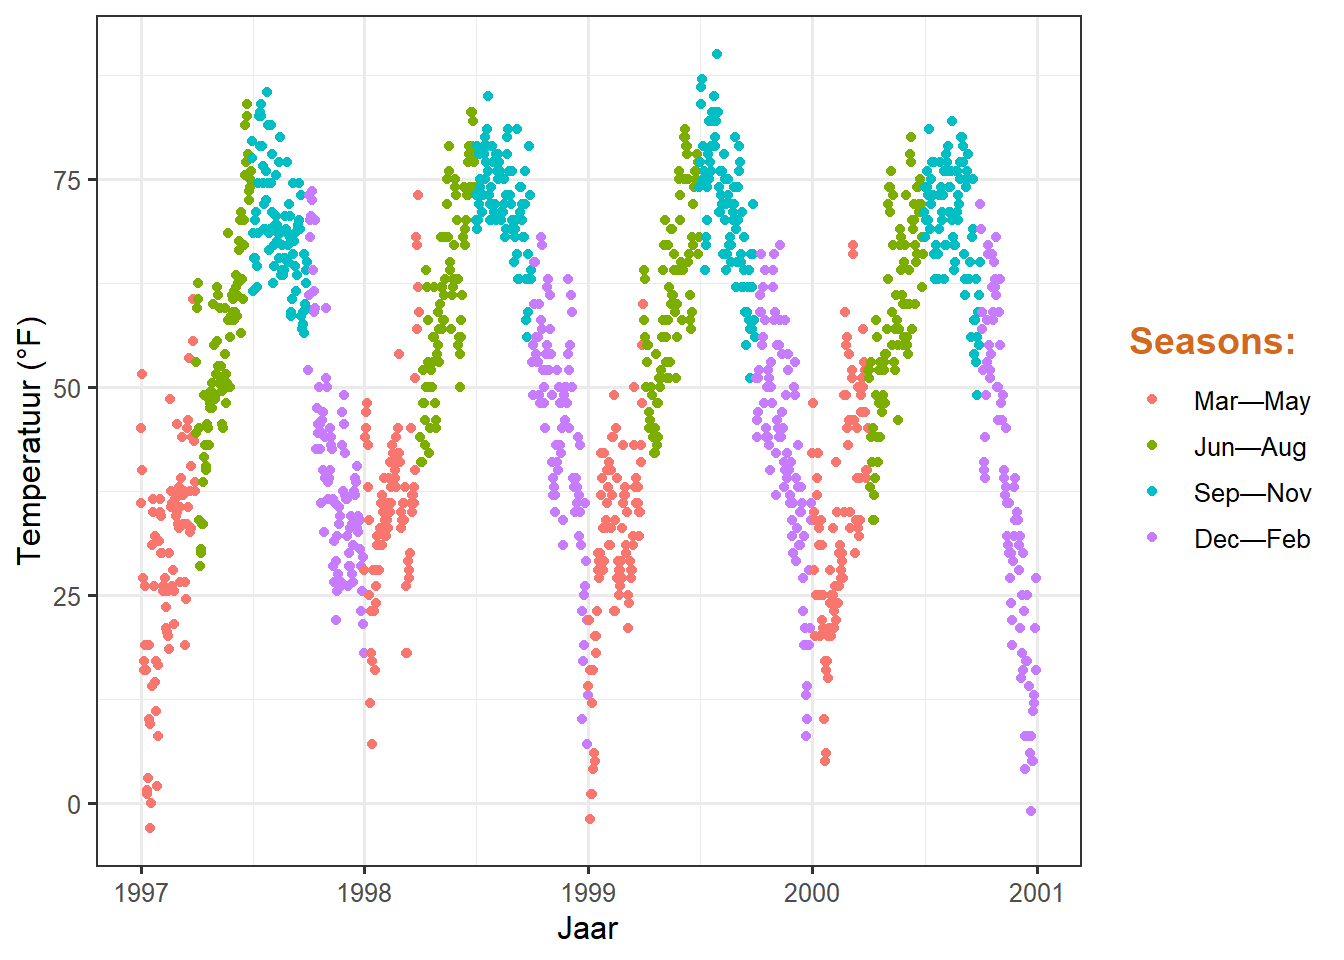
Achtergrondvakken in de legenda wijzigen
Om de achtergrondkleur (vulling) van de legenda toetsen te veranderen, passen we de instelling voor het thema element legend.key aan:
ggplot(chic, aes(x = date, y = temp, color = season)) +
geom_point() +
labs(x = "Year", y = "Temperature (°F)") +
theme(legend.key = element_rect(fill = "darkgoldenrod1"),
legend.title = element_text(family = "Playfair",
color = "chocolate",
size = 14, face = 2)) +
scale_color_discrete("Seasons:")Warning in grid.Call(C_textBounds, as.graphicsAnnot(x$label), x$x, x$y, : font
family not found in Windows font database
Warning in grid.Call(C_textBounds, as.graphicsAnnot(x$label), x$x, x$y, : font
family not found in Windows font database
Warning in grid.Call(C_textBounds, as.graphicsAnnot(x$label), x$x, x$y, : font
family not found in Windows font database
Warning in grid.Call(C_textBounds, as.graphicsAnnot(x$label), x$x, x$y, : font
family not found in Windows font database
Warning in grid.Call(C_textBounds, as.graphicsAnnot(x$label), x$x, x$y, : font
family not found in Windows font database
Warning in grid.Call(C_textBounds, as.graphicsAnnot(x$label), x$x, x$y, : font
family not found in Windows font database
Warning in grid.Call(C_textBounds, as.graphicsAnnot(x$label), x$x, x$y, : font
family not found in Windows font database
Warning in grid.Call(C_textBounds, as.graphicsAnnot(x$label), x$x, x$y, : font
family not found in Windows font database
Warning in grid.Call(C_textBounds, as.graphicsAnnot(x$label), x$x, x$y, : font
family not found in Windows font databaseWarning in grid.Call.graphics(C_text, as.graphicsAnnot(x$label), x$x, x$y, :
font family not found in Windows font databaseWarning in grid.Call(C_textBounds, as.graphicsAnnot(x$label), x$x, x$y, : font
family not found in Windows font database
Warning in grid.Call(C_textBounds, as.graphicsAnnot(x$label), x$x, x$y, : font
family not found in Windows font database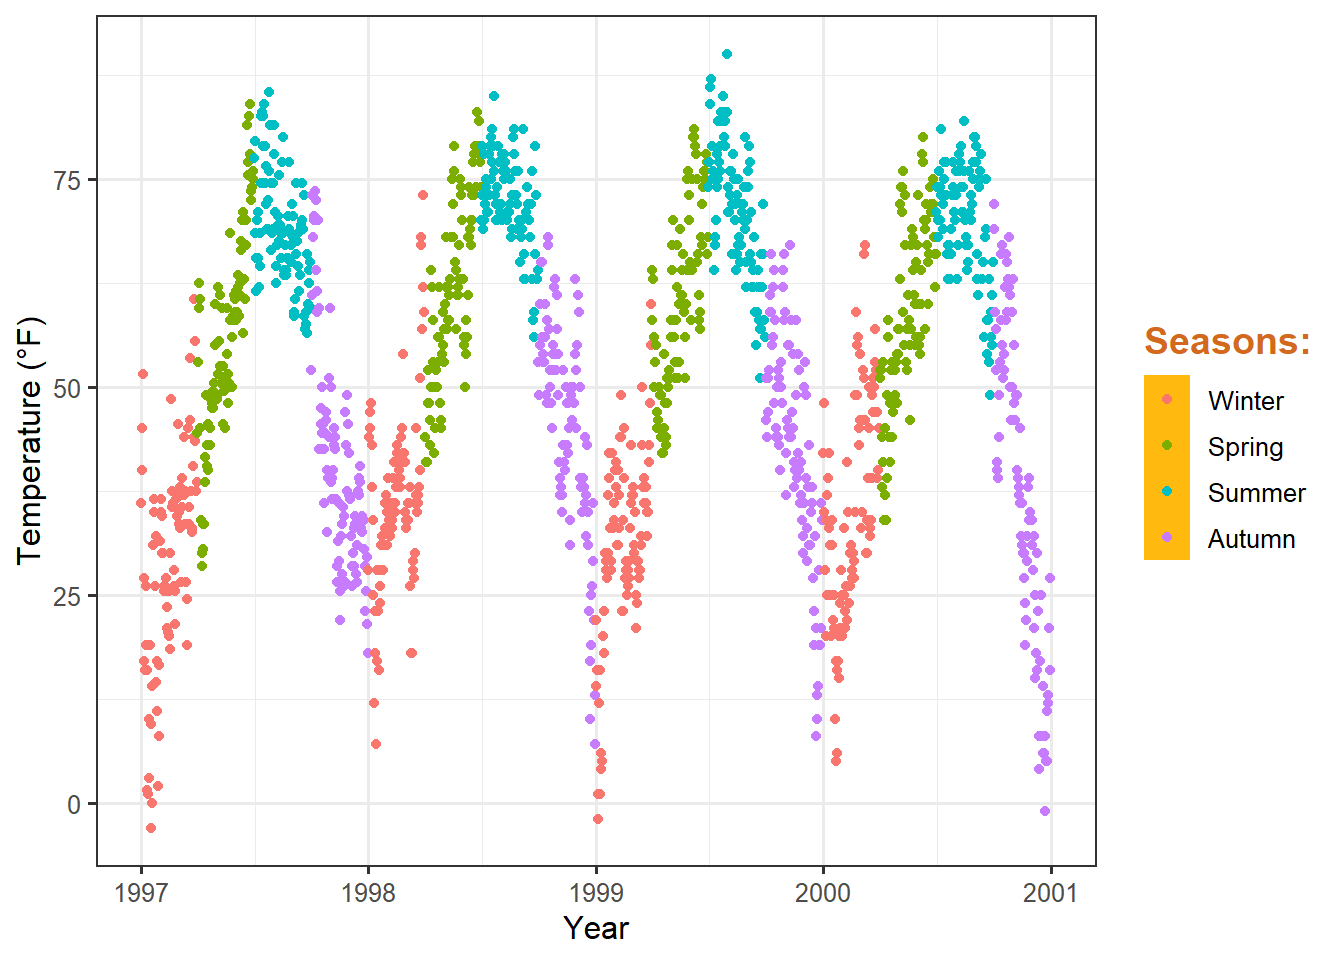
Als je ze helemaal weg wilt hebben, gebruik dan fill = NA of fill = "transparent".
Formaat van de legenda-symbolen wijzigen
Punten in de legenda kunnen een beetje verloren gaan met de standaard grootte, vooral zonder de kaders. Om de standaardgrootte op te heffen gebruikt men weer de guides laag zoals hier:
ggplot(chic, aes(x = date, y = temp, color = season)) +
geom_point() +
labs(x = "Jaar", y = "Temperatuur (°F)") +
theme(legend.key = element_rect(fill = NA),
legend.title = element_text(color = "chocolate",
size = 14, face = 2)) +
scale_color_discrete("Seasons:") +
guides(color = guide_legend(override.aes = list(size = 6)))Warning in grid.Call(C_stringMetric, as.graphicsAnnot(x$label)): font family not
found in Windows font databaseWarning in grid.Call(C_textBounds, as.graphicsAnnot(x$label), x$x, x$y, : font
family not found in Windows font database
Warning in grid.Call(C_textBounds, as.graphicsAnnot(x$label), x$x, x$y, : font
family not found in Windows font database
Warning in grid.Call(C_textBounds, as.graphicsAnnot(x$label), x$x, x$y, : font
family not found in Windows font database
Warning in grid.Call(C_textBounds, as.graphicsAnnot(x$label), x$x, x$y, : font
family not found in Windows font database
Warning in grid.Call(C_textBounds, as.graphicsAnnot(x$label), x$x, x$y, : font
family not found in Windows font database
Warning in grid.Call(C_textBounds, as.graphicsAnnot(x$label), x$x, x$y, : font
family not found in Windows font database
Warning in grid.Call(C_textBounds, as.graphicsAnnot(x$label), x$x, x$y, : font
family not found in Windows font database
Warning in grid.Call(C_textBounds, as.graphicsAnnot(x$label), x$x, x$y, : font
family not found in Windows font database
Warning in grid.Call(C_textBounds, as.graphicsAnnot(x$label), x$x, x$y, : font
family not found in Windows font databaseWarning in grid.Call.graphics(C_text, as.graphicsAnnot(x$label), x$x, x$y, :
font family not found in Windows font databaseWarning in grid.Call(C_textBounds, as.graphicsAnnot(x$label), x$x, x$y, : font
family not found in Windows font database
Warning in grid.Call(C_textBounds, as.graphicsAnnot(x$label), x$x, x$y, : font
family not found in Windows font database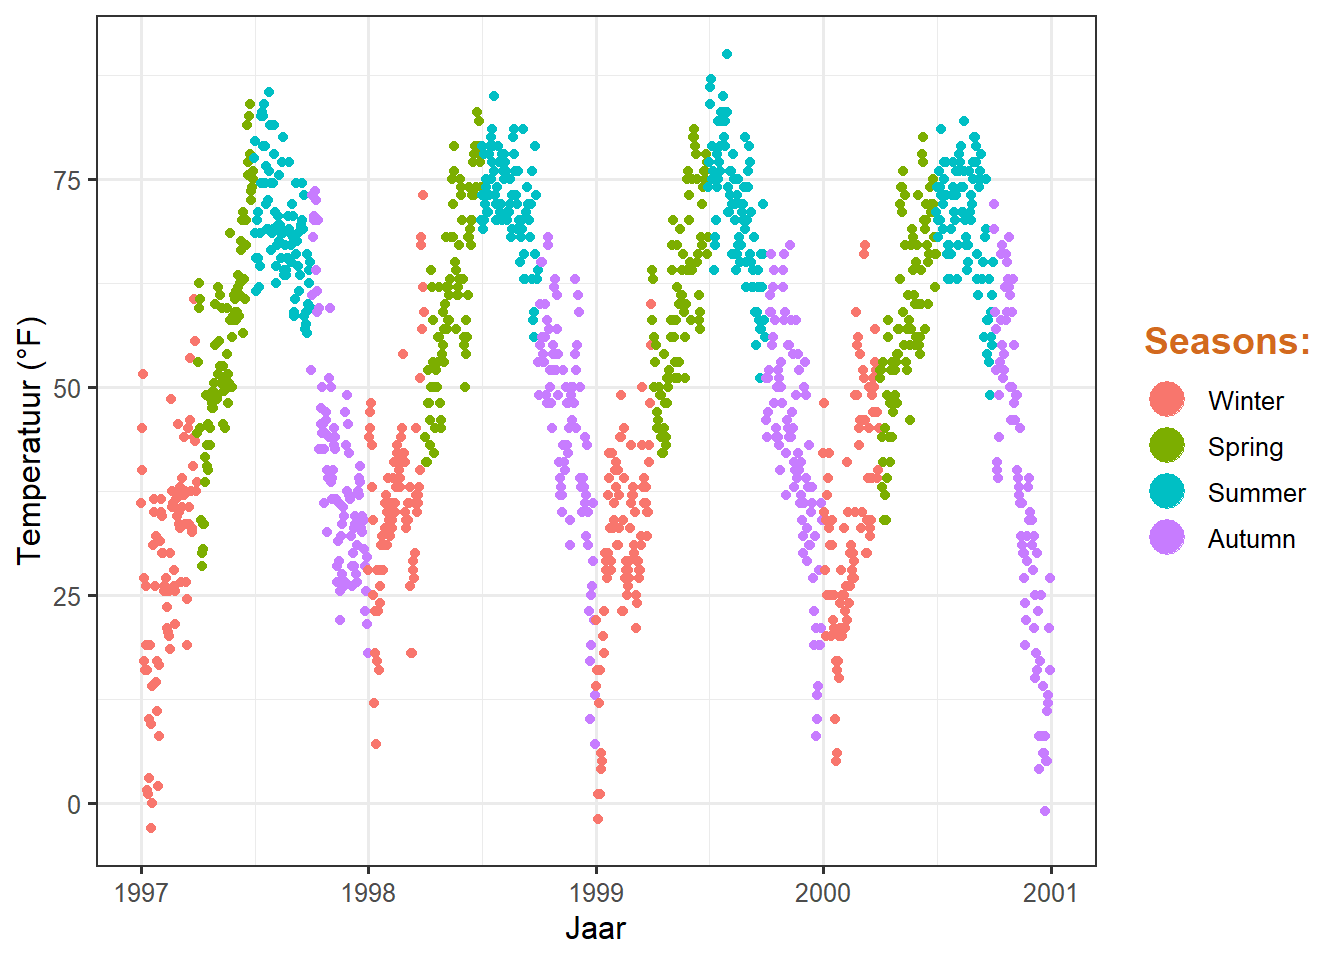
Laat een laag uit de legende
Laten we zeggen dat je twee verschillende geoms hebt gemapt op dezelfde variabele. Bijvoorbeeld, kleur als esthetiek voor zowel een puntlaag als een tapijtlaag van dezelfde gegevens. Standaard komen zowel de punten als de “lijn” zo in de legenda terecht:
ggplot(chic, aes(x = date, y = temp, color = season)) +
geom_point() +
labs(x = "Jaar", y = "Temperatuur (°F)") +
geom_rug()Warning in grid.Call(C_textBounds, as.graphicsAnnot(x$label), x$x, x$y, : font
family not found in Windows font database
Warning in grid.Call(C_textBounds, as.graphicsAnnot(x$label), x$x, x$y, : font
family not found in Windows font database
Warning in grid.Call(C_textBounds, as.graphicsAnnot(x$label), x$x, x$y, : font
family not found in Windows font database
Warning in grid.Call(C_textBounds, as.graphicsAnnot(x$label), x$x, x$y, : font
family not found in Windows font database
Warning in grid.Call(C_textBounds, as.graphicsAnnot(x$label), x$x, x$y, : font
family not found in Windows font database
Warning in grid.Call(C_textBounds, as.graphicsAnnot(x$label), x$x, x$y, : font
family not found in Windows font database
Warning in grid.Call(C_textBounds, as.graphicsAnnot(x$label), x$x, x$y, : font
family not found in Windows font database
Warning in grid.Call(C_textBounds, as.graphicsAnnot(x$label), x$x, x$y, : font
family not found in Windows font database
Warning in grid.Call(C_textBounds, as.graphicsAnnot(x$label), x$x, x$y, : font
family not found in Windows font databaseWarning in grid.Call.graphics(C_text, as.graphicsAnnot(x$label), x$x, x$y, :
font family not found in Windows font databaseWarning in grid.Call(C_textBounds, as.graphicsAnnot(x$label), x$x, x$y, : font
family not found in Windows font database
Warning in grid.Call(C_textBounds, as.graphicsAnnot(x$label), x$x, x$y, : font
family not found in Windows font database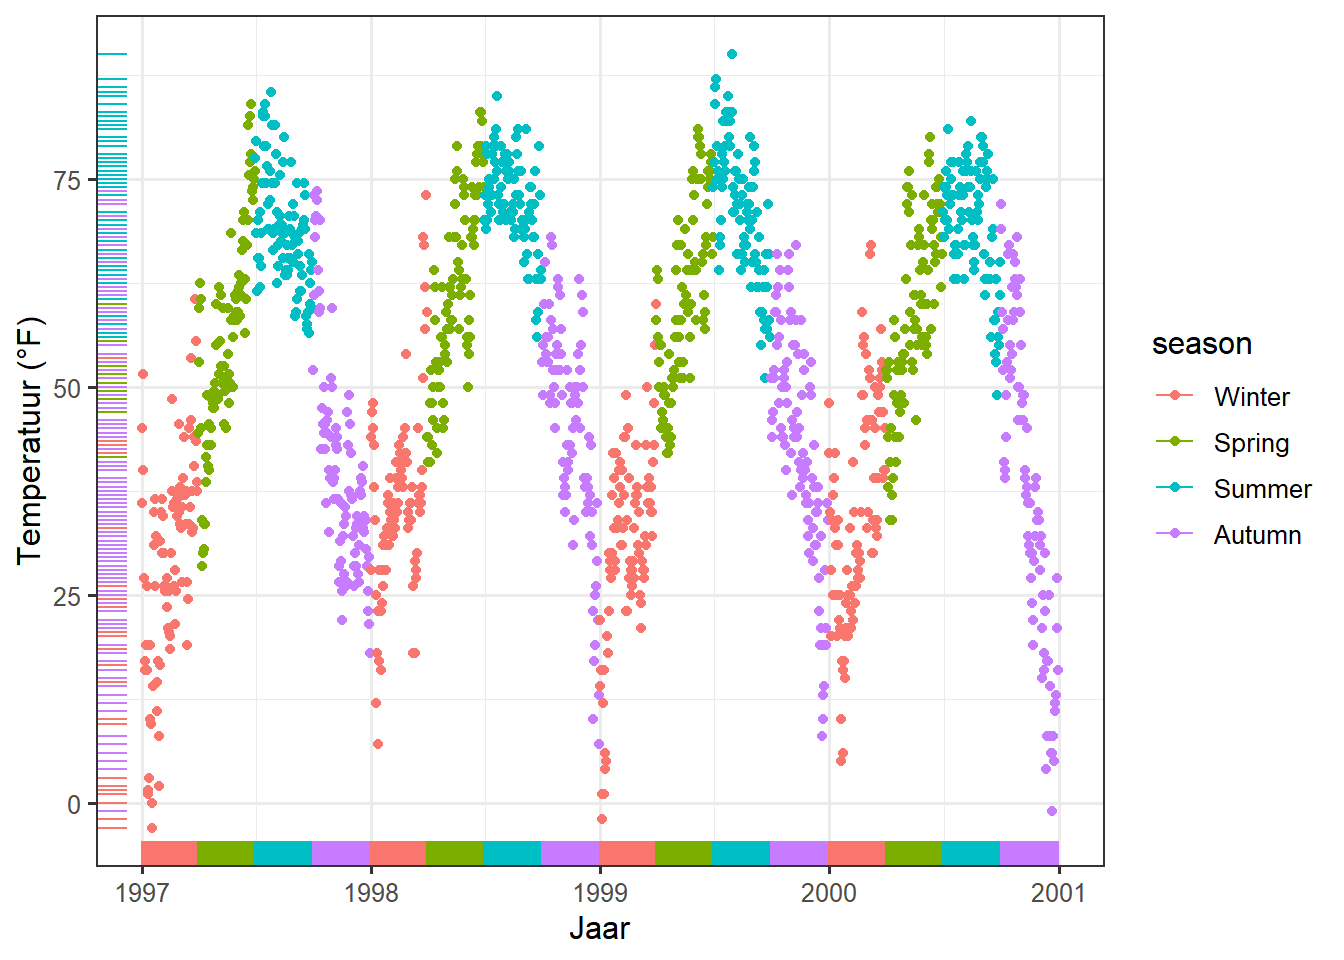
Je kunt show.legend = FALSE gebruiken om een laag in de legenda uit te schakelen:
ggplot(chic, aes(x = date, y = temp, color = season)) +
geom_point() +
labs(x = "Jaar", y = "Temperatuur (°F)") +
geom_rug(show.legend = FALSE)Warning in grid.Call(C_textBounds, as.graphicsAnnot(x$label), x$x, x$y, : font
family not found in Windows font database
Warning in grid.Call(C_textBounds, as.graphicsAnnot(x$label), x$x, x$y, : font
family not found in Windows font database
Warning in grid.Call(C_textBounds, as.graphicsAnnot(x$label), x$x, x$y, : font
family not found in Windows font database
Warning in grid.Call(C_textBounds, as.graphicsAnnot(x$label), x$x, x$y, : font
family not found in Windows font database
Warning in grid.Call(C_textBounds, as.graphicsAnnot(x$label), x$x, x$y, : font
family not found in Windows font database
Warning in grid.Call(C_textBounds, as.graphicsAnnot(x$label), x$x, x$y, : font
family not found in Windows font database
Warning in grid.Call(C_textBounds, as.graphicsAnnot(x$label), x$x, x$y, : font
family not found in Windows font database
Warning in grid.Call(C_textBounds, as.graphicsAnnot(x$label), x$x, x$y, : font
family not found in Windows font database
Warning in grid.Call(C_textBounds, as.graphicsAnnot(x$label), x$x, x$y, : font
family not found in Windows font databaseWarning in grid.Call.graphics(C_text, as.graphicsAnnot(x$label), x$x, x$y, :
font family not found in Windows font databaseWarning in grid.Call(C_textBounds, as.graphicsAnnot(x$label), x$x, x$y, : font
family not found in Windows font database
Warning in grid.Call(C_textBounds, as.graphicsAnnot(x$label), x$x, x$y, : font
family not found in Windows font database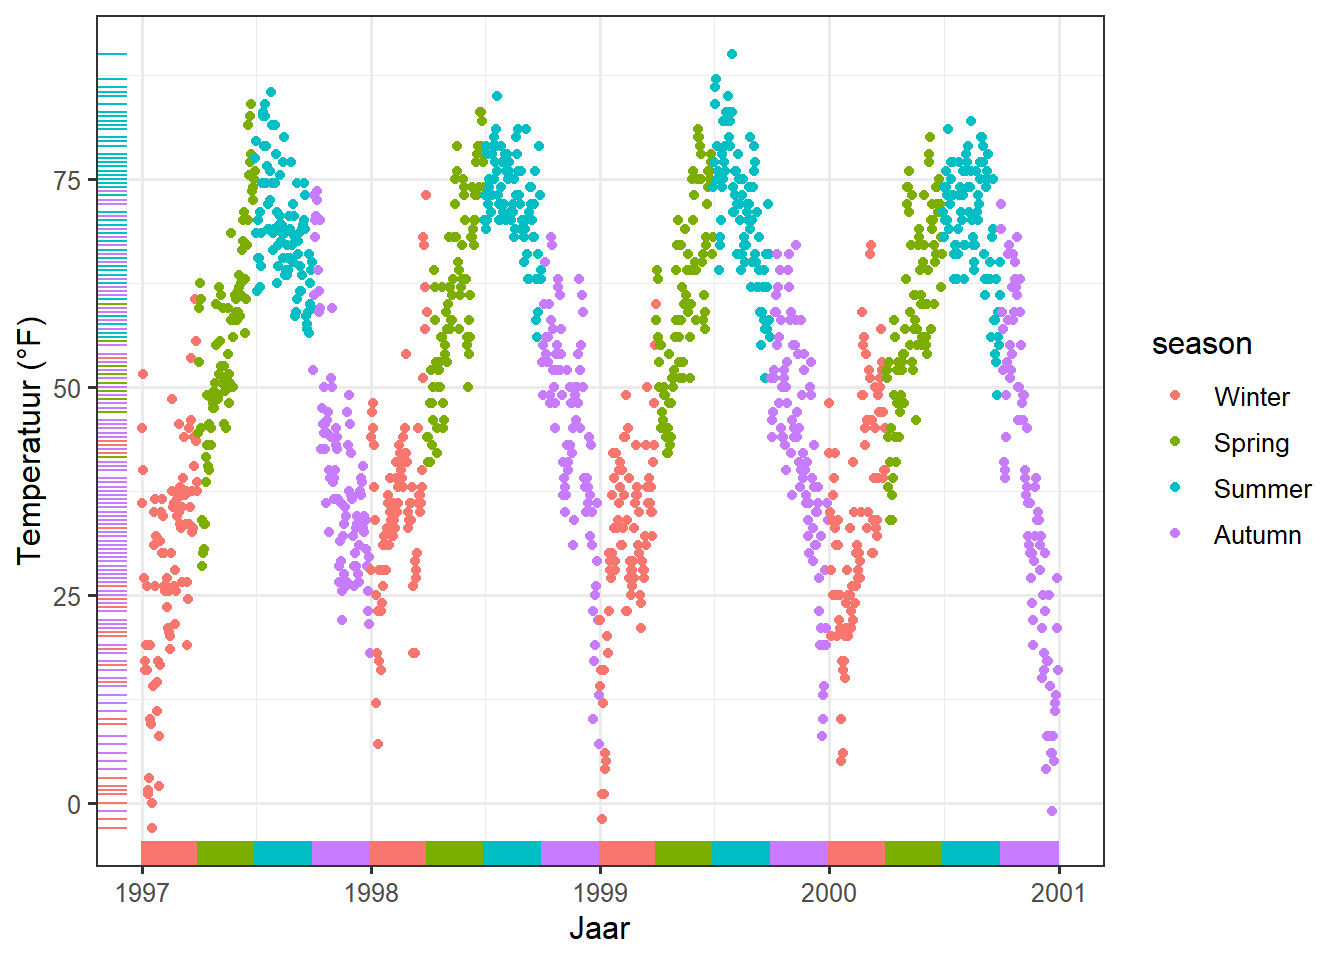
Handmatig toevoegen van legenda items
ggplot2 voegt niet automatisch een legenda toe, tenzij je de esthetiek (kleur, grootte etc.) aan een variabele koppelt. Er zijn echter momenten dat ik een legenda wil hebben, zodat het duidelijk is wat je aan het plotten bent.
Hier is de standaard:
ggplot(chic, aes(x = date, y = o3)) +
geom_line(color = "gray") +
geom_point(color = "darkorange2") +
labs(x = "Jaar", y = "Ozon")Warning in grid.Call(C_textBounds, as.graphicsAnnot(x$label), x$x, x$y, : font
family not found in Windows font database
Warning in grid.Call(C_textBounds, as.graphicsAnnot(x$label), x$x, x$y, : font
family not found in Windows font database
Warning in grid.Call(C_textBounds, as.graphicsAnnot(x$label), x$x, x$y, : font
family not found in Windows font database
Warning in grid.Call(C_textBounds, as.graphicsAnnot(x$label), x$x, x$y, : font
family not found in Windows font database
Warning in grid.Call(C_textBounds, as.graphicsAnnot(x$label), x$x, x$y, : font
family not found in Windows font database
Warning in grid.Call(C_textBounds, as.graphicsAnnot(x$label), x$x, x$y, : font
family not found in Windows font database
Warning in grid.Call(C_textBounds, as.graphicsAnnot(x$label), x$x, x$y, : font
family not found in Windows font databaseWarning in grid.Call.graphics(C_text, as.graphicsAnnot(x$label), x$x, x$y, :
font family not found in Windows font database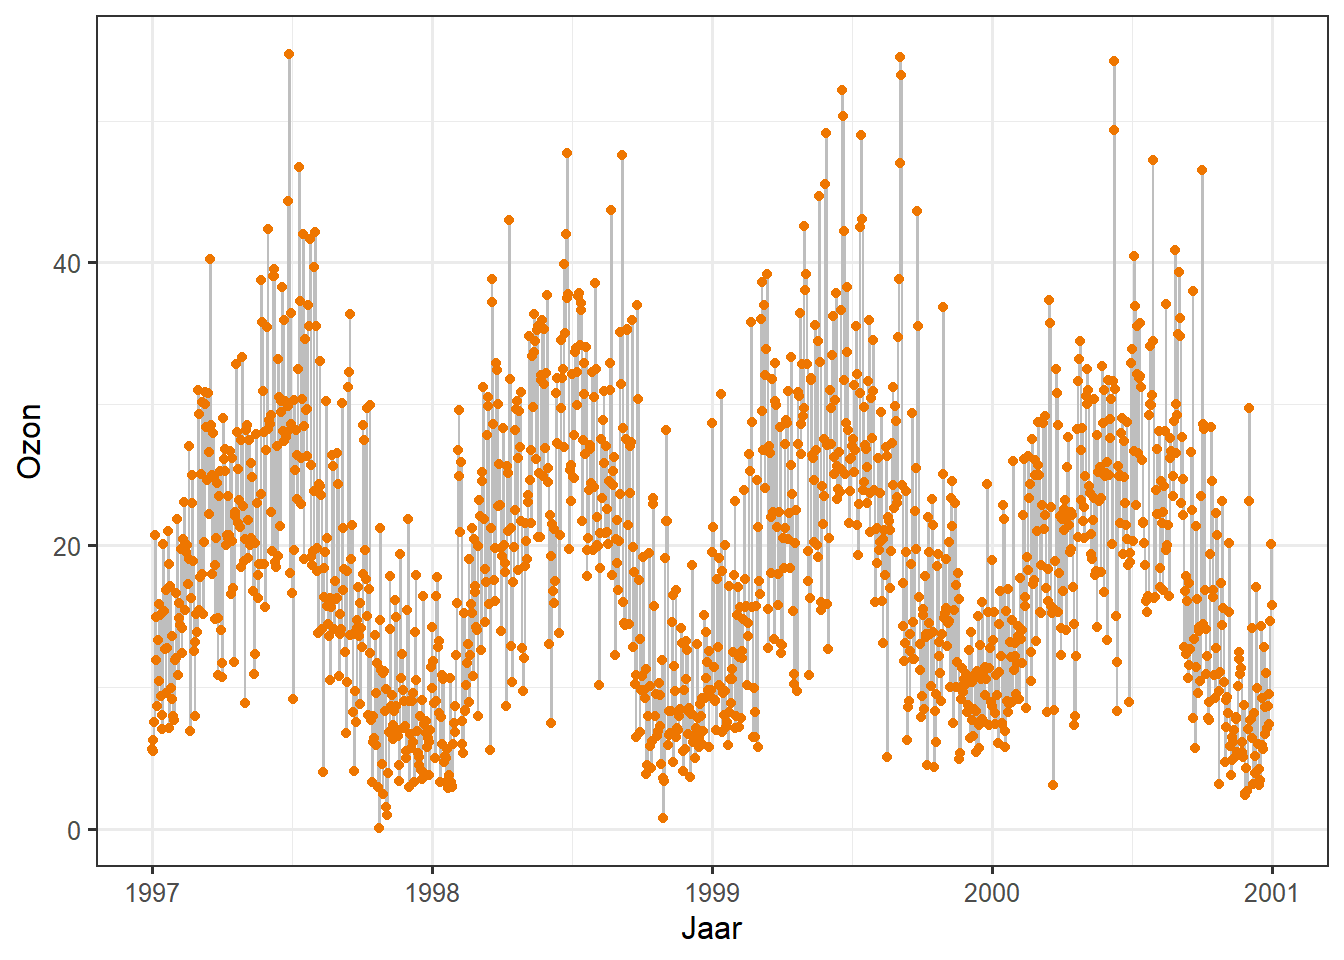
We kunnen een legenda forceren door een leidraad naar een variabele te mappen. We mappen de lijnen en de punten met aes() en we mappen niet naar een variabele in onze dataset, maar naar een enkele string (zodat we voor elk maar één kleur krijgen).
ggplot(chic, aes(x = date, y = o3)) +
geom_line(aes(color = "line")) +
geom_point(aes(color = "points")) +
labs(x = "Jaar", y = "Ozon") +
scale_color_discrete("Type:")Warning in grid.Call(C_textBounds, as.graphicsAnnot(x$label), x$x, x$y, : font
family not found in Windows font database
Warning in grid.Call(C_textBounds, as.graphicsAnnot(x$label), x$x, x$y, : font
family not found in Windows font database
Warning in grid.Call(C_textBounds, as.graphicsAnnot(x$label), x$x, x$y, : font
family not found in Windows font database
Warning in grid.Call(C_textBounds, as.graphicsAnnot(x$label), x$x, x$y, : font
family not found in Windows font database
Warning in grid.Call(C_textBounds, as.graphicsAnnot(x$label), x$x, x$y, : font
family not found in Windows font database
Warning in grid.Call(C_textBounds, as.graphicsAnnot(x$label), x$x, x$y, : font
family not found in Windows font database
Warning in grid.Call(C_textBounds, as.graphicsAnnot(x$label), x$x, x$y, : font
family not found in Windows font database
Warning in grid.Call(C_textBounds, as.graphicsAnnot(x$label), x$x, x$y, : font
family not found in Windows font database
Warning in grid.Call(C_textBounds, as.graphicsAnnot(x$label), x$x, x$y, : font
family not found in Windows font databaseWarning in grid.Call.graphics(C_text, as.graphicsAnnot(x$label), x$x, x$y, :
font family not found in Windows font databaseWarning in grid.Call(C_textBounds, as.graphicsAnnot(x$label), x$x, x$y, : font
family not found in Windows font database
Warning in grid.Call(C_textBounds, as.graphicsAnnot(x$label), x$x, x$y, : font
family not found in Windows font database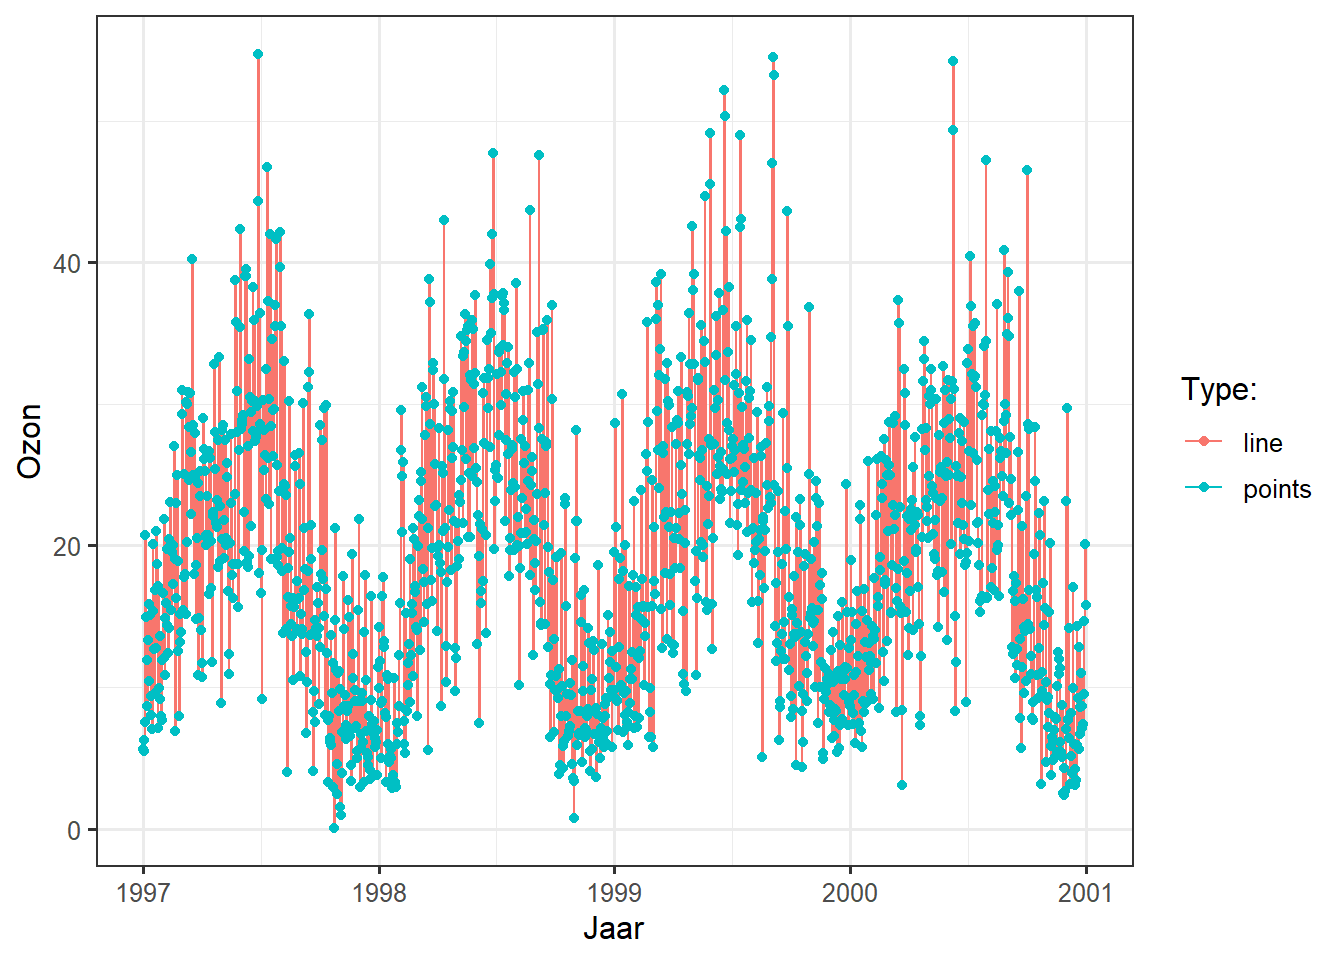
We komen in de buurt, maar dit is niet wat we willen. We willen grijs en rood! Om de kleur te veranderen, gebruiken we scale_color_manual(). Daarnaast veranderen we de legenda met de guide() functie.
Voila! We hebben nu een plot met grijze lijnen en rode punten, en een enkele grijze lijn en een enkel rood punt als legenda symbolen:
ggplot(chic, aes(x = date, y = o3)) +
geom_line(aes(color = "line")) +
geom_point(aes(color = "points")) +
labs(x = "Jaar", y = "Ozon") +
scale_color_manual(name = NULL,
guide = "legend",
values = c("points" = "darkorange2",
"line" = "gray")) +
guides(color = guide_legend(override.aes = list(linetype = c(1, 0),
shape = c(NA, 16))))Warning in grid.Call(C_textBounds, as.graphicsAnnot(x$label), x$x, x$y, : font
family not found in Windows font database
Warning in grid.Call(C_textBounds, as.graphicsAnnot(x$label), x$x, x$y, : font
family not found in Windows font database
Warning in grid.Call(C_textBounds, as.graphicsAnnot(x$label), x$x, x$y, : font
family not found in Windows font database
Warning in grid.Call(C_textBounds, as.graphicsAnnot(x$label), x$x, x$y, : font
family not found in Windows font database
Warning in grid.Call(C_textBounds, as.graphicsAnnot(x$label), x$x, x$y, : font
family not found in Windows font database
Warning in grid.Call(C_textBounds, as.graphicsAnnot(x$label), x$x, x$y, : font
family not found in Windows font database
Warning in grid.Call(C_textBounds, as.graphicsAnnot(x$label), x$x, x$y, : font
family not found in Windows font database
Warning in grid.Call(C_textBounds, as.graphicsAnnot(x$label), x$x, x$y, : font
family not found in Windows font databaseWarning in grid.Call.graphics(C_text, as.graphicsAnnot(x$label), x$x, x$y, :
font family not found in Windows font databaseWarning in grid.Call(C_textBounds, as.graphicsAnnot(x$label), x$x, x$y, : font
family not found in Windows font database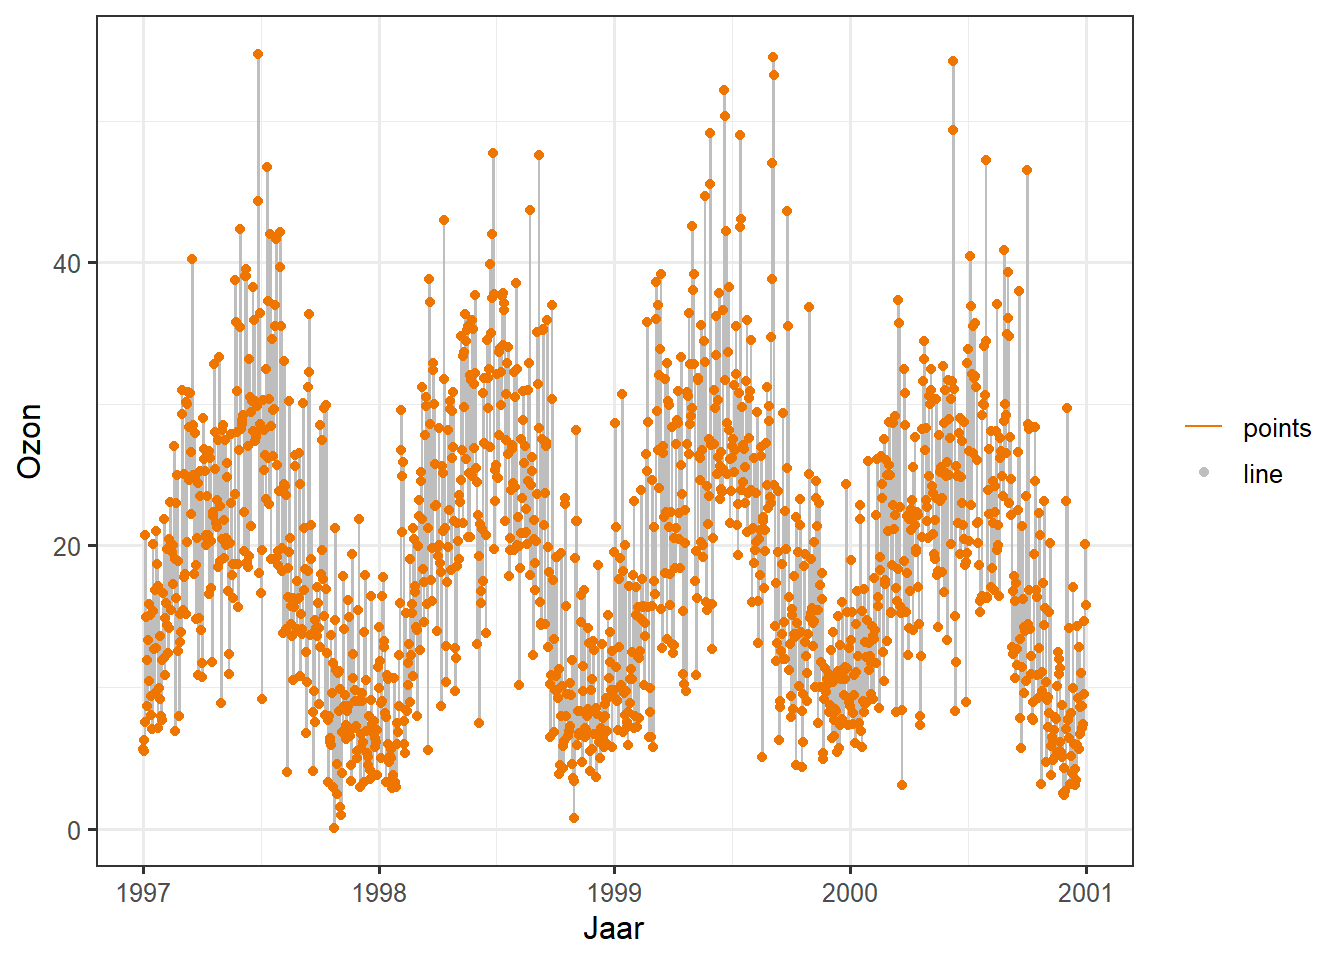
Gebruik andere legenda stijlen
De standaard-legenda voor categorische variabelen zoals season is een guide_legend() zoals je in verschillende eerdere voorbeelden hebt gezien. Als je een continue variabele mapt naar een esthetiek, zal ggplot2 standaard geen guide_legend() gebruiken maar guide_colorbar() (of guide_colourbar()):
ggplot(chic,
aes(x = date, y = temp, color = temp)) +
geom_point() +
labs(x = "Jaar", y = "Temperatuur (°F)", color = "Temperatuur (°F)")Warning in grid.Call(C_textBounds, as.graphicsAnnot(x$label), x$x, x$y, : font
family not found in Windows font database
Warning in grid.Call(C_textBounds, as.graphicsAnnot(x$label), x$x, x$y, : font
family not found in Windows font database
Warning in grid.Call(C_textBounds, as.graphicsAnnot(x$label), x$x, x$y, : font
family not found in Windows font database
Warning in grid.Call(C_textBounds, as.graphicsAnnot(x$label), x$x, x$y, : font
family not found in Windows font database
Warning in grid.Call(C_textBounds, as.graphicsAnnot(x$label), x$x, x$y, : font
family not found in Windows font database
Warning in grid.Call(C_textBounds, as.graphicsAnnot(x$label), x$x, x$y, : font
family not found in Windows font database
Warning in grid.Call(C_textBounds, as.graphicsAnnot(x$label), x$x, x$y, : font
family not found in Windows font database
Warning in grid.Call(C_textBounds, as.graphicsAnnot(x$label), x$x, x$y, : font
family not found in Windows font database
Warning in grid.Call(C_textBounds, as.graphicsAnnot(x$label), x$x, x$y, : font
family not found in Windows font databaseWarning in grid.Call.graphics(C_text, as.graphicsAnnot(x$label), x$x, x$y, :
font family not found in Windows font databaseWarning in grid.Call(C_textBounds, as.graphicsAnnot(x$label), x$x, x$y, : font
family not found in Windows font database
Warning in grid.Call(C_textBounds, as.graphicsAnnot(x$label), x$x, x$y, : font
family not found in Windows font database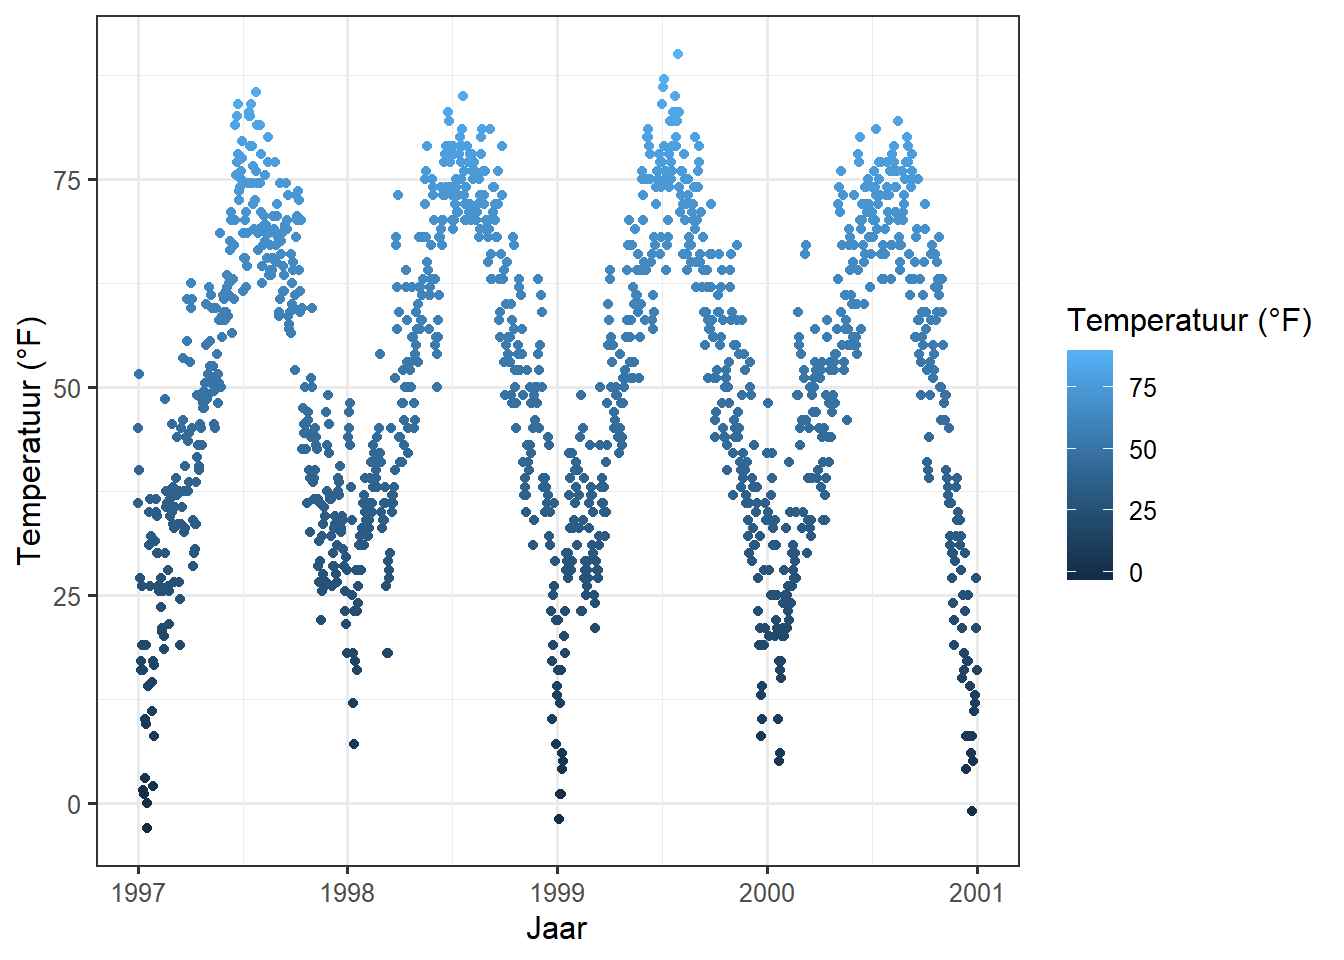
Echter, door guide_legend() te gebruiken kun je de legenda dwingen om discrete kleuren te tonen voor een gegeven aantal breuken zoals in het geval van een categorische variabele:
ggplot(chic,
aes(x = date, y = temp, color = temp)) +
geom_point() +
labs(x = "Jaar", y = "Temperatuur (°F)", color = "Temperatuur (°F)") +
guides(color = guide_legend())Warning in grid.Call(C_textBounds, as.graphicsAnnot(x$label), x$x, x$y, : font
family not found in Windows font database
Warning in grid.Call(C_textBounds, as.graphicsAnnot(x$label), x$x, x$y, : font
family not found in Windows font database
Warning in grid.Call(C_textBounds, as.graphicsAnnot(x$label), x$x, x$y, : font
family not found in Windows font database
Warning in grid.Call(C_textBounds, as.graphicsAnnot(x$label), x$x, x$y, : font
family not found in Windows font database
Warning in grid.Call(C_textBounds, as.graphicsAnnot(x$label), x$x, x$y, : font
family not found in Windows font database
Warning in grid.Call(C_textBounds, as.graphicsAnnot(x$label), x$x, x$y, : font
family not found in Windows font database
Warning in grid.Call(C_textBounds, as.graphicsAnnot(x$label), x$x, x$y, : font
family not found in Windows font database
Warning in grid.Call(C_textBounds, as.graphicsAnnot(x$label), x$x, x$y, : font
family not found in Windows font database
Warning in grid.Call(C_textBounds, as.graphicsAnnot(x$label), x$x, x$y, : font
family not found in Windows font databaseWarning in grid.Call.graphics(C_text, as.graphicsAnnot(x$label), x$x, x$y, :
font family not found in Windows font databaseWarning in grid.Call(C_textBounds, as.graphicsAnnot(x$label), x$x, x$y, : font
family not found in Windows font database
Warning in grid.Call(C_textBounds, as.graphicsAnnot(x$label), x$x, x$y, : font
family not found in Windows font database
Je kunt ook binned scales gebruiken:
ggplot(chic,
aes(x = date, y = temp, color = temp)) +
geom_point() +
labs(x = "Jaar", y = "Temperatuur (°F)", color = "Temperatuur (°F)") +
guides(color = guide_bins())Warning in grid.Call(C_textBounds, as.graphicsAnnot(x$label), x$x, x$y, : font
family not found in Windows font database
Warning in grid.Call(C_textBounds, as.graphicsAnnot(x$label), x$x, x$y, : font
family not found in Windows font database
Warning in grid.Call(C_textBounds, as.graphicsAnnot(x$label), x$x, x$y, : font
family not found in Windows font database
Warning in grid.Call(C_textBounds, as.graphicsAnnot(x$label), x$x, x$y, : font
family not found in Windows font database
Warning in grid.Call(C_textBounds, as.graphicsAnnot(x$label), x$x, x$y, : font
family not found in Windows font database
Warning in grid.Call(C_textBounds, as.graphicsAnnot(x$label), x$x, x$y, : font
family not found in Windows font database
Warning in grid.Call(C_textBounds, as.graphicsAnnot(x$label), x$x, x$y, : font
family not found in Windows font database
Warning in grid.Call(C_textBounds, as.graphicsAnnot(x$label), x$x, x$y, : font
family not found in Windows font database
Warning in grid.Call(C_textBounds, as.graphicsAnnot(x$label), x$x, x$y, : font
family not found in Windows font databaseWarning in grid.Call.graphics(C_text, as.graphicsAnnot(x$label), x$x, x$y, :
font family not found in Windows font databaseWarning in grid.Call(C_textBounds, as.graphicsAnnot(x$label), x$x, x$y, : font
family not found in Windows font database
Warning in grid.Call(C_textBounds, as.graphicsAnnot(x$label), x$x, x$y, : font
family not found in Windows font database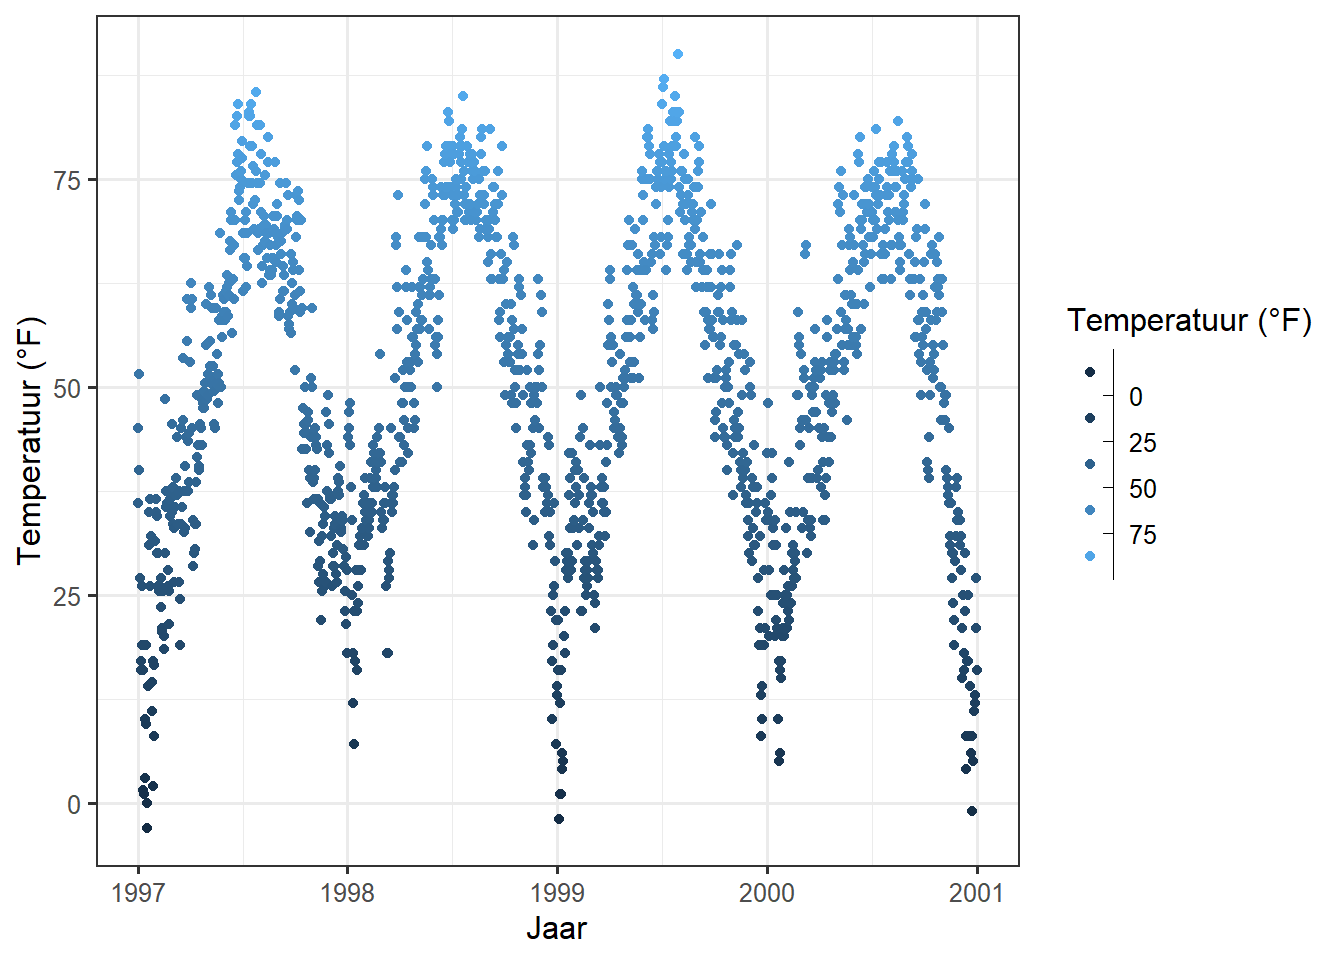
… of schalen als discrete colorbars:
ggplot(chic,
aes(x = date, y = temp, color = temp)) +
geom_point() +
labs(x = "Jaar", y = "Temperatuur (°F)", color = "Temperatuur (°F)") +
guides(color = guide_colorsteps())Warning in grid.Call(C_textBounds, as.graphicsAnnot(x$label), x$x, x$y, : font
family not found in Windows font database
Warning in grid.Call(C_textBounds, as.graphicsAnnot(x$label), x$x, x$y, : font
family not found in Windows font database
Warning in grid.Call(C_textBounds, as.graphicsAnnot(x$label), x$x, x$y, : font
family not found in Windows font database
Warning in grid.Call(C_textBounds, as.graphicsAnnot(x$label), x$x, x$y, : font
family not found in Windows font database
Warning in grid.Call(C_textBounds, as.graphicsAnnot(x$label), x$x, x$y, : font
family not found in Windows font database
Warning in grid.Call(C_textBounds, as.graphicsAnnot(x$label), x$x, x$y, : font
family not found in Windows font database
Warning in grid.Call(C_textBounds, as.graphicsAnnot(x$label), x$x, x$y, : font
family not found in Windows font database
Warning in grid.Call(C_textBounds, as.graphicsAnnot(x$label), x$x, x$y, : font
family not found in Windows font database
Warning in grid.Call(C_textBounds, as.graphicsAnnot(x$label), x$x, x$y, : font
family not found in Windows font databaseWarning in grid.Call.graphics(C_text, as.graphicsAnnot(x$label), x$x, x$y, :
font family not found in Windows font databaseWarning in grid.Call(C_textBounds, as.graphicsAnnot(x$label), x$x, x$y, : font
family not found in Windows font database
Warning in grid.Call(C_textBounds, as.graphicsAnnot(x$label), x$x, x$y, : font
family not found in Windows font database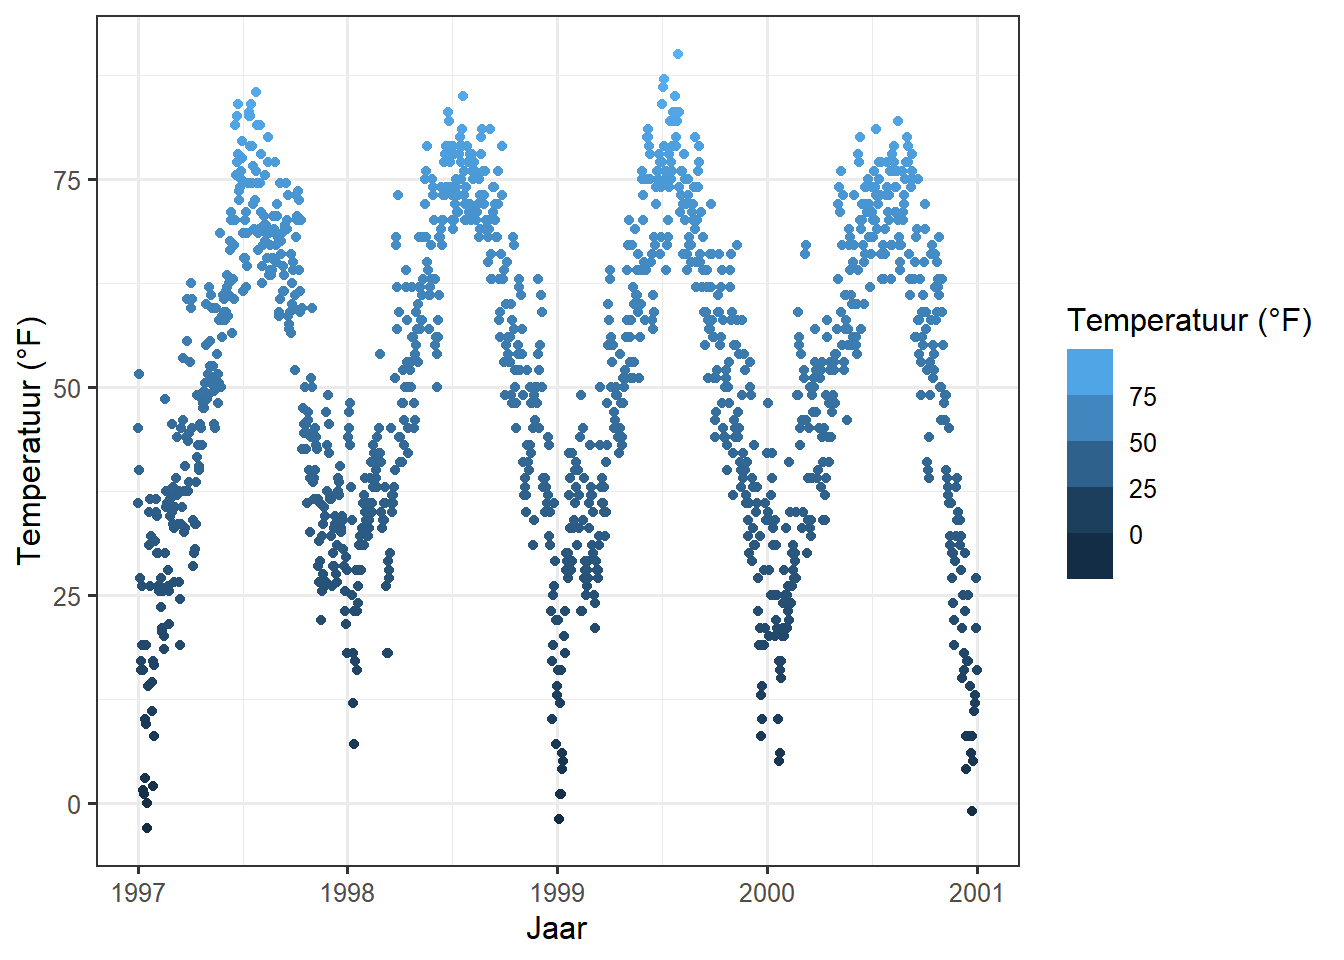
Werken met Achtergronden & Rasterlijnen
Er zijn manieren om het hele uiterlijk van uw plot te veranderen met één functie (zie “Working with themes” sectie hieronder) maar als je alleen de kleuren van sommige elementen wilt veranderen, kunt je dat ook doen.
De achtergrondkleur van het paneel veranderen
Om de achtergrondkleur (vulling) van het paneelgebied (d.w.z. het gebied waar de gegevens worden uitgezet) te veranderen, moet het thema-element panel.background worden aangepast:
ggplot(chic, aes(x = date, y = temp)) +
geom_point(color = "#1D8565", size = 2) +
labs(x = "Jaar", y = "Temperatuur (°F)") +
theme(panel.background = element_rect(
fill = "#64D2AA", color = "#64D2AA", size = 2)
)Warning in grid.Call(C_textBounds, as.graphicsAnnot(x$label), x$x, x$y, : font
family not found in Windows font database
Warning in grid.Call(C_textBounds, as.graphicsAnnot(x$label), x$x, x$y, : font
family not found in Windows font database
Warning in grid.Call(C_textBounds, as.graphicsAnnot(x$label), x$x, x$y, : font
family not found in Windows font database
Warning in grid.Call(C_textBounds, as.graphicsAnnot(x$label), x$x, x$y, : font
family not found in Windows font database
Warning in grid.Call(C_textBounds, as.graphicsAnnot(x$label), x$x, x$y, : font
family not found in Windows font database
Warning in grid.Call(C_textBounds, as.graphicsAnnot(x$label), x$x, x$y, : font
family not found in Windows font database
Warning in grid.Call(C_textBounds, as.graphicsAnnot(x$label), x$x, x$y, : font
family not found in Windows font databaseWarning in grid.Call.graphics(C_text, as.graphicsAnnot(x$label), x$x, x$y, :
font family not found in Windows font database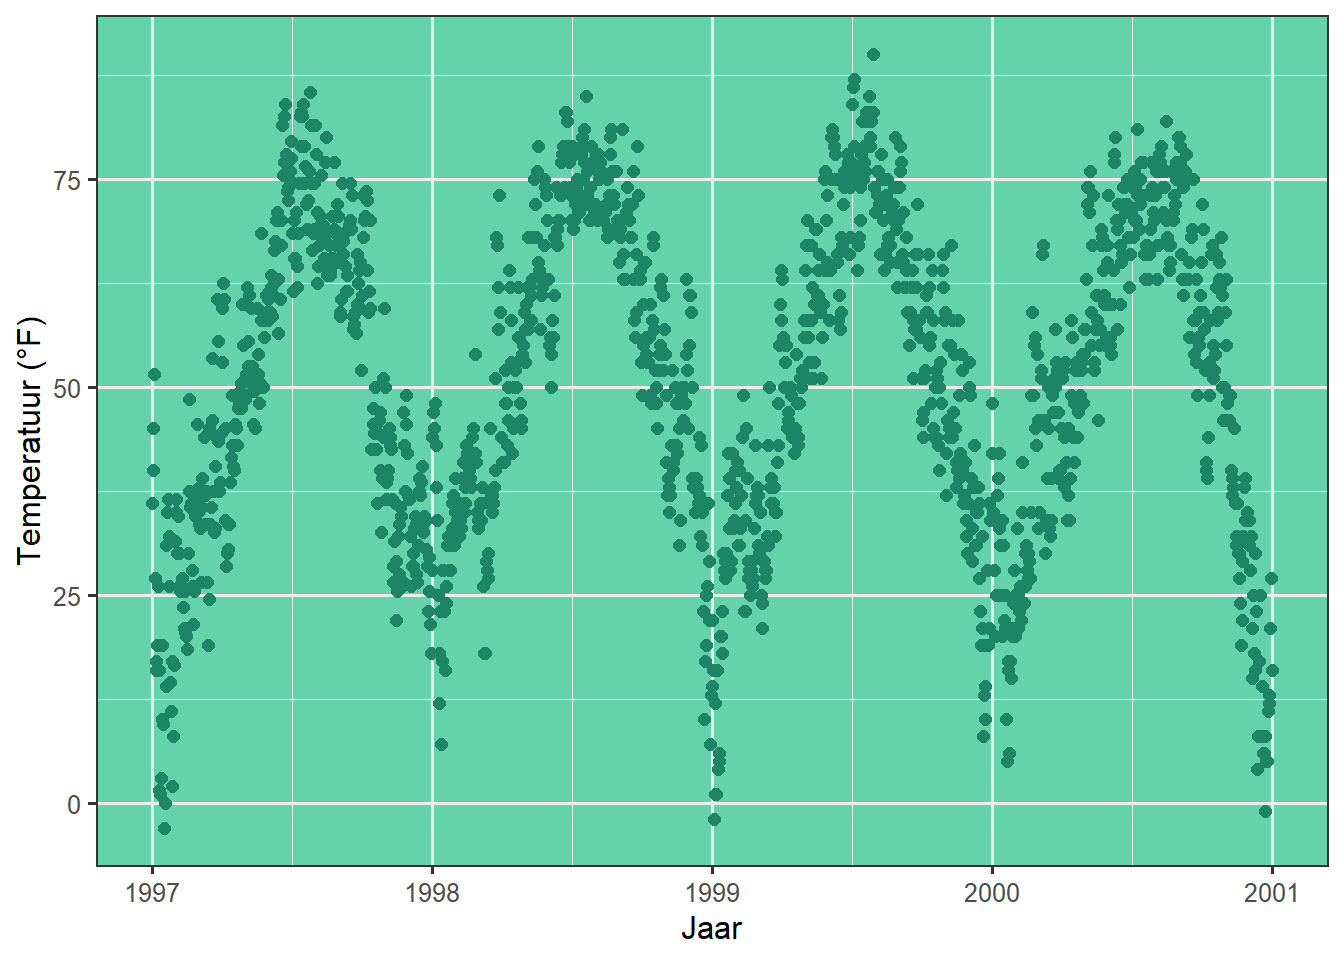
Merk op dat de echte kleur - de omtrek van de achtergrond van het paneel - niet verandert, ook al hebben we die gespecificeerd. Dit komt omdat er een laag bovenop de panel.background zit, namelijk panel.border. Zorg er wel voor dat je hier een transparante vulling gebruikt, anders worden je gegevens verborgen achter deze laag. In het volgende voorbeeld illustreer ik dat door een semitransparante hex kleur te gebruiken voor het fill argument in element_rect:
ggplot(chic, aes(x = date, y = temp)) +
geom_point(color = "#1D8565", size = 2) +
labs(x = "Jaar", y = "Temperatuur (°F)") +
theme(panel.border = element_rect(
fill = "#64D2AA99", color = "#64D2AA", size = 2))Warning in grid.Call(C_textBounds, as.graphicsAnnot(x$label), x$x, x$y, : font
family not found in Windows font database
Warning in grid.Call(C_textBounds, as.graphicsAnnot(x$label), x$x, x$y, : font
family not found in Windows font database
Warning in grid.Call(C_textBounds, as.graphicsAnnot(x$label), x$x, x$y, : font
family not found in Windows font database
Warning in grid.Call(C_textBounds, as.graphicsAnnot(x$label), x$x, x$y, : font
family not found in Windows font database
Warning in grid.Call(C_textBounds, as.graphicsAnnot(x$label), x$x, x$y, : font
family not found in Windows font database
Warning in grid.Call(C_textBounds, as.graphicsAnnot(x$label), x$x, x$y, : font
family not found in Windows font database
Warning in grid.Call(C_textBounds, as.graphicsAnnot(x$label), x$x, x$y, : font
family not found in Windows font databaseWarning in grid.Call.graphics(C_text, as.graphicsAnnot(x$label), x$x, x$y, :
font family not found in Windows font database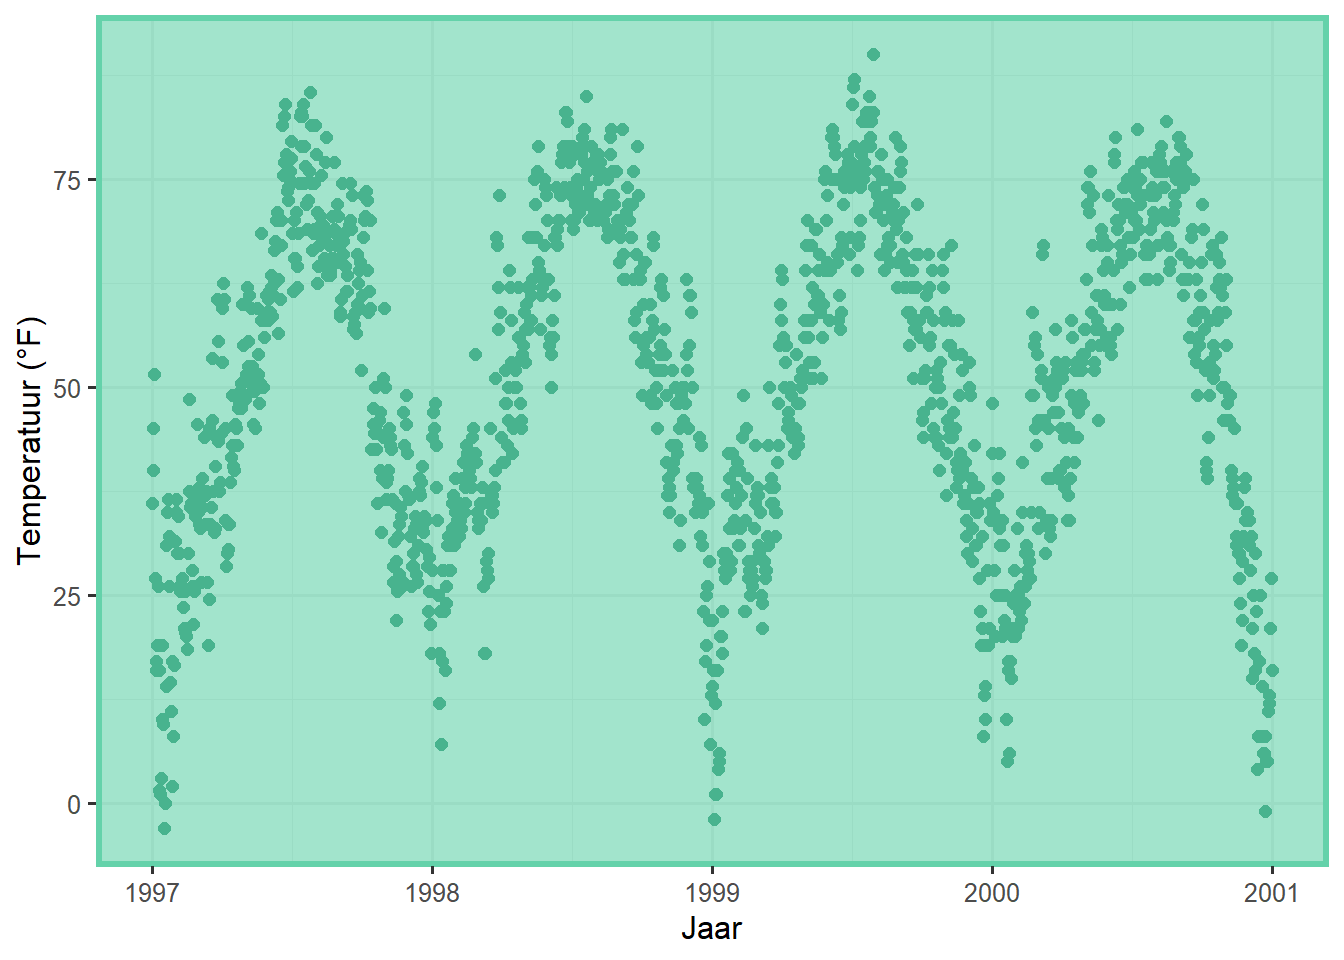
Rasterlijnen veranderen
Er zijn twee soorten rasterlijnen: grote rasterlijnen die de vinkjes aangeven en kleine rasterlijnen tussen de grote rasterlijnen. Je kunt deze allemaal veranderen door de standaardwaarden voor panel.grid te overschrijven of voor elke set rasterlijnen afzonderlijk, panel.grid.major en panel.grid.minor.
ggplot(chic, aes(x = date, y = temp)) +
geom_point(color = "firebrick") +
labs(x = "Jaar", y = "Temperatuur (°F)") +
theme(panel.grid.major = element_line(color = "gray10", size = .5),
panel.grid.minor = element_line(color = "gray70", size = .25))Warning in grid.Call(C_textBounds, as.graphicsAnnot(x$label), x$x, x$y, : font
family not found in Windows font database
Warning in grid.Call(C_textBounds, as.graphicsAnnot(x$label), x$x, x$y, : font
family not found in Windows font database
Warning in grid.Call(C_textBounds, as.graphicsAnnot(x$label), x$x, x$y, : font
family not found in Windows font database
Warning in grid.Call(C_textBounds, as.graphicsAnnot(x$label), x$x, x$y, : font
family not found in Windows font database
Warning in grid.Call(C_textBounds, as.graphicsAnnot(x$label), x$x, x$y, : font
family not found in Windows font database
Warning in grid.Call(C_textBounds, as.graphicsAnnot(x$label), x$x, x$y, : font
family not found in Windows font database
Warning in grid.Call(C_textBounds, as.graphicsAnnot(x$label), x$x, x$y, : font
family not found in Windows font databaseWarning in grid.Call.graphics(C_text, as.graphicsAnnot(x$label), x$x, x$y, :
font family not found in Windows font database
Je kunt zelfs instellingen opgeven voor de vier verschillende niveaus:
ggplot(chic, aes(x = date, y = temp)) +
geom_point(color = "firebrick") +
labs(x = "Jaar", y = "Temperatuur (°F)") +
theme(panel.grid.major = element_line(size = .5, linetype = "dashed"),
panel.grid.minor = element_line(size = .25, linetype = "dotted"),
panel.grid.major.x = element_line(color = "red1"),
panel.grid.major.y = element_line(color = "blue1"),
panel.grid.minor.x = element_line(color = "red4"),
panel.grid.minor.y = element_line(color = "blue4"))Warning in grid.Call(C_textBounds, as.graphicsAnnot(x$label), x$x, x$y, : font
family not found in Windows font database
Warning in grid.Call(C_textBounds, as.graphicsAnnot(x$label), x$x, x$y, : font
family not found in Windows font database
Warning in grid.Call(C_textBounds, as.graphicsAnnot(x$label), x$x, x$y, : font
family not found in Windows font database
Warning in grid.Call(C_textBounds, as.graphicsAnnot(x$label), x$x, x$y, : font
family not found in Windows font database
Warning in grid.Call(C_textBounds, as.graphicsAnnot(x$label), x$x, x$y, : font
family not found in Windows font database
Warning in grid.Call(C_textBounds, as.graphicsAnnot(x$label), x$x, x$y, : font
family not found in Windows font database
Warning in grid.Call(C_textBounds, as.graphicsAnnot(x$label), x$x, x$y, : font
family not found in Windows font databaseWarning in grid.Call.graphics(C_text, as.graphicsAnnot(x$label), x$x, x$y, :
font family not found in Windows font database
En natuurlijk kun je sommige of alle rasterlijnen verwijderen als je dat wilt:
ggplot(chic, aes(x = date, y = temp)) +
geom_point(color = "firebrick") +
labs(x = "Jaar", y = "Temperatuur (°F)") +
theme(panel.grid.minor = element_blank())Warning in grid.Call(C_textBounds, as.graphicsAnnot(x$label), x$x, x$y, : font
family not found in Windows font database
Warning in grid.Call(C_textBounds, as.graphicsAnnot(x$label), x$x, x$y, : font
family not found in Windows font database
Warning in grid.Call(C_textBounds, as.graphicsAnnot(x$label), x$x, x$y, : font
family not found in Windows font database
Warning in grid.Call(C_textBounds, as.graphicsAnnot(x$label), x$x, x$y, : font
family not found in Windows font database
Warning in grid.Call(C_textBounds, as.graphicsAnnot(x$label), x$x, x$y, : font
family not found in Windows font database
Warning in grid.Call(C_textBounds, as.graphicsAnnot(x$label), x$x, x$y, : font
family not found in Windows font database
Warning in grid.Call(C_textBounds, as.graphicsAnnot(x$label), x$x, x$y, : font
family not found in Windows font databaseWarning in grid.Call.graphics(C_text, as.graphicsAnnot(x$label), x$x, x$y, :
font family not found in Windows font database
ggplot(chic, aes(x = date, y = temp)) +
geom_point(color = "firebrick") +
labs(x = "Jaar", y = "Temperatuur (°F)") +
theme(panel.grid = element_blank())Warning in grid.Call(C_textBounds, as.graphicsAnnot(x$label), x$x, x$y, : font
family not found in Windows font database
Warning in grid.Call(C_textBounds, as.graphicsAnnot(x$label), x$x, x$y, : font
family not found in Windows font database
Warning in grid.Call(C_textBounds, as.graphicsAnnot(x$label), x$x, x$y, : font
family not found in Windows font database
Warning in grid.Call(C_textBounds, as.graphicsAnnot(x$label), x$x, x$y, : font
family not found in Windows font database
Warning in grid.Call(C_textBounds, as.graphicsAnnot(x$label), x$x, x$y, : font
family not found in Windows font database
Warning in grid.Call(C_textBounds, as.graphicsAnnot(x$label), x$x, x$y, : font
family not found in Windows font database
Warning in grid.Call(C_textBounds, as.graphicsAnnot(x$label), x$x, x$y, : font
family not found in Windows font databaseWarning in grid.Call.graphics(C_text, as.graphicsAnnot(x$label), x$x, x$y, :
font family not found in Windows font database
Afstand tussen rasterlijnen wijzigen
Bovendien kun je ook de onderbrekingen tussen de grote en kleine rasterlijnen bepalen:
ggplot(chic, aes(x = date, y = temp)) +
geom_point(color = "firebrick") +
labs(x = "Jaar", y = "Temperatuur (°F)") +
scale_y_continuous(breaks = seq(0, 100, 10),
minor_breaks = seq(0, 100, 2.5))Warning in grid.Call(C_textBounds, as.graphicsAnnot(x$label), x$x, x$y, : font
family not found in Windows font database
Warning in grid.Call(C_textBounds, as.graphicsAnnot(x$label), x$x, x$y, : font
family not found in Windows font database
Warning in grid.Call(C_textBounds, as.graphicsAnnot(x$label), x$x, x$y, : font
family not found in Windows font database
Warning in grid.Call(C_textBounds, as.graphicsAnnot(x$label), x$x, x$y, : font
family not found in Windows font database
Warning in grid.Call(C_textBounds, as.graphicsAnnot(x$label), x$x, x$y, : font
family not found in Windows font database
Warning in grid.Call(C_textBounds, as.graphicsAnnot(x$label), x$x, x$y, : font
family not found in Windows font database
Warning in grid.Call(C_textBounds, as.graphicsAnnot(x$label), x$x, x$y, : font
family not found in Windows font databaseWarning in grid.Call.graphics(C_text, as.graphicsAnnot(x$label), x$x, x$y, :
font family not found in Windows font database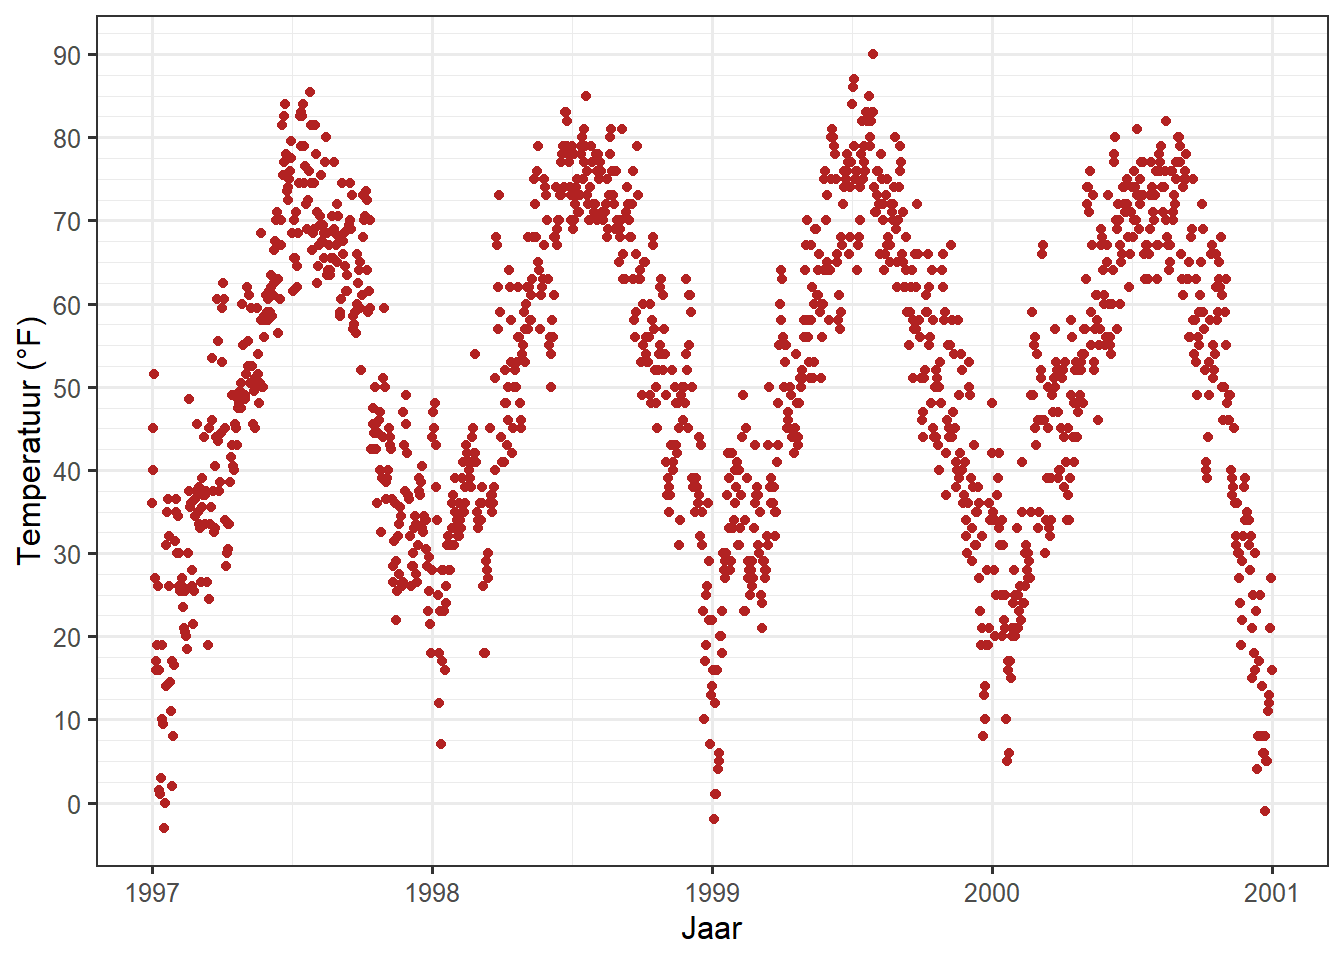
Verander de achtergrondkleur van de plot
Op dezelfde manier, om de achtergrondkleur (vulling) van het plot gebied te veranderen, moet men het theme element plot.background aanpassen:
ggplot(chic, aes(x = date, y = temp)) +
geom_point(color = "firebrick") +
labs(x = "Jaar", y = "Temperatuur (°F)") +
theme(plot.background = element_rect(fill = "gray60",
color = "gray30", size = 2))Warning in grid.Call(C_textBounds, as.graphicsAnnot(x$label), x$x, x$y, : font
family not found in Windows font database
Warning in grid.Call(C_textBounds, as.graphicsAnnot(x$label), x$x, x$y, : font
family not found in Windows font database
Warning in grid.Call(C_textBounds, as.graphicsAnnot(x$label), x$x, x$y, : font
family not found in Windows font database
Warning in grid.Call(C_textBounds, as.graphicsAnnot(x$label), x$x, x$y, : font
family not found in Windows font database
Warning in grid.Call(C_textBounds, as.graphicsAnnot(x$label), x$x, x$y, : font
family not found in Windows font database
Warning in grid.Call(C_textBounds, as.graphicsAnnot(x$label), x$x, x$y, : font
family not found in Windows font database
Warning in grid.Call(C_textBounds, as.graphicsAnnot(x$label), x$x, x$y, : font
family not found in Windows font databaseWarning in grid.Call.graphics(C_text, as.graphicsAnnot(x$label), x$x, x$y, :
font family not found in Windows font database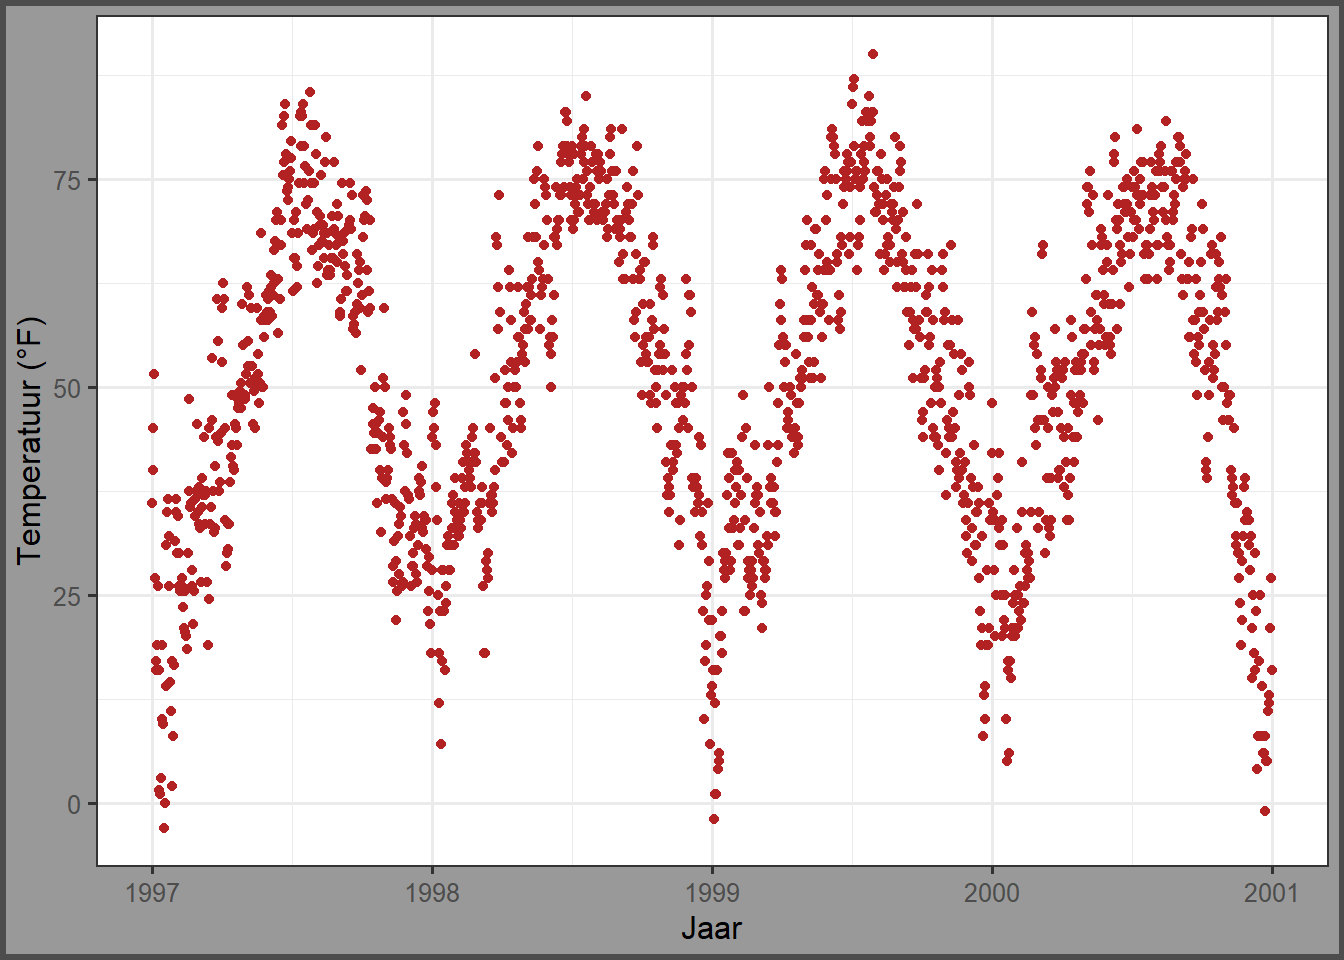
Je kunt een unieke achtergrondkleur krijgen door ofwel dezelfde kleuren in panel.background en plot.background te zetten, of door de achtergrondvulling van het paneel op "transparent" of NA te zetten:
ggplot(chic, aes(x = date, y = temp)) +
geom_point(color = "firebrick") +
labs(x = "Jaar", y = "Temperatuur (°F)") +
theme(panel.background = element_rect(fill = NA),
plot.background = element_rect(fill = "gray60",
color = "gray30", size = 2))Warning in grid.Call(C_textBounds, as.graphicsAnnot(x$label), x$x, x$y, : font
family not found in Windows font database
Warning in grid.Call(C_textBounds, as.graphicsAnnot(x$label), x$x, x$y, : font
family not found in Windows font database
Warning in grid.Call(C_textBounds, as.graphicsAnnot(x$label), x$x, x$y, : font
family not found in Windows font database
Warning in grid.Call(C_textBounds, as.graphicsAnnot(x$label), x$x, x$y, : font
family not found in Windows font database
Warning in grid.Call(C_textBounds, as.graphicsAnnot(x$label), x$x, x$y, : font
family not found in Windows font database
Warning in grid.Call(C_textBounds, as.graphicsAnnot(x$label), x$x, x$y, : font
family not found in Windows font database
Warning in grid.Call(C_textBounds, as.graphicsAnnot(x$label), x$x, x$y, : font
family not found in Windows font databaseWarning in grid.Call.graphics(C_text, as.graphicsAnnot(x$label), x$x, x$y, :
font family not found in Windows font database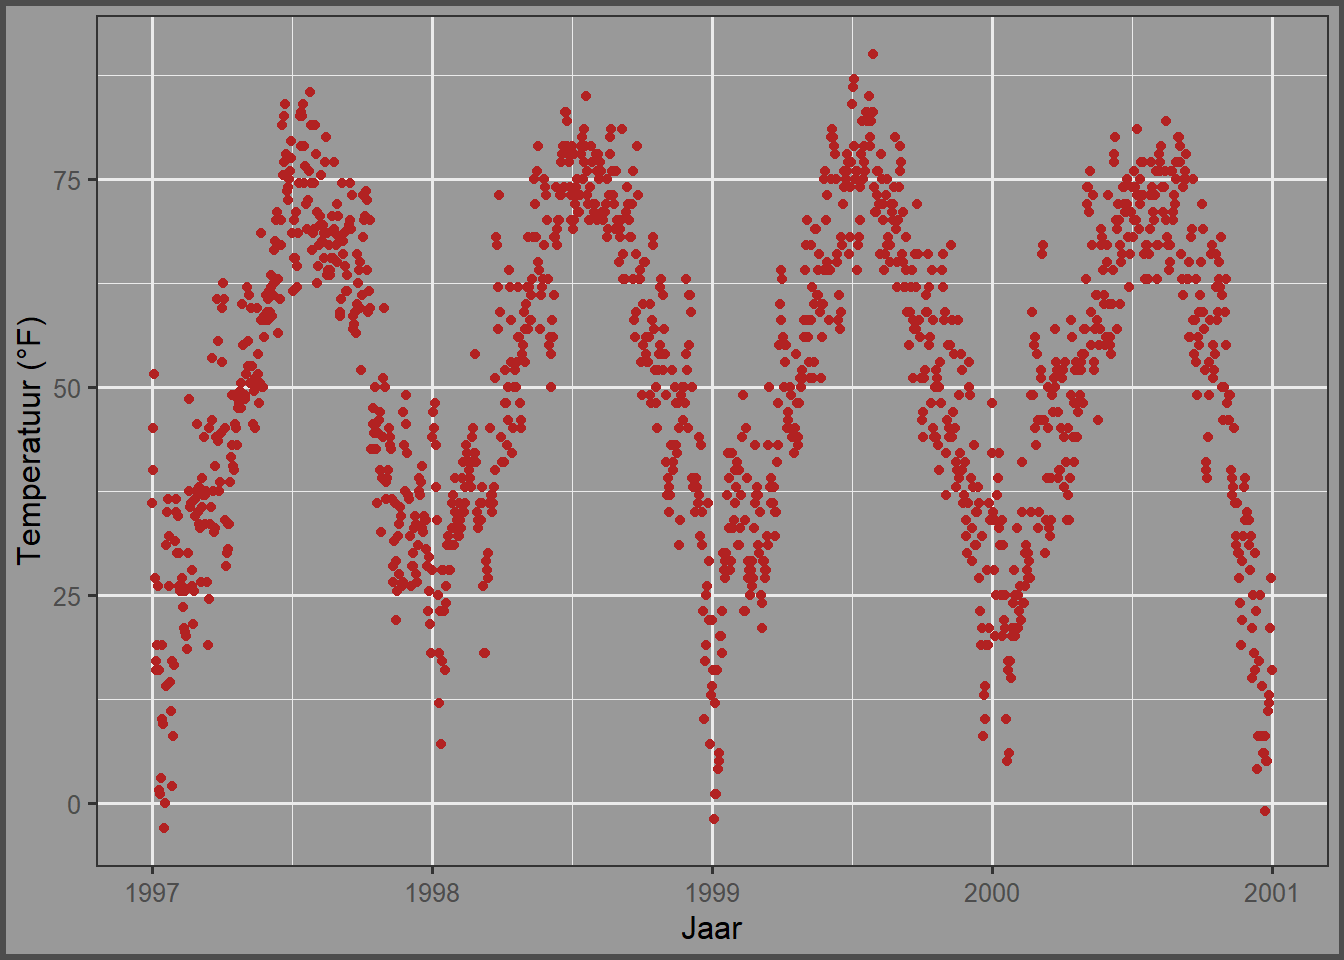
Werken met marges
Soms is het handig om een beetje ruimte toe te voegen aan de plotmarge. Net als bij de vorige voorbeelden kunnen we een argument gebruiken voor de theme() functie. In dit geval is het argument plot.margin. Zoals in het vorige voorbeeld hebben we de standaard marge al geïllustreerd door de achtergrondkleur te veranderen met plot.background.
Laten we nu extra ruimte toevoegen aan zowel links als rechts. Het argument, plot.margin, kan overweg met verschillende eenheden (cm, inches, etc.) maar vereist het gebruik van de functie unit uit het pakket grid om de eenheden te specificeren. Je kunt ofwel dezelfde waarde opgeven voor alle zijden (het makkelijkst via rep(x, 4)) of bepaalde afstanden voor elk. Hier gebruik ik een marge van 1 cm aan de boven- en onderkant, 3 cm marge aan de rechterkant, en 8 cm marge aan de linkerkant.
ggplot(chic, aes(x = date, y = temp)) +
geom_point(color = "firebrick") +
labs(x = "Jaar", y = "Temperatuur (°F)") +
theme(plot.background = element_rect(fill = "gray60"),
plot.margin = margin(t = 1, r = 3, b = 1, l = 8, unit = "cm"))Warning in grid.Call(C_textBounds, as.graphicsAnnot(x$label), x$x, x$y, : font
family not found in Windows font database
Warning in grid.Call(C_textBounds, as.graphicsAnnot(x$label), x$x, x$y, : font
family not found in Windows font database
Warning in grid.Call(C_textBounds, as.graphicsAnnot(x$label), x$x, x$y, : font
family not found in Windows font database
Warning in grid.Call(C_textBounds, as.graphicsAnnot(x$label), x$x, x$y, : font
family not found in Windows font database
Warning in grid.Call(C_textBounds, as.graphicsAnnot(x$label), x$x, x$y, : font
family not found in Windows font database
Warning in grid.Call(C_textBounds, as.graphicsAnnot(x$label), x$x, x$y, : font
family not found in Windows font database
Warning in grid.Call(C_textBounds, as.graphicsAnnot(x$label), x$x, x$y, : font
family not found in Windows font databaseWarning in grid.Call.graphics(C_text, as.graphicsAnnot(x$label), x$x, x$y, :
font family not found in Windows font database
De volgorde van de margezijden is boven, rechts, onder, links-een mooie manier om deze volgorde te onthouden is “trouble dat sorteert de eerste letter van de vier zijden.
Je kunt ook
unit()gebruiken in plaats vanmargin().
ggplot(chic, aes(x = date, y = temp)) +
geom_point(color = "firebrick") +
labs(x = "Jaar", y = "Temperatuur (°F)") +
theme(plot.background = element_rect(fill = "gray60"),
plot.margin = unit(c(1, 3, 1, 8), "cm"))Warning in grid.Call(C_textBounds, as.graphicsAnnot(x$label), x$x, x$y, : font
family not found in Windows font database
Warning in grid.Call(C_textBounds, as.graphicsAnnot(x$label), x$x, x$y, : font
family not found in Windows font database
Warning in grid.Call(C_textBounds, as.graphicsAnnot(x$label), x$x, x$y, : font
family not found in Windows font database
Warning in grid.Call(C_textBounds, as.graphicsAnnot(x$label), x$x, x$y, : font
family not found in Windows font database
Warning in grid.Call(C_textBounds, as.graphicsAnnot(x$label), x$x, x$y, : font
family not found in Windows font database
Warning in grid.Call(C_textBounds, as.graphicsAnnot(x$label), x$x, x$y, : font
family not found in Windows font database
Warning in grid.Call(C_textBounds, as.graphicsAnnot(x$label), x$x, x$y, : font
family not found in Windows font databaseWarning in grid.Call.graphics(C_text, as.graphicsAnnot(x$label), x$x, x$y, :
font family not found in Windows font database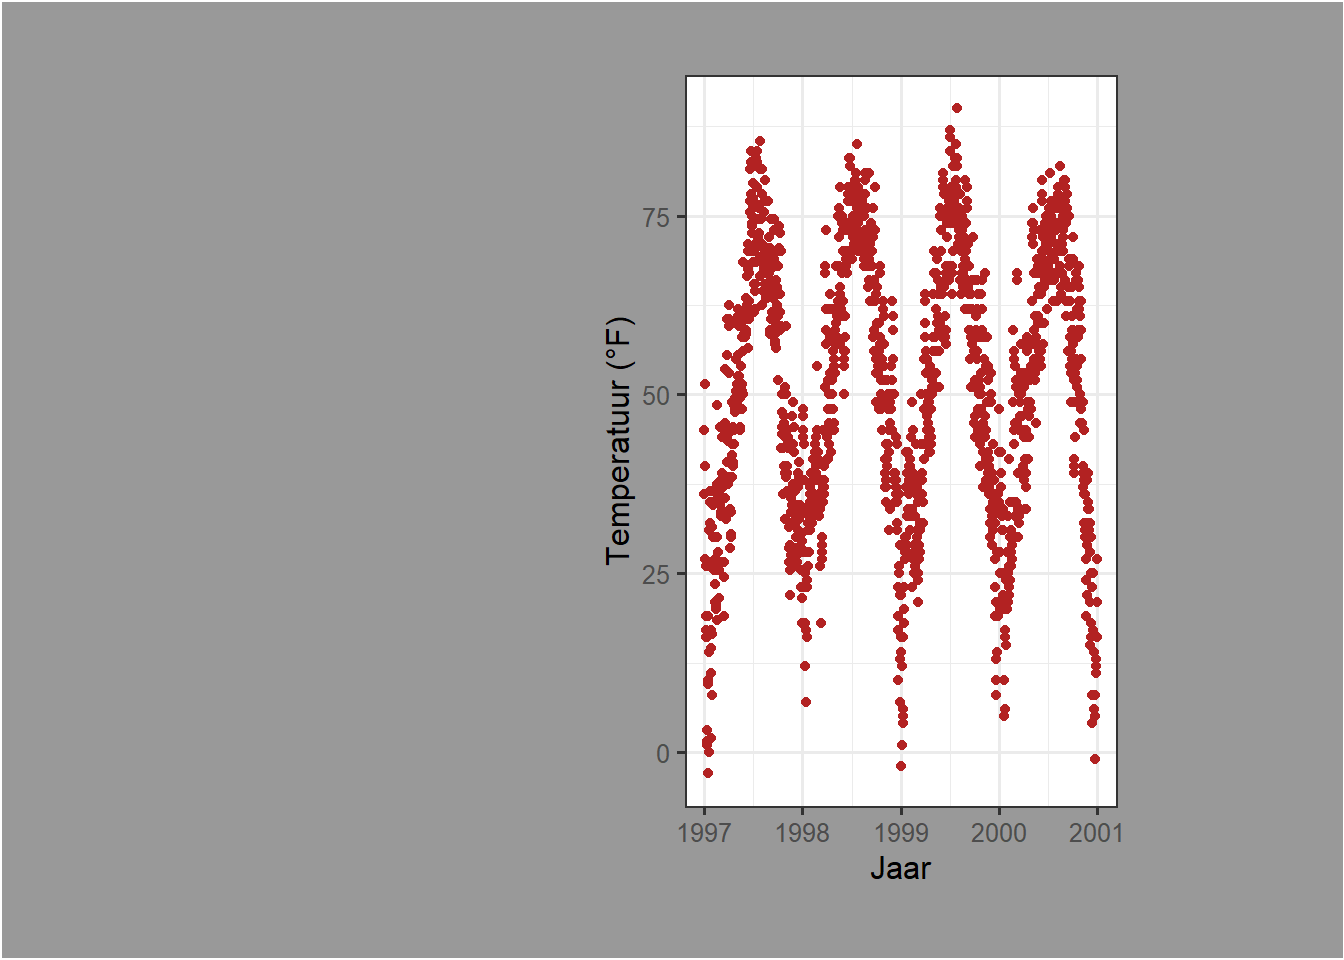
Werken met multi-paneel plots
Het ggplot2 pakket heeft twee mooie functies voor het maken van multi-panel plots, facets genaamd. Ze zijn verwant maar een beetje verschillend: facet_wrap creëert in wezen een lint van plots gebaseerd op een enkele variabele terwijl facet_grid een raster van twee variabelen overspant.
Maak een raster van kleine veelvouden gebaseerd op twee variabelen
In het geval van twee variabelen, doet facet_grid het werk. Hier bepaalt de volgorde van de variabelen het aantal rijen en kolommen:
ggplot(chic, aes(x = date, y = temp)) +
geom_point(color = "orangered", alpha = .3) +
theme(axis.text.x = element_text(angle = 45, vjust = 1, hjust = 1)) +
labs(x = "Jaar", y = "Temperatuur (°F)") +
facet_grid(year ~ season)Warning in grid.Call(C_textBounds, as.graphicsAnnot(x$label), x$x, x$y, : font
family not found in Windows font database
Warning in grid.Call(C_textBounds, as.graphicsAnnot(x$label), x$x, x$y, : font
family not found in Windows font databaseWarning in grid.Call.graphics(C_text, as.graphicsAnnot(x$label), x$x, x$y, :
font family not found in Windows font database
Warning in grid.Call.graphics(C_text, as.graphicsAnnot(x$label), x$x, x$y, :
font family not found in Windows font database
Warning in grid.Call.graphics(C_text, as.graphicsAnnot(x$label), x$x, x$y, :
font family not found in Windows font database
Warning in grid.Call.graphics(C_text, as.graphicsAnnot(x$label), x$x, x$y, :
font family not found in Windows font database
Warning in grid.Call.graphics(C_text, as.graphicsAnnot(x$label), x$x, x$y, :
font family not found in Windows font database
Warning in grid.Call.graphics(C_text, as.graphicsAnnot(x$label), x$x, x$y, :
font family not found in Windows font database
Warning in grid.Call.graphics(C_text, as.graphicsAnnot(x$label), x$x, x$y, :
font family not found in Windows font database
Warning in grid.Call.graphics(C_text, as.graphicsAnnot(x$label), x$x, x$y, :
font family not found in Windows font databaseWarning in grid.Call(C_textBounds, as.graphicsAnnot(x$label), x$x, x$y, : font
family not found in Windows font databaseWarning in grid.Call.graphics(C_text, as.graphicsAnnot(x$label), x$x, x$y, :
font family not found in Windows font database
Warning in grid.Call.graphics(C_text, as.graphicsAnnot(x$label), x$x, x$y, :
font family not found in Windows font database
Warning in grid.Call.graphics(C_text, as.graphicsAnnot(x$label), x$x, x$y, :
font family not found in Windows font database
Warning in grid.Call.graphics(C_text, as.graphicsAnnot(x$label), x$x, x$y, :
font family not found in Windows font database
Warning in grid.Call.graphics(C_text, as.graphicsAnnot(x$label), x$x, x$y, :
font family not found in Windows font database
Warning in grid.Call.graphics(C_text, as.graphicsAnnot(x$label), x$x, x$y, :
font family not found in Windows font database
Warning in grid.Call.graphics(C_text, as.graphicsAnnot(x$label), x$x, x$y, :
font family not found in Windows font database
Warning in grid.Call.graphics(C_text, as.graphicsAnnot(x$label), x$x, x$y, :
font family not found in Windows font database
Warning in grid.Call.graphics(C_text, as.graphicsAnnot(x$label), x$x, x$y, :
font family not found in Windows font databaseWarning in grid.Call(C_textBounds, as.graphicsAnnot(x$label), x$x, x$y, : font
family not found in Windows font database
Warning in grid.Call(C_textBounds, as.graphicsAnnot(x$label), x$x, x$y, : font
family not found in Windows font databaseWarning in grid.Call.graphics(C_text, as.graphicsAnnot(x$label), x$x, x$y, :
font family not found in Windows font database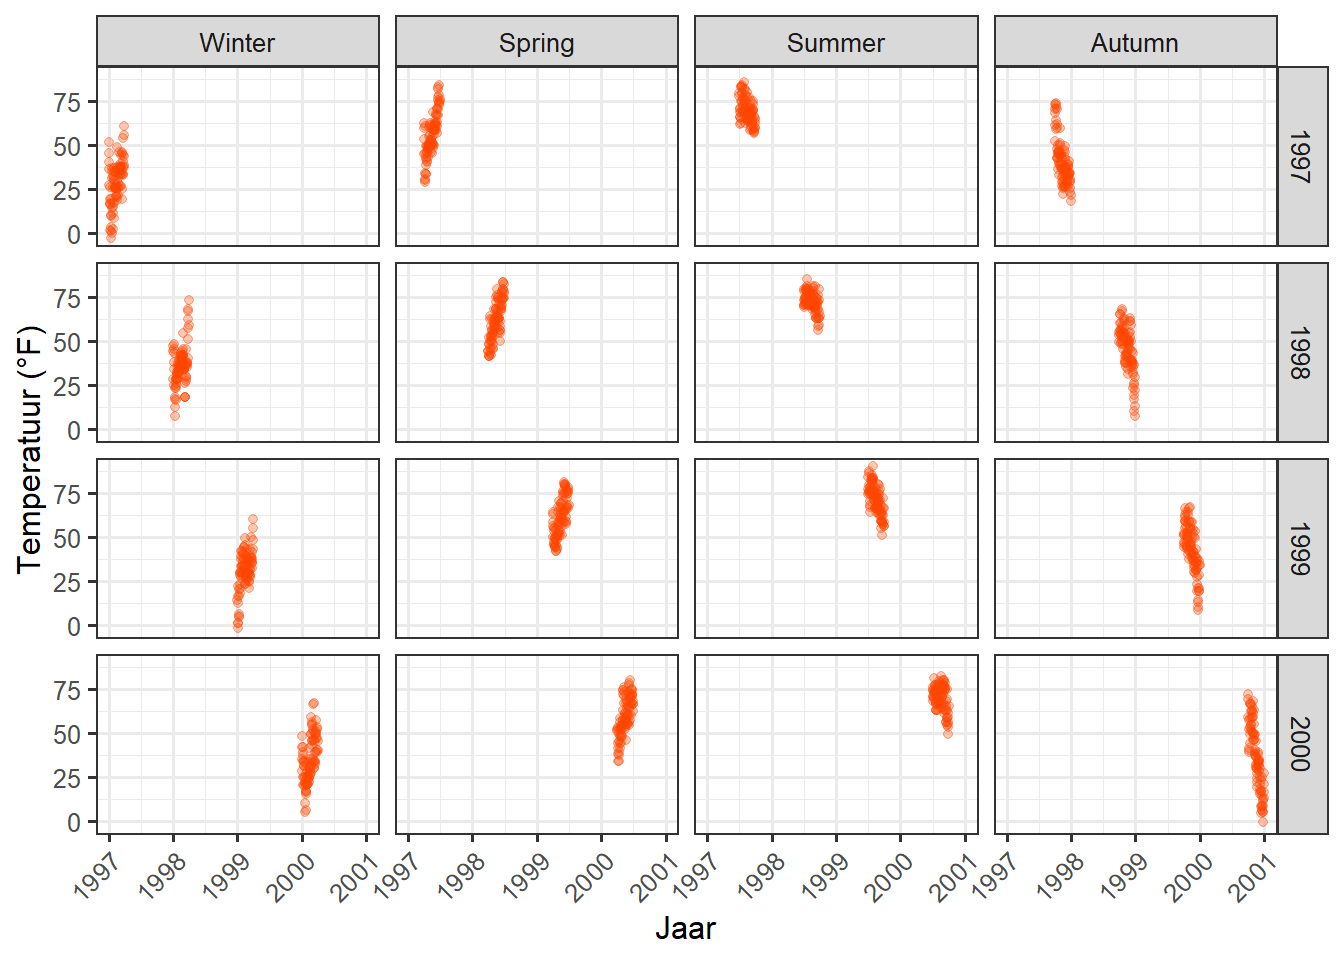
Om van rij- naar kolomindeling te veranderen kun je facet_grid(year ~ season) veranderen in facet_grid(season ~ year).
Maak kleine veelvouden gebaseerd op één variabele
facet_wrap maakt een facet van een enkele variabele, geschreven met een tilde ervoor: facet_wrap(~ variable). Het uiterlijk van deze subplots wordt geregeld door de argumenten ncol en nrow:
g <-
ggplot(chic, aes(x = date, y = temp)) +
geom_point(color = "chartreuse4", alpha = .3) +
labs(x = "Jaar", y = "Temperatuur (°F)") +
theme(axis.text.x = element_text(angle = 45, vjust = 1, hjust = 1))
g + facet_wrap(~ year)Warning in grid.Call(C_textBounds, as.graphicsAnnot(x$label), x$x, x$y, : font
family not found in Windows font database
Warning in grid.Call(C_textBounds, as.graphicsAnnot(x$label), x$x, x$y, : font
family not found in Windows font databaseWarning in grid.Call.graphics(C_text, as.graphicsAnnot(x$label), x$x, x$y, :
font family not found in Windows font database
Warning in grid.Call.graphics(C_text, as.graphicsAnnot(x$label), x$x, x$y, :
font family not found in Windows font database
Warning in grid.Call.graphics(C_text, as.graphicsAnnot(x$label), x$x, x$y, :
font family not found in Windows font database
Warning in grid.Call.graphics(C_text, as.graphicsAnnot(x$label), x$x, x$y, :
font family not found in Windows font database
Warning in grid.Call.graphics(C_text, as.graphicsAnnot(x$label), x$x, x$y, :
font family not found in Windows font database
Warning in grid.Call.graphics(C_text, as.graphicsAnnot(x$label), x$x, x$y, :
font family not found in Windows font database
Warning in grid.Call.graphics(C_text, as.graphicsAnnot(x$label), x$x, x$y, :
font family not found in Windows font database
Warning in grid.Call.graphics(C_text, as.graphicsAnnot(x$label), x$x, x$y, :
font family not found in Windows font database
Warning in grid.Call.graphics(C_text, as.graphicsAnnot(x$label), x$x, x$y, :
font family not found in Windows font database
Warning in grid.Call.graphics(C_text, as.graphicsAnnot(x$label), x$x, x$y, :
font family not found in Windows font databaseWarning in grid.Call(C_textBounds, as.graphicsAnnot(x$label), x$x, x$y, : font
family not found in Windows font databaseWarning in grid.Call.graphics(C_text, as.graphicsAnnot(x$label), x$x, x$y, :
font family not found in Windows font database
Warning in grid.Call.graphics(C_text, as.graphicsAnnot(x$label), x$x, x$y, :
font family not found in Windows font database
Warning in grid.Call.graphics(C_text, as.graphicsAnnot(x$label), x$x, x$y, :
font family not found in Windows font database
Warning in grid.Call.graphics(C_text, as.graphicsAnnot(x$label), x$x, x$y, :
font family not found in Windows font database
Warning in grid.Call.graphics(C_text, as.graphicsAnnot(x$label), x$x, x$y, :
font family not found in Windows font database
Warning in grid.Call.graphics(C_text, as.graphicsAnnot(x$label), x$x, x$y, :
font family not found in Windows font database
Warning in grid.Call.graphics(C_text, as.graphicsAnnot(x$label), x$x, x$y, :
font family not found in Windows font database
Warning in grid.Call.graphics(C_text, as.graphicsAnnot(x$label), x$x, x$y, :
font family not found in Windows font database
Warning in grid.Call.graphics(C_text, as.graphicsAnnot(x$label), x$x, x$y, :
font family not found in Windows font databaseWarning in grid.Call(C_textBounds, as.graphicsAnnot(x$label), x$x, x$y, : font
family not found in Windows font database
Warning in grid.Call(C_textBounds, as.graphicsAnnot(x$label), x$x, x$y, : font
family not found in Windows font databaseWarning in grid.Call.graphics(C_text, as.graphicsAnnot(x$label), x$x, x$y, :
font family not found in Windows font database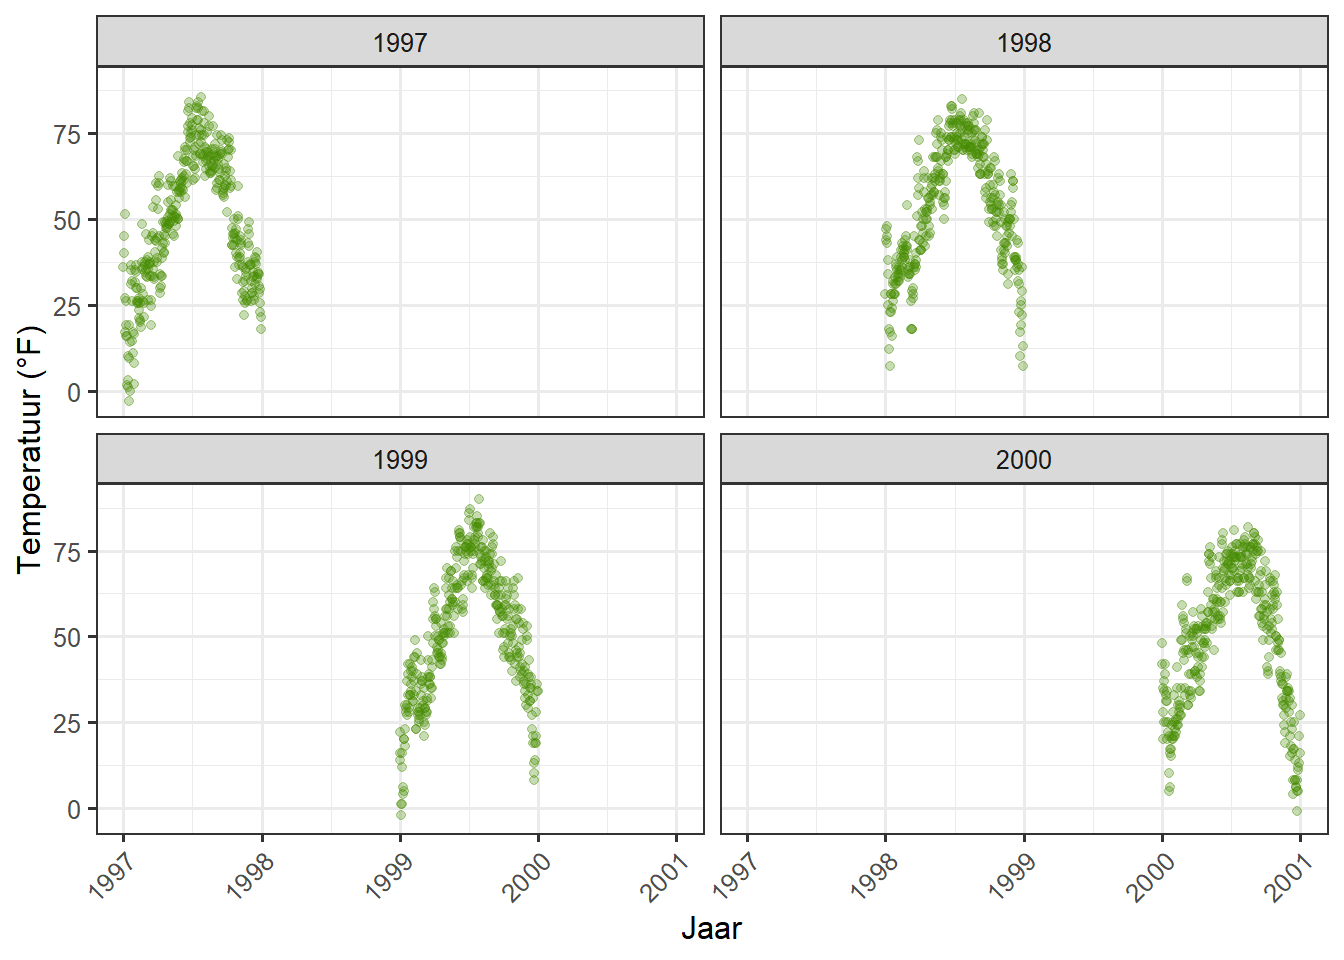
Dienovereenkomstig kunt je de plots rangschikken zoals je wilt, in plaats van als een matrix in één rij…
g + facet_wrap(~ year, nrow = 1)Warning in grid.Call(C_textBounds, as.graphicsAnnot(x$label), x$x, x$y, : font
family not found in Windows font database
Warning in grid.Call(C_textBounds, as.graphicsAnnot(x$label), x$x, x$y, : font
family not found in Windows font databaseWarning in grid.Call.graphics(C_text, as.graphicsAnnot(x$label), x$x, x$y, :
font family not found in Windows font database
Warning in grid.Call.graphics(C_text, as.graphicsAnnot(x$label), x$x, x$y, :
font family not found in Windows font database
Warning in grid.Call.graphics(C_text, as.graphicsAnnot(x$label), x$x, x$y, :
font family not found in Windows font database
Warning in grid.Call.graphics(C_text, as.graphicsAnnot(x$label), x$x, x$y, :
font family not found in Windows font database
Warning in grid.Call.graphics(C_text, as.graphicsAnnot(x$label), x$x, x$y, :
font family not found in Windows font database
Warning in grid.Call.graphics(C_text, as.graphicsAnnot(x$label), x$x, x$y, :
font family not found in Windows font database
Warning in grid.Call.graphics(C_text, as.graphicsAnnot(x$label), x$x, x$y, :
font family not found in Windows font database
Warning in grid.Call.graphics(C_text, as.graphicsAnnot(x$label), x$x, x$y, :
font family not found in Windows font database
Warning in grid.Call.graphics(C_text, as.graphicsAnnot(x$label), x$x, x$y, :
font family not found in Windows font database
Warning in grid.Call.graphics(C_text, as.graphicsAnnot(x$label), x$x, x$y, :
font family not found in Windows font databaseWarning in grid.Call(C_textBounds, as.graphicsAnnot(x$label), x$x, x$y, : font
family not found in Windows font databaseWarning in grid.Call.graphics(C_text, as.graphicsAnnot(x$label), x$x, x$y, :
font family not found in Windows font database
Warning in grid.Call.graphics(C_text, as.graphicsAnnot(x$label), x$x, x$y, :
font family not found in Windows font database
Warning in grid.Call.graphics(C_text, as.graphicsAnnot(x$label), x$x, x$y, :
font family not found in Windows font database
Warning in grid.Call.graphics(C_text, as.graphicsAnnot(x$label), x$x, x$y, :
font family not found in Windows font database
Warning in grid.Call.graphics(C_text, as.graphicsAnnot(x$label), x$x, x$y, :
font family not found in Windows font database
Warning in grid.Call.graphics(C_text, as.graphicsAnnot(x$label), x$x, x$y, :
font family not found in Windows font database
Warning in grid.Call.graphics(C_text, as.graphicsAnnot(x$label), x$x, x$y, :
font family not found in Windows font database
Warning in grid.Call.graphics(C_text, as.graphicsAnnot(x$label), x$x, x$y, :
font family not found in Windows font database
Warning in grid.Call.graphics(C_text, as.graphicsAnnot(x$label), x$x, x$y, :
font family not found in Windows font databaseWarning in grid.Call(C_textBounds, as.graphicsAnnot(x$label), x$x, x$y, : font
family not found in Windows font database
Warning in grid.Call(C_textBounds, as.graphicsAnnot(x$label), x$x, x$y, : font
family not found in Windows font databaseWarning in grid.Call.graphics(C_text, as.graphicsAnnot(x$label), x$x, x$y, :
font family not found in Windows font database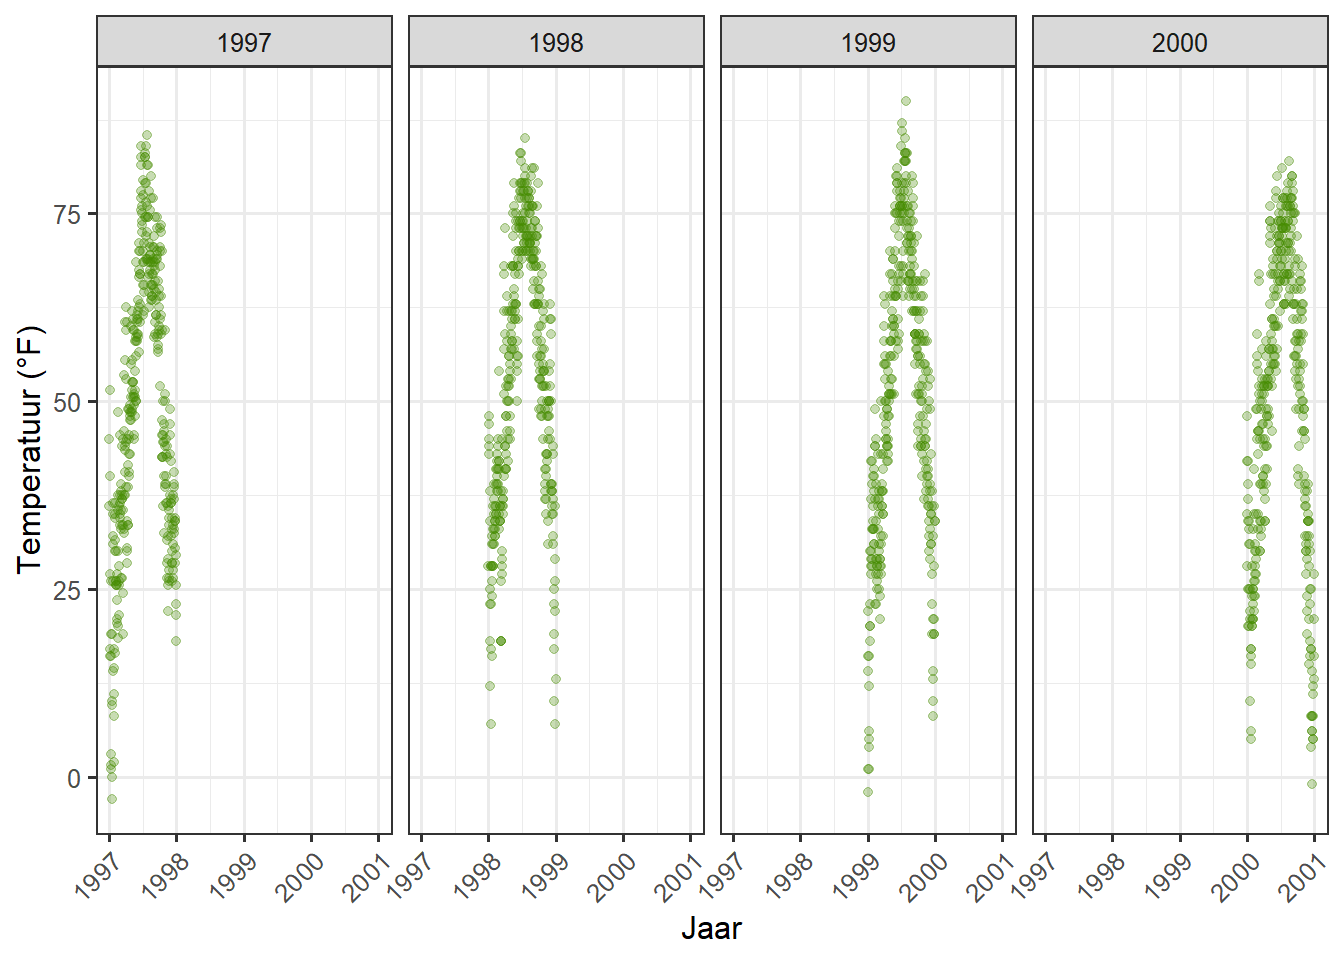
… of zelfs als een asymmetrisch raster van percelen:
g + facet_wrap(~ year, ncol = 3) + theme(axis.title.x = element_text(hjust = .15))Warning in grid.Call(C_textBounds, as.graphicsAnnot(x$label), x$x, x$y, : font
family not found in Windows font database
Warning in grid.Call(C_textBounds, as.graphicsAnnot(x$label), x$x, x$y, : font
family not found in Windows font databaseWarning in grid.Call.graphics(C_text, as.graphicsAnnot(x$label), x$x, x$y, :
font family not found in Windows font database
Warning in grid.Call.graphics(C_text, as.graphicsAnnot(x$label), x$x, x$y, :
font family not found in Windows font database
Warning in grid.Call.graphics(C_text, as.graphicsAnnot(x$label), x$x, x$y, :
font family not found in Windows font database
Warning in grid.Call.graphics(C_text, as.graphicsAnnot(x$label), x$x, x$y, :
font family not found in Windows font database
Warning in grid.Call.graphics(C_text, as.graphicsAnnot(x$label), x$x, x$y, :
font family not found in Windows font database
Warning in grid.Call.graphics(C_text, as.graphicsAnnot(x$label), x$x, x$y, :
font family not found in Windows font database
Warning in grid.Call.graphics(C_text, as.graphicsAnnot(x$label), x$x, x$y, :
font family not found in Windows font database
Warning in grid.Call.graphics(C_text, as.graphicsAnnot(x$label), x$x, x$y, :
font family not found in Windows font database
Warning in grid.Call.graphics(C_text, as.graphicsAnnot(x$label), x$x, x$y, :
font family not found in Windows font database
Warning in grid.Call.graphics(C_text, as.graphicsAnnot(x$label), x$x, x$y, :
font family not found in Windows font databaseWarning in grid.Call(C_textBounds, as.graphicsAnnot(x$label), x$x, x$y, : font
family not found in Windows font databaseWarning in grid.Call.graphics(C_text, as.graphicsAnnot(x$label), x$x, x$y, :
font family not found in Windows font database
Warning in grid.Call.graphics(C_text, as.graphicsAnnot(x$label), x$x, x$y, :
font family not found in Windows font database
Warning in grid.Call.graphics(C_text, as.graphicsAnnot(x$label), x$x, x$y, :
font family not found in Windows font database
Warning in grid.Call.graphics(C_text, as.graphicsAnnot(x$label), x$x, x$y, :
font family not found in Windows font database
Warning in grid.Call.graphics(C_text, as.graphicsAnnot(x$label), x$x, x$y, :
font family not found in Windows font database
Warning in grid.Call.graphics(C_text, as.graphicsAnnot(x$label), x$x, x$y, :
font family not found in Windows font database
Warning in grid.Call.graphics(C_text, as.graphicsAnnot(x$label), x$x, x$y, :
font family not found in Windows font database
Warning in grid.Call.graphics(C_text, as.graphicsAnnot(x$label), x$x, x$y, :
font family not found in Windows font database
Warning in grid.Call.graphics(C_text, as.graphicsAnnot(x$label), x$x, x$y, :
font family not found in Windows font databaseWarning in grid.Call(C_textBounds, as.graphicsAnnot(x$label), x$x, x$y, : font
family not found in Windows font database
Warning in grid.Call(C_textBounds, as.graphicsAnnot(x$label), x$x, x$y, : font
family not found in Windows font databaseWarning in grid.Call.graphics(C_text, as.graphicsAnnot(x$label), x$x, x$y, :
font family not found in Windows font database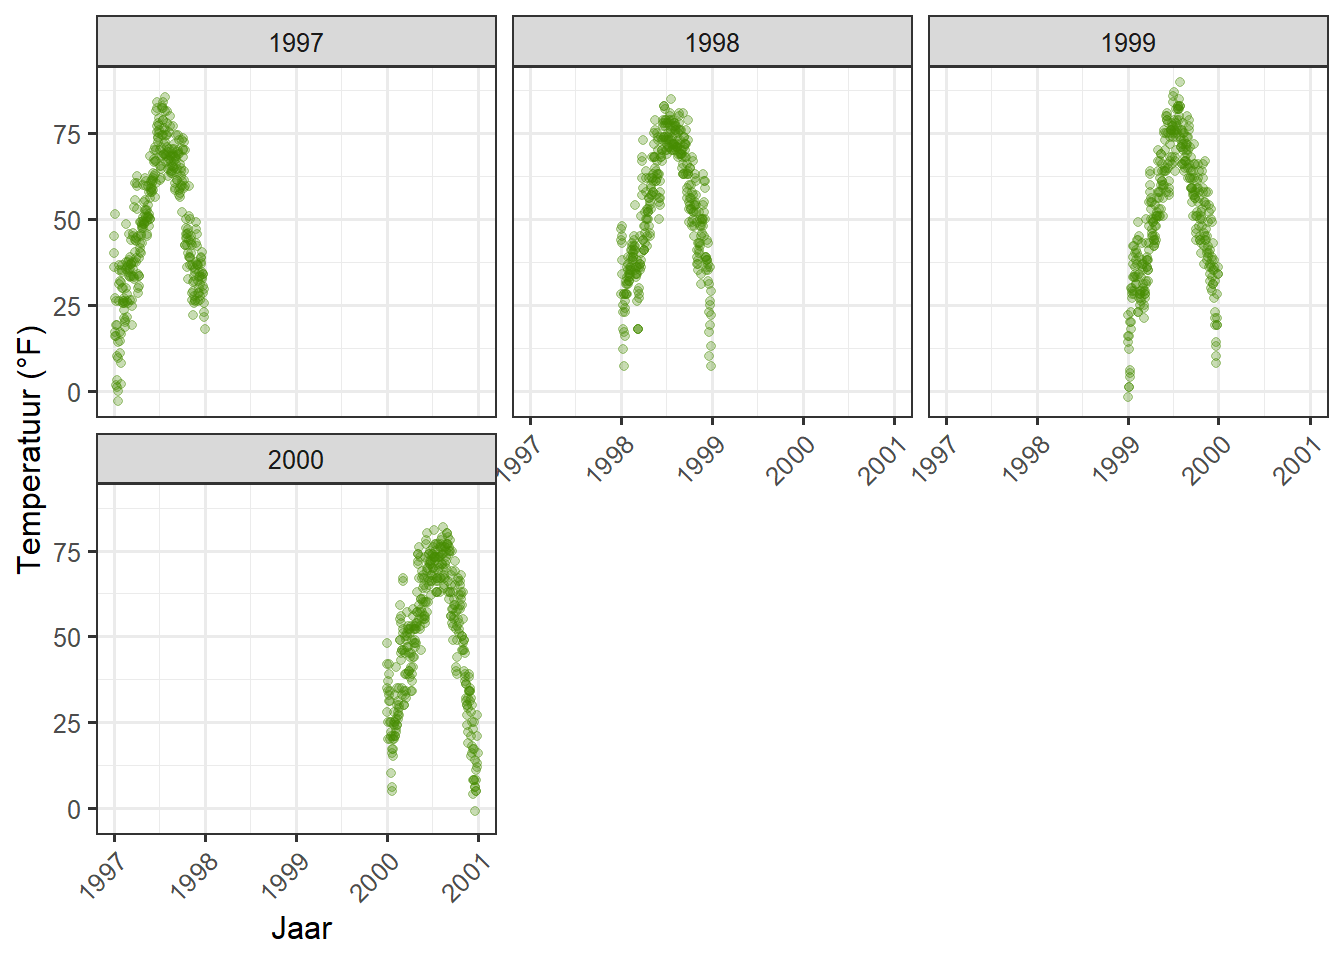
Assen vrij laten lopen
De standaard voor multi-panel plots in ggplot2 is om gelijkwaardige schalen te gebruiken in elk paneel. Maar soms wil je toestaan dat de gegevens van een paneel zelf de schaal bepalen. Dit is vaak geen goed idee omdat het de gebruiker een verkeerde indruk kan geven over de data. Maar soms is het wel degelijk nuttig en om dit te doen kunt u scales = "free" instellen:
g + facet_wrap(~ year, nrow = 2, scales = "free")Warning in grid.Call(C_textBounds, as.graphicsAnnot(x$label), x$x, x$y, : font
family not found in Windows font database
Warning in grid.Call(C_textBounds, as.graphicsAnnot(x$label), x$x, x$y, : font
family not found in Windows font databaseWarning in grid.Call.graphics(C_text, as.graphicsAnnot(x$label), x$x, x$y, :
font family not found in Windows font database
Warning in grid.Call.graphics(C_text, as.graphicsAnnot(x$label), x$x, x$y, :
font family not found in Windows font database
Warning in grid.Call.graphics(C_text, as.graphicsAnnot(x$label), x$x, x$y, :
font family not found in Windows font database
Warning in grid.Call.graphics(C_text, as.graphicsAnnot(x$label), x$x, x$y, :
font family not found in Windows font database
Warning in grid.Call.graphics(C_text, as.graphicsAnnot(x$label), x$x, x$y, :
font family not found in Windows font database
Warning in grid.Call.graphics(C_text, as.graphicsAnnot(x$label), x$x, x$y, :
font family not found in Windows font database
Warning in grid.Call.graphics(C_text, as.graphicsAnnot(x$label), x$x, x$y, :
font family not found in Windows font database
Warning in grid.Call.graphics(C_text, as.graphicsAnnot(x$label), x$x, x$y, :
font family not found in Windows font database
Warning in grid.Call.graphics(C_text, as.graphicsAnnot(x$label), x$x, x$y, :
font family not found in Windows font database
Warning in grid.Call.graphics(C_text, as.graphicsAnnot(x$label), x$x, x$y, :
font family not found in Windows font databaseWarning in grid.Call(C_textBounds, as.graphicsAnnot(x$label), x$x, x$y, : font
family not found in Windows font databaseWarning in grid.Call.graphics(C_text, as.graphicsAnnot(x$label), x$x, x$y, :
font family not found in Windows font database
Warning in grid.Call.graphics(C_text, as.graphicsAnnot(x$label), x$x, x$y, :
font family not found in Windows font database
Warning in grid.Call.graphics(C_text, as.graphicsAnnot(x$label), x$x, x$y, :
font family not found in Windows font database
Warning in grid.Call.graphics(C_text, as.graphicsAnnot(x$label), x$x, x$y, :
font family not found in Windows font database
Warning in grid.Call.graphics(C_text, as.graphicsAnnot(x$label), x$x, x$y, :
font family not found in Windows font database
Warning in grid.Call.graphics(C_text, as.graphicsAnnot(x$label), x$x, x$y, :
font family not found in Windows font database
Warning in grid.Call.graphics(C_text, as.graphicsAnnot(x$label), x$x, x$y, :
font family not found in Windows font database
Warning in grid.Call.graphics(C_text, as.graphicsAnnot(x$label), x$x, x$y, :
font family not found in Windows font database
Warning in grid.Call.graphics(C_text, as.graphicsAnnot(x$label), x$x, x$y, :
font family not found in Windows font databaseWarning in grid.Call(C_textBounds, as.graphicsAnnot(x$label), x$x, x$y, : font
family not found in Windows font database
Warning in grid.Call(C_textBounds, as.graphicsAnnot(x$label), x$x, x$y, : font
family not found in Windows font databaseWarning in grid.Call.graphics(C_text, as.graphicsAnnot(x$label), x$x, x$y, :
font family not found in Windows font database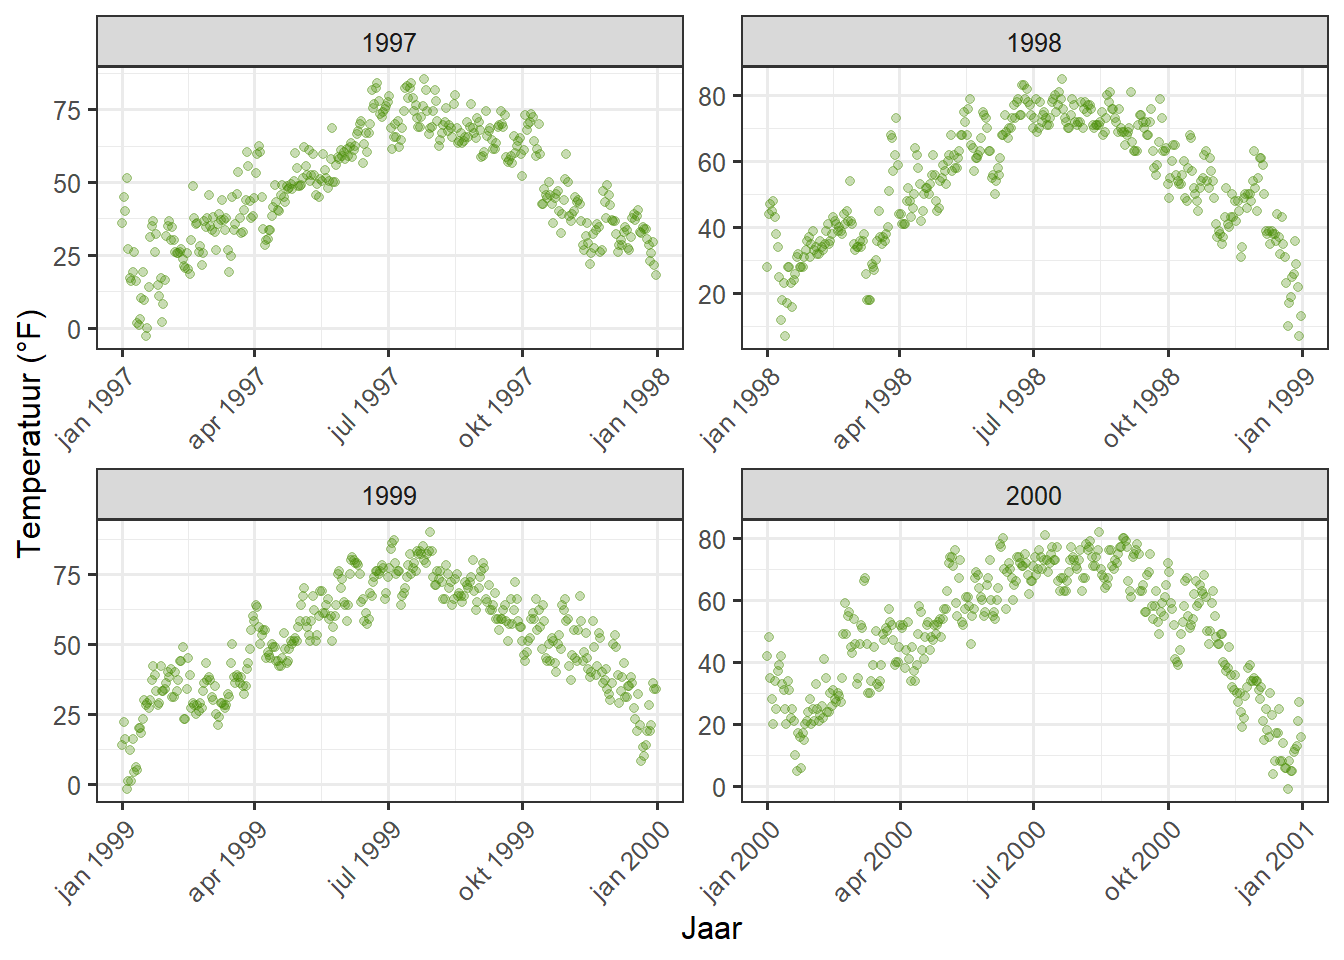
Merk op dat zowel de x-as als de y-as verschillen in hun bereik!
Gebruik facet_wrap met twee variabelen
De functie facet_wrap kan ook twee variabelen aannemen:
g + facet_wrap(year ~ season, nrow = 4, scales = "free_x")Warning in grid.Call(C_textBounds, as.graphicsAnnot(x$label), x$x, x$y, : font
family not found in Windows font database
Warning in grid.Call(C_textBounds, as.graphicsAnnot(x$label), x$x, x$y, : font
family not found in Windows font databaseWarning in grid.Call.graphics(C_text, as.graphicsAnnot(x$label), x$x, x$y, :
font family not found in Windows font database
Warning in grid.Call.graphics(C_text, as.graphicsAnnot(x$label), x$x, x$y, :
font family not found in Windows font database
Warning in grid.Call.graphics(C_text, as.graphicsAnnot(x$label), x$x, x$y, :
font family not found in Windows font database
Warning in grid.Call.graphics(C_text, as.graphicsAnnot(x$label), x$x, x$y, :
font family not found in Windows font database
Warning in grid.Call.graphics(C_text, as.graphicsAnnot(x$label), x$x, x$y, :
font family not found in Windows font database
Warning in grid.Call.graphics(C_text, as.graphicsAnnot(x$label), x$x, x$y, :
font family not found in Windows font database
Warning in grid.Call.graphics(C_text, as.graphicsAnnot(x$label), x$x, x$y, :
font family not found in Windows font database
Warning in grid.Call.graphics(C_text, as.graphicsAnnot(x$label), x$x, x$y, :
font family not found in Windows font databaseWarning in grid.Call(C_textBounds, as.graphicsAnnot(x$label), x$x, x$y, : font
family not found in Windows font databaseWarning in grid.Call.graphics(C_text, as.graphicsAnnot(x$label), x$x, x$y, :
font family not found in Windows font database
Warning in grid.Call.graphics(C_text, as.graphicsAnnot(x$label), x$x, x$y, :
font family not found in Windows font database
Warning in grid.Call.graphics(C_text, as.graphicsAnnot(x$label), x$x, x$y, :
font family not found in Windows font database
Warning in grid.Call.graphics(C_text, as.graphicsAnnot(x$label), x$x, x$y, :
font family not found in Windows font database
Warning in grid.Call.graphics(C_text, as.graphicsAnnot(x$label), x$x, x$y, :
font family not found in Windows font database
Warning in grid.Call.graphics(C_text, as.graphicsAnnot(x$label), x$x, x$y, :
font family not found in Windows font database
Warning in grid.Call.graphics(C_text, as.graphicsAnnot(x$label), x$x, x$y, :
font family not found in Windows font databaseWarning in grid.Call(C_textBounds, as.graphicsAnnot(x$label), x$x, x$y, : font
family not found in Windows font database
Warning in grid.Call(C_textBounds, as.graphicsAnnot(x$label), x$x, x$y, : font
family not found in Windows font databaseWarning in grid.Call.graphics(C_text, as.graphicsAnnot(x$label), x$x, x$y, :
font family not found in Windows font database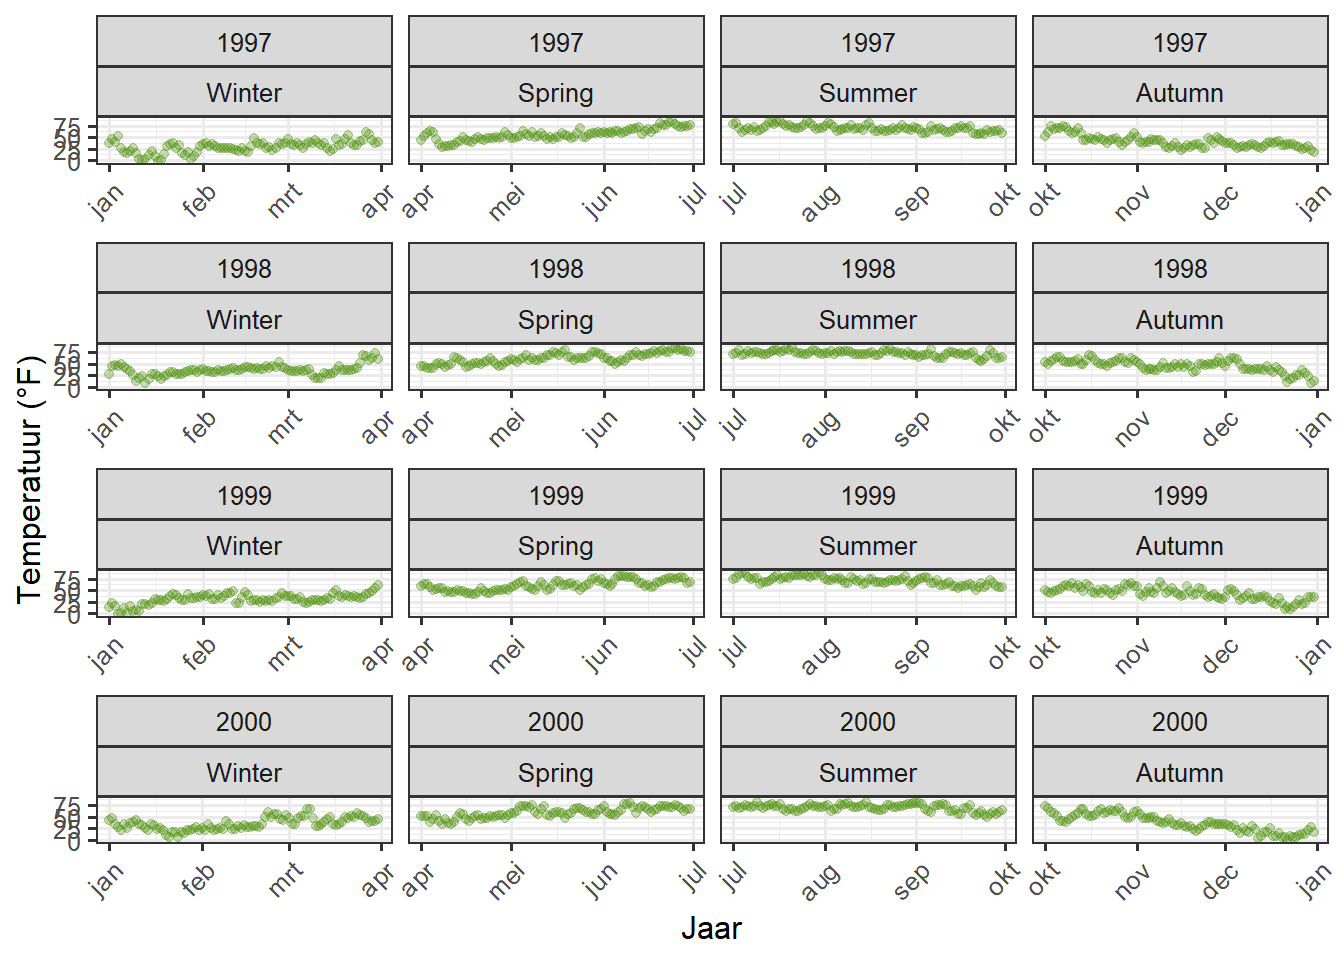
Bij het gebruik van facet_wrap heeft u nog steeds controle over het ontwerp van het grid: u kunt het aantal plots per rij en kolom herschikken en u kunt ook alle assen vrij laten rondlopen. In tegenstelling hiermee neemt facet_grid ook een free argument, maar laat het alleen per kolom of rij vrij rondlopen:
g + facet_grid(year ~ season, scales = "free_x")Warning in grid.Call(C_textBounds, as.graphicsAnnot(x$label), x$x, x$y, : font
family not found in Windows font database
Warning in grid.Call(C_textBounds, as.graphicsAnnot(x$label), x$x, x$y, : font
family not found in Windows font databaseWarning in grid.Call.graphics(C_text, as.graphicsAnnot(x$label), x$x, x$y, :
font family not found in Windows font database
Warning in grid.Call.graphics(C_text, as.graphicsAnnot(x$label), x$x, x$y, :
font family not found in Windows font database
Warning in grid.Call.graphics(C_text, as.graphicsAnnot(x$label), x$x, x$y, :
font family not found in Windows font database
Warning in grid.Call.graphics(C_text, as.graphicsAnnot(x$label), x$x, x$y, :
font family not found in Windows font database
Warning in grid.Call.graphics(C_text, as.graphicsAnnot(x$label), x$x, x$y, :
font family not found in Windows font database
Warning in grid.Call.graphics(C_text, as.graphicsAnnot(x$label), x$x, x$y, :
font family not found in Windows font database
Warning in grid.Call.graphics(C_text, as.graphicsAnnot(x$label), x$x, x$y, :
font family not found in Windows font database
Warning in grid.Call.graphics(C_text, as.graphicsAnnot(x$label), x$x, x$y, :
font family not found in Windows font databaseWarning in grid.Call(C_textBounds, as.graphicsAnnot(x$label), x$x, x$y, : font
family not found in Windows font databaseWarning in grid.Call.graphics(C_text, as.graphicsAnnot(x$label), x$x, x$y, :
font family not found in Windows font database
Warning in grid.Call.graphics(C_text, as.graphicsAnnot(x$label), x$x, x$y, :
font family not found in Windows font database
Warning in grid.Call.graphics(C_text, as.graphicsAnnot(x$label), x$x, x$y, :
font family not found in Windows font database
Warning in grid.Call.graphics(C_text, as.graphicsAnnot(x$label), x$x, x$y, :
font family not found in Windows font database
Warning in grid.Call.graphics(C_text, as.graphicsAnnot(x$label), x$x, x$y, :
font family not found in Windows font database
Warning in grid.Call.graphics(C_text, as.graphicsAnnot(x$label), x$x, x$y, :
font family not found in Windows font database
Warning in grid.Call.graphics(C_text, as.graphicsAnnot(x$label), x$x, x$y, :
font family not found in Windows font databaseWarning in grid.Call(C_textBounds, as.graphicsAnnot(x$label), x$x, x$y, : font
family not found in Windows font databaseWarning in grid.Call.graphics(C_text, as.graphicsAnnot(x$label), x$x, x$y, :
font family not found in Windows font database
Warning in grid.Call.graphics(C_text, as.graphicsAnnot(x$label), x$x, x$y, :
font family not found in Windows font database
Warning in grid.Call.graphics(C_text, as.graphicsAnnot(x$label), x$x, x$y, :
font family not found in Windows font database
Warning in grid.Call.graphics(C_text, as.graphicsAnnot(x$label), x$x, x$y, :
font family not found in Windows font database
Warning in grid.Call.graphics(C_text, as.graphicsAnnot(x$label), x$x, x$y, :
font family not found in Windows font database
Warning in grid.Call.graphics(C_text, as.graphicsAnnot(x$label), x$x, x$y, :
font family not found in Windows font database
Warning in grid.Call.graphics(C_text, as.graphicsAnnot(x$label), x$x, x$y, :
font family not found in Windows font databaseWarning in grid.Call(C_textBounds, as.graphicsAnnot(x$label), x$x, x$y, : font
family not found in Windows font database
Warning in grid.Call(C_textBounds, as.graphicsAnnot(x$label), x$x, x$y, : font
family not found in Windows font databaseWarning in grid.Call.graphics(C_text, as.graphicsAnnot(x$label), x$x, x$y, :
font family not found in Windows font database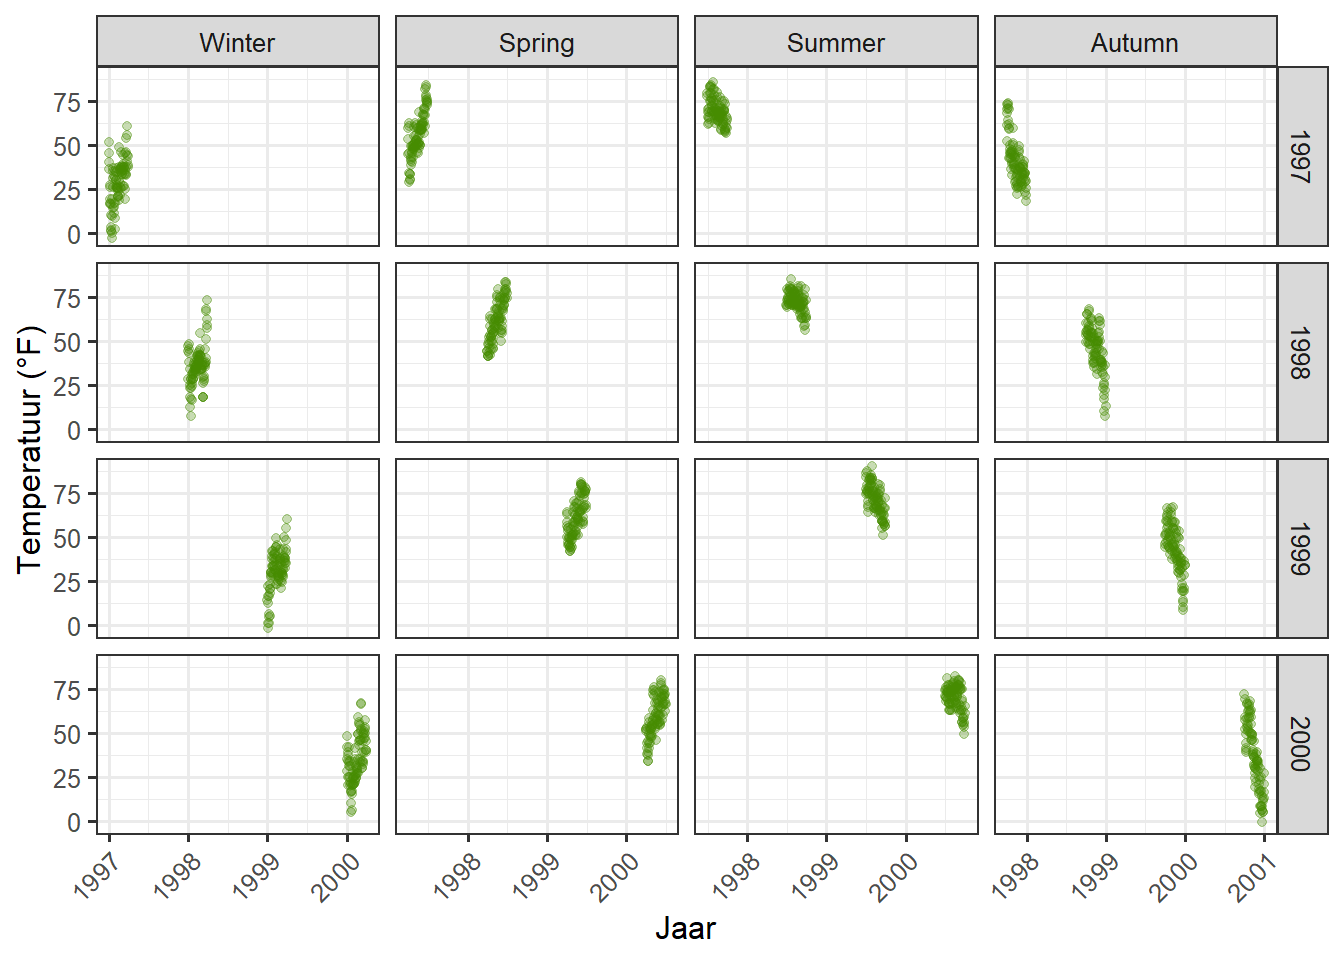
Stijl van strookteksten wijzigen
Door thema te gebruiken, kunt u het uiterlijk van de strook tekst (d.w.z. de titel voor elk facet) en de strook tekstvakken wijzigen:
g + facet_wrap(~ year, nrow = 1, scales = "free_x") +
theme(strip.text = element_text(face = "bold", color = "chartreuse4",
hjust = 0, size = 20),
strip.background = element_rect(fill = "chartreuse3", linetype = "dotted"))Warning in grid.Call(C_stringMetric, as.graphicsAnnot(x$label)): font family not
found in Windows font databaseWarning in grid.Call(C_textBounds, as.graphicsAnnot(x$label), x$x, x$y, : font
family not found in Windows font database
Warning in grid.Call(C_textBounds, as.graphicsAnnot(x$label), x$x, x$y, : font
family not found in Windows font database
Warning in grid.Call(C_textBounds, as.graphicsAnnot(x$label), x$x, x$y, : font
family not found in Windows font databaseWarning in grid.Call.graphics(C_text, as.graphicsAnnot(x$label), x$x, x$y, :
font family not found in Windows font databaseWarning in grid.Call(C_textBounds, as.graphicsAnnot(x$label), x$x, x$y, : font
family not found in Windows font databaseWarning in grid.Call.graphics(C_text, as.graphicsAnnot(x$label), x$x, x$y, :
font family not found in Windows font database
Warning in grid.Call.graphics(C_text, as.graphicsAnnot(x$label), x$x, x$y, :
font family not found in Windows font database
Warning in grid.Call.graphics(C_text, as.graphicsAnnot(x$label), x$x, x$y, :
font family not found in Windows font database
Warning in grid.Call.graphics(C_text, as.graphicsAnnot(x$label), x$x, x$y, :
font family not found in Windows font database
Warning in grid.Call.graphics(C_text, as.graphicsAnnot(x$label), x$x, x$y, :
font family not found in Windows font database
Warning in grid.Call.graphics(C_text, as.graphicsAnnot(x$label), x$x, x$y, :
font family not found in Windows font database
Warning in grid.Call.graphics(C_text, as.graphicsAnnot(x$label), x$x, x$y, :
font family not found in Windows font database
Warning in grid.Call.graphics(C_text, as.graphicsAnnot(x$label), x$x, x$y, :
font family not found in Windows font database
Warning in grid.Call.graphics(C_text, as.graphicsAnnot(x$label), x$x, x$y, :
font family not found in Windows font databaseWarning in grid.Call(C_textBounds, as.graphicsAnnot(x$label), x$x, x$y, : font
family not found in Windows font database
Warning in grid.Call(C_textBounds, as.graphicsAnnot(x$label), x$x, x$y, : font
family not found in Windows font databaseWarning in grid.Call.graphics(C_text, as.graphicsAnnot(x$label), x$x, x$y, :
font family not found in Windows font database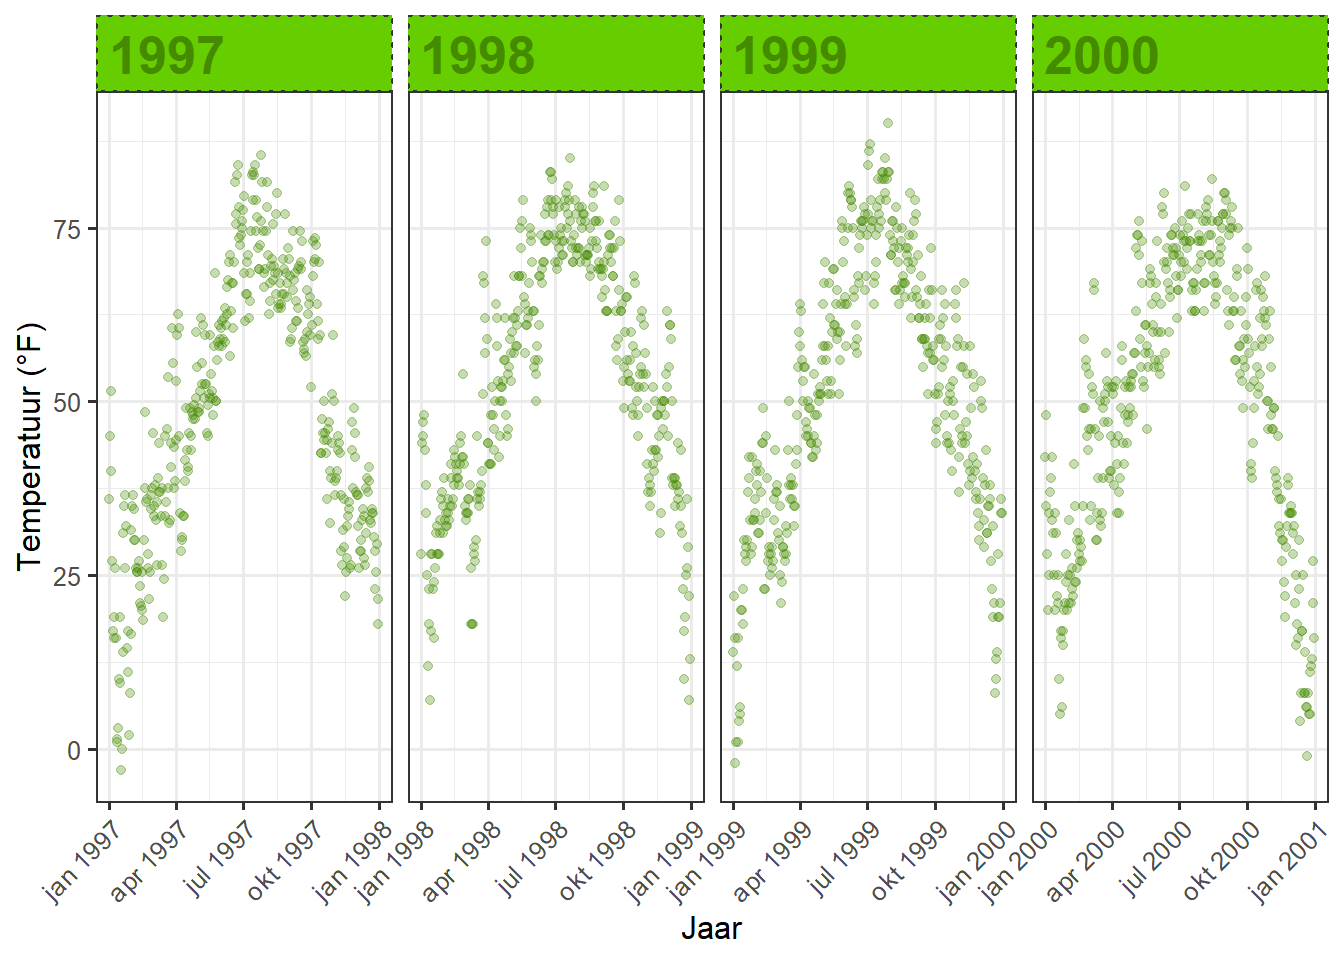
De volgende two functions adapted from this answer by Claus Wilke, maakt de auteur van het ggtext pakket het mogelijk om specifieke labels te markeren in combinatie met element_textbox() dat wordt geleverd door ggtext.
library(ggtext)
library(rlang)Warning: package 'rlang' was built under R version 4.1.3
Attaching package: 'rlang'The following objects are masked from 'package:purrr':
%@%, as_function, flatten, flatten_chr, flatten_dbl, flatten_int,
flatten_lgl, flatten_raw, invoke, spliceelement_textbox_highlight <- function(..., hi.labels = NULL, hi.fill = NULL,
hi.col = NULL, hi.box.col = NULL, hi.family = NULL) {
structure(
c(element_textbox(...),
list(hi.labels = hi.labels, hi.fill = hi.fill, hi.col = hi.col, hi.box.col = hi.box.col, hi.family = hi.family)
),
class = c("element_textbox_highlight", "element_textbox", "element_text", "element")
)
}
element_grob.element_textbox_highlight <- function(element, label = "", ...) {
if (label %in% element$hi.labels) {
element$fill <- element$hi.fill %||% element$fill
element$colour <- element$hi.col %||% element$colour
element$box.colour <- element$hi.box.col %||% element$box.colour
element$family <- element$hi.family %||% element$family
}
NextMethod()
}Nu kun je het gebruiken en bijvoorbeeld alle strookteksten opgeven:
g + facet_wrap(year ~ season, nrow = 4, scales = "free_x") +
theme(
strip.background = element_blank(),
strip.text = element_textbox_highlight(
family = "Playfair", size = 12, face = "bold",
fill = "white", box.color = "chartreuse4", color = "chartreuse4",
halign = .5, linetype = 1, r = unit(5, "pt"), width = unit(1, "npc"),
padding = margin(5, 0, 3, 0), margin = margin(0, 1, 3, 1),
hi.labels = c("1997", "1998", "1999", "2000"),
hi.fill = "chartreuse4", hi.box.col = "black", hi.col = "white"
)
)Warning in grid.Call(C_textBounds, as.graphicsAnnot(x$label), x$x, x$y, : font
family not found in Windows font databaseWarning in grid.Call(C_stringMetric, as.graphicsAnnot(x$label)): font family not
found in Windows font databaseWarning in grid.Call(C_textBounds, as.graphicsAnnot(x$label), x$x, x$y, : font
family not found in Windows font database
Warning in grid.Call(C_textBounds, as.graphicsAnnot(x$label), x$x, x$y, : font
family not found in Windows font database
Warning in grid.Call(C_textBounds, as.graphicsAnnot(x$label), x$x, x$y, : font
family not found in Windows font databaseWarning in grid.Call.graphics(C_text, as.graphicsAnnot(x$label), x$x, x$y, :
font family not found in Windows font databaseWarning in grid.Call(C_textBounds, as.graphicsAnnot(x$label), x$x, x$y, : font
family not found in Windows font databaseWarning in grid.Call.graphics(C_text, as.graphicsAnnot(x$label), x$x, x$y, :
font family not found in Windows font database
Warning in grid.Call.graphics(C_text, as.graphicsAnnot(x$label), x$x, x$y, :
font family not found in Windows font database
Warning in grid.Call.graphics(C_text, as.graphicsAnnot(x$label), x$x, x$y, :
font family not found in Windows font database
Warning in grid.Call.graphics(C_text, as.graphicsAnnot(x$label), x$x, x$y, :
font family not found in Windows font database
Warning in grid.Call.graphics(C_text, as.graphicsAnnot(x$label), x$x, x$y, :
font family not found in Windows font database
Warning in grid.Call.graphics(C_text, as.graphicsAnnot(x$label), x$x, x$y, :
font family not found in Windows font database
Warning in grid.Call.graphics(C_text, as.graphicsAnnot(x$label), x$x, x$y, :
font family not found in Windows font databaseWarning in grid.Call(C_textBounds, as.graphicsAnnot(x$label), x$x, x$y, : font
family not found in Windows font database
Warning in grid.Call(C_textBounds, as.graphicsAnnot(x$label), x$x, x$y, : font
family not found in Windows font databaseWarning in grid.Call.graphics(C_text, as.graphicsAnnot(x$label), x$x, x$y, :
font family not found in Windows font database
ggplot(chic, aes(x = date, y = temp)) +
geom_point(aes(color = season == "Summer"), alpha = .3) +
labs(x = "Jaar", y = "Temperatuur (°F)") +
facet_wrap(~ season, nrow = 1) +
scale_color_manual(values = c("gray40", "firebrick"), guide = "none") +
theme(
axis.text.x = element_text(angle = 45, vjust = 1, hjust = 1),
strip.background = element_blank(),
strip.text = element_textbox_highlight(
size = 12, face = "bold",
fill = "white", box.color = "white", color = "gray40",
halign = .5, linetype = 1, r = unit(0, "pt"), width = unit(1, "npc"),
padding = margin(2, 0, 1, 0), margin = margin(0, 1, 3, 1),
hi.labels = "Summer", hi.family = "Bangers",
hi.fill = "firebrick", hi.box.col = "firebrick", hi.col = "white"
)
)Warning in grid.Call(C_textBounds, as.graphicsAnnot(x$label), x$x, x$y, : font
family not found in Windows font database
Warning in grid.Call(C_textBounds, as.graphicsAnnot(x$label), x$x, x$y, : font
family not found in Windows font database
Warning in grid.Call(C_textBounds, as.graphicsAnnot(x$label), x$x, x$y, : font
family not found in Windows font database
Warning in grid.Call(C_textBounds, as.graphicsAnnot(x$label), x$x, x$y, : font
family not found in Windows font database
Warning in grid.Call(C_textBounds, as.graphicsAnnot(x$label), x$x, x$y, : font
family not found in Windows font database
Warning in grid.Call(C_textBounds, as.graphicsAnnot(x$label), x$x, x$y, : font
family not found in Windows font database
Warning in grid.Call(C_textBounds, as.graphicsAnnot(x$label), x$x, x$y, : font
family not found in Windows font databaseWarning in grid.Call.graphics(C_text, as.graphicsAnnot(x$label), x$x, x$y, :
font family not found in Windows font database
Warning in grid.Call.graphics(C_text, as.graphicsAnnot(x$label), x$x, x$y, :
font family not found in Windows font database
Warning in grid.Call.graphics(C_text, as.graphicsAnnot(x$label), x$x, x$y, :
font family not found in Windows font databaseWarning in grid.Call(C_textBounds, as.graphicsAnnot(x$label), x$x, x$y, : font
family not found in Windows font databaseWarning in grid.Call.graphics(C_text, as.graphicsAnnot(x$label), x$x, x$y, :
font family not found in Windows font database
Warning in grid.Call.graphics(C_text, as.graphicsAnnot(x$label), x$x, x$y, :
font family not found in Windows font database
Warning in grid.Call.graphics(C_text, as.graphicsAnnot(x$label), x$x, x$y, :
font family not found in Windows font database
Warning in grid.Call.graphics(C_text, as.graphicsAnnot(x$label), x$x, x$y, :
font family not found in Windows font database
Warning in grid.Call.graphics(C_text, as.graphicsAnnot(x$label), x$x, x$y, :
font family not found in Windows font database
Warning in grid.Call.graphics(C_text, as.graphicsAnnot(x$label), x$x, x$y, :
font family not found in Windows font database
Warning in grid.Call.graphics(C_text, as.graphicsAnnot(x$label), x$x, x$y, :
font family not found in Windows font database
Warning in grid.Call.graphics(C_text, as.graphicsAnnot(x$label), x$x, x$y, :
font family not found in Windows font database
Warning in grid.Call.graphics(C_text, as.graphicsAnnot(x$label), x$x, x$y, :
font family not found in Windows font databaseWarning in grid.Call(C_textBounds, as.graphicsAnnot(x$label), x$x, x$y, : font
family not found in Windows font database
Warning in grid.Call(C_textBounds, as.graphicsAnnot(x$label), x$x, x$y, : font
family not found in Windows font databaseWarning in grid.Call.graphics(C_text, as.graphicsAnnot(x$label), x$x, x$y, :
font family not found in Windows font database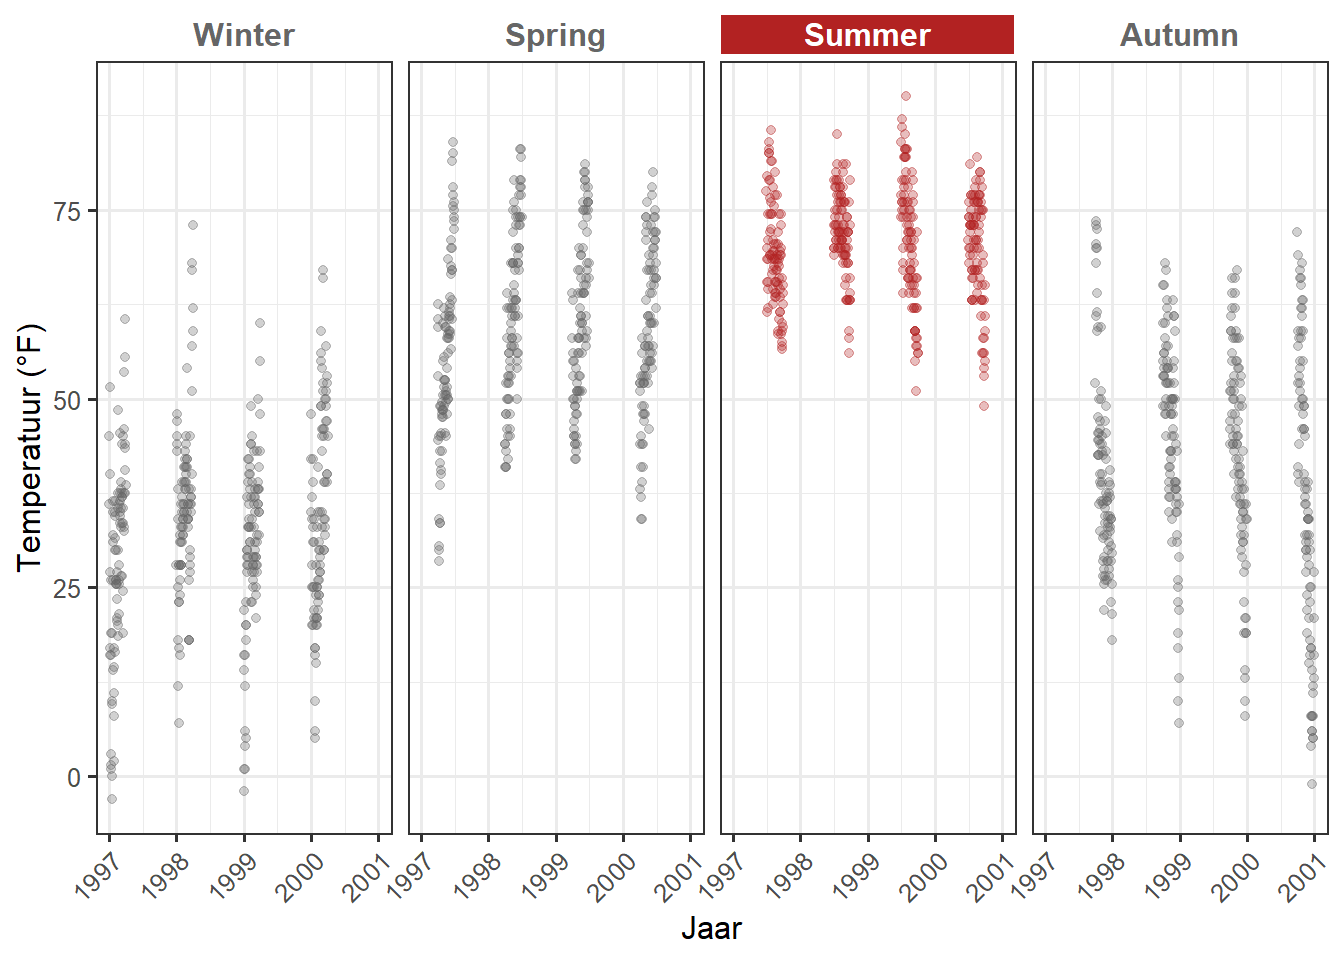
Een paneel van verschillende plots maken
Er zijn verschillende manieren om plots te combineren. De makkelijkste aanpak is volgens mij het patchwork package van Thomas Lin Pedersen:
p1 <- ggplot(chic, aes(x = date, y = temp,
color = season)) +
geom_point() +
geom_rug() +
labs(x = "Jaar", y = "Temperatuur (°F)")
p2 <- ggplot(chic, aes(x = date, y = o3)) +
geom_line(color = "gray") +
geom_point(color = "darkorange2") +
labs(x = "Jaar", y = "Ozon")
library(patchwork)
p1 + p2Warning in grid.Call(C_textBounds, as.graphicsAnnot(x$label), x$x, x$y, : font
family not found in Windows font database
Warning in grid.Call(C_textBounds, as.graphicsAnnot(x$label), x$x, x$y, : font
family not found in Windows font database
Warning in grid.Call(C_textBounds, as.graphicsAnnot(x$label), x$x, x$y, : font
family not found in Windows font database
Warning in grid.Call(C_textBounds, as.graphicsAnnot(x$label), x$x, x$y, : font
family not found in Windows font database
Warning in grid.Call(C_textBounds, as.graphicsAnnot(x$label), x$x, x$y, : font
family not found in Windows font database
Warning in grid.Call(C_textBounds, as.graphicsAnnot(x$label), x$x, x$y, : font
family not found in Windows font database
Warning in grid.Call(C_textBounds, as.graphicsAnnot(x$label), x$x, x$y, : font
family not found in Windows font database
Warning in grid.Call(C_textBounds, as.graphicsAnnot(x$label), x$x, x$y, : font
family not found in Windows font database
Warning in grid.Call(C_textBounds, as.graphicsAnnot(x$label), x$x, x$y, : font
family not found in Windows font databaseWarning in grid.Call.graphics(C_text, as.graphicsAnnot(x$label), x$x, x$y, :
font family not found in Windows font databaseWarning in grid.Call(C_textBounds, as.graphicsAnnot(x$label), x$x, x$y, : font
family not found in Windows font database
Warning in grid.Call(C_textBounds, as.graphicsAnnot(x$label), x$x, x$y, : font
family not found in Windows font database
Warning in grid.Call(C_textBounds, as.graphicsAnnot(x$label), x$x, x$y, : font
family not found in Windows font databaseWarning in grid.Call.graphics(C_text, as.graphicsAnnot(x$label), x$x, x$y, :
font family not found in Windows font database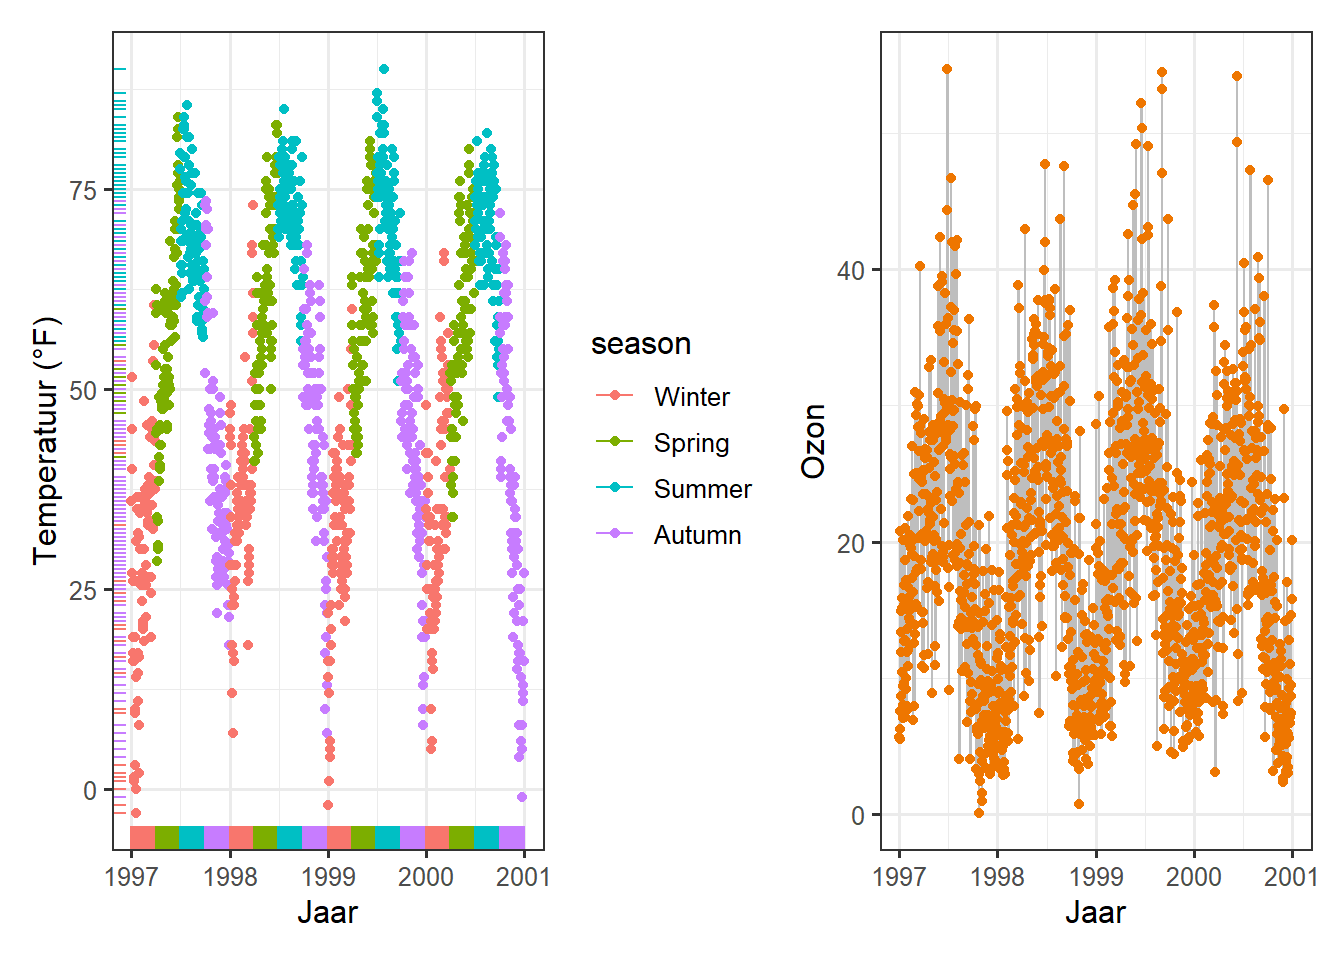
We kunnen de volgorde veranderen door beide plots te “verdelen” (en let op de uitlijning, ook al heeft de ene een legende en de andere niet!):
p1 / p2Warning in grid.Call(C_textBounds, as.graphicsAnnot(x$label), x$x, x$y, : font
family not found in Windows font database
Warning in grid.Call(C_textBounds, as.graphicsAnnot(x$label), x$x, x$y, : font
family not found in Windows font database
Warning in grid.Call(C_textBounds, as.graphicsAnnot(x$label), x$x, x$y, : font
family not found in Windows font database
Warning in grid.Call(C_textBounds, as.graphicsAnnot(x$label), x$x, x$y, : font
family not found in Windows font database
Warning in grid.Call(C_textBounds, as.graphicsAnnot(x$label), x$x, x$y, : font
family not found in Windows font database
Warning in grid.Call(C_textBounds, as.graphicsAnnot(x$label), x$x, x$y, : font
family not found in Windows font database
Warning in grid.Call(C_textBounds, as.graphicsAnnot(x$label), x$x, x$y, : font
family not found in Windows font database
Warning in grid.Call(C_textBounds, as.graphicsAnnot(x$label), x$x, x$y, : font
family not found in Windows font database
Warning in grid.Call(C_textBounds, as.graphicsAnnot(x$label), x$x, x$y, : font
family not found in Windows font databaseWarning in grid.Call.graphics(C_text, as.graphicsAnnot(x$label), x$x, x$y, :
font family not found in Windows font databaseWarning in grid.Call(C_textBounds, as.graphicsAnnot(x$label), x$x, x$y, : font
family not found in Windows font database
Warning in grid.Call(C_textBounds, as.graphicsAnnot(x$label), x$x, x$y, : font
family not found in Windows font database
Warning in grid.Call(C_textBounds, as.graphicsAnnot(x$label), x$x, x$y, : font
family not found in Windows font databaseWarning in grid.Call.graphics(C_text, as.graphicsAnnot(x$label), x$x, x$y, :
font family not found in Windows font database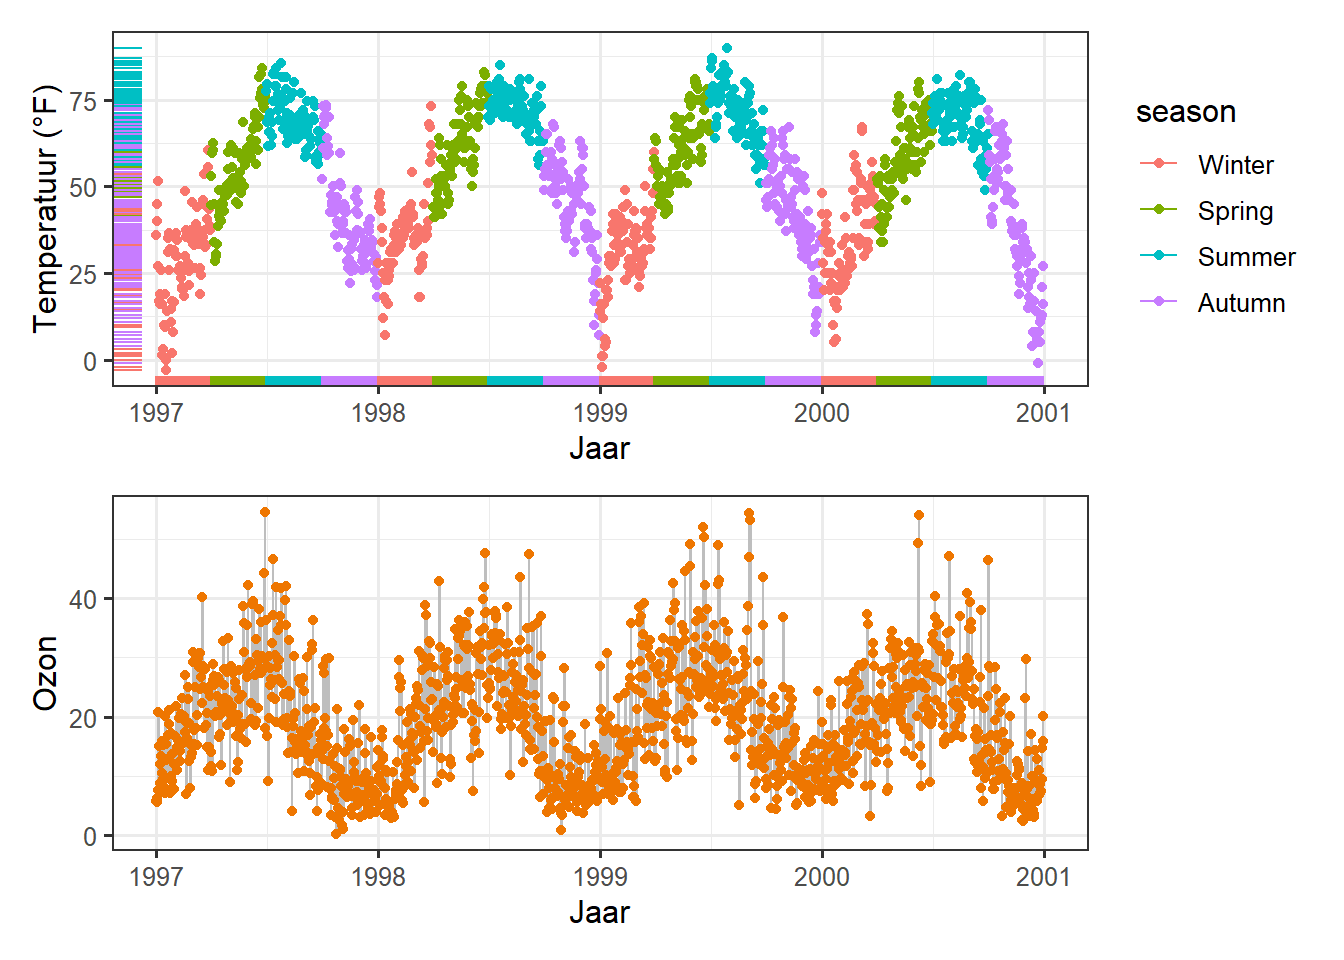
En ook geneste plots zijn mogelijk!
(g + p2) / p1Warning in grid.Call(C_textBounds, as.graphicsAnnot(x$label), x$x, x$y, : font
family not found in Windows font database
Warning in grid.Call(C_textBounds, as.graphicsAnnot(x$label), x$x, x$y, : font
family not found in Windows font database
Warning in grid.Call(C_textBounds, as.graphicsAnnot(x$label), x$x, x$y, : font
family not found in Windows font database
Warning in grid.Call(C_textBounds, as.graphicsAnnot(x$label), x$x, x$y, : font
family not found in Windows font database
Warning in grid.Call(C_textBounds, as.graphicsAnnot(x$label), x$x, x$y, : font
family not found in Windows font database
Warning in grid.Call(C_textBounds, as.graphicsAnnot(x$label), x$x, x$y, : font
family not found in Windows font database
Warning in grid.Call(C_textBounds, as.graphicsAnnot(x$label), x$x, x$y, : font
family not found in Windows font database
Warning in grid.Call(C_textBounds, as.graphicsAnnot(x$label), x$x, x$y, : font
family not found in Windows font database
Warning in grid.Call(C_textBounds, as.graphicsAnnot(x$label), x$x, x$y, : font
family not found in Windows font database
Warning in grid.Call(C_textBounds, as.graphicsAnnot(x$label), x$x, x$y, : font
family not found in Windows font databaseWarning in grid.Call.graphics(C_text, as.graphicsAnnot(x$label), x$x, x$y, :
font family not found in Windows font database
Warning in grid.Call.graphics(C_text, as.graphicsAnnot(x$label), x$x, x$y, :
font family not found in Windows font database
Warning in grid.Call.graphics(C_text, as.graphicsAnnot(x$label), x$x, x$y, :
font family not found in Windows font database
Warning in grid.Call.graphics(C_text, as.graphicsAnnot(x$label), x$x, x$y, :
font family not found in Windows font database
Warning in grid.Call.graphics(C_text, as.graphicsAnnot(x$label), x$x, x$y, :
font family not found in Windows font database
Warning in grid.Call.graphics(C_text, as.graphicsAnnot(x$label), x$x, x$y, :
font family not found in Windows font database
Warning in grid.Call.graphics(C_text, as.graphicsAnnot(x$label), x$x, x$y, :
font family not found in Windows font database
Warning in grid.Call.graphics(C_text, as.graphicsAnnot(x$label), x$x, x$y, :
font family not found in Windows font database
Warning in grid.Call.graphics(C_text, as.graphicsAnnot(x$label), x$x, x$y, :
font family not found in Windows font databaseWarning in grid.Call(C_textBounds, as.graphicsAnnot(x$label), x$x, x$y, : font
family not found in Windows font databaseWarning in grid.Call.graphics(C_text, as.graphicsAnnot(x$label), x$x, x$y, :
font family not found in Windows font databaseWarning in grid.Call(C_textBounds, as.graphicsAnnot(x$label), x$x, x$y, : font
family not found in Windows font database
Warning in grid.Call(C_textBounds, as.graphicsAnnot(x$label), x$x, x$y, : font
family not found in Windows font databaseWarning in grid.Call.graphics(C_text, as.graphicsAnnot(x$label), x$x, x$y, :
font family not found in Windows font databaseWarning in grid.Call(C_textBounds, as.graphicsAnnot(x$label), x$x, x$y, : font
family not found in Windows font database
Warning in grid.Call(C_textBounds, as.graphicsAnnot(x$label), x$x, x$y, : font
family not found in Windows font database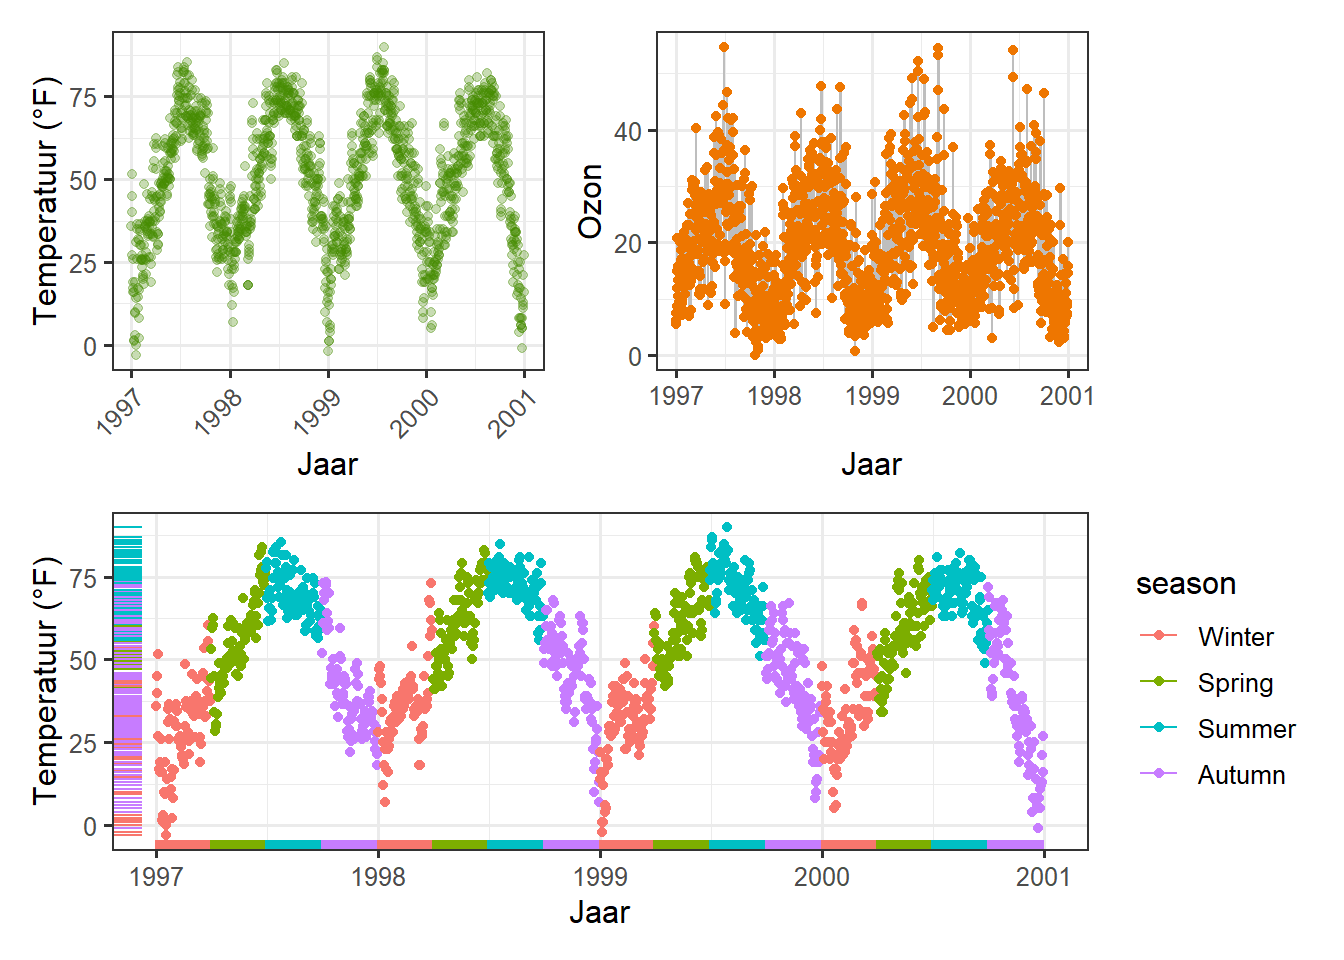
(Let op de uitlijning van de plots, hoewel slechts één plot een legenda heeft).
Als alternatief biedt het cowplot package van Claus Wilke de functionaliteit om meerdere plots te combineren (en vele andere goede utilities):
library(cowplot)
plot_grid(plot_grid(g, p1), p2, ncol = 1)Warning in grid.Call(C_stringMetric, as.graphicsAnnot(x$label)): font family
'Roboto Condensed' not found in PostScript font database
Warning in grid.Call(C_stringMetric, as.graphicsAnnot(x$label)): font family
'Roboto Condensed' not found in PostScript font database
Warning in grid.Call(C_stringMetric, as.graphicsAnnot(x$label)): font family
'Roboto Condensed' not found in PostScript font database
Warning in grid.Call(C_stringMetric, as.graphicsAnnot(x$label)): font family
'Roboto Condensed' not found in PostScript font database
Warning in grid.Call(C_stringMetric, as.graphicsAnnot(x$label)): font family
'Roboto Condensed' not found in PostScript font database
Warning in grid.Call(C_stringMetric, as.graphicsAnnot(x$label)): font family
'Roboto Condensed' not found in PostScript font database
Warning in grid.Call(C_stringMetric, as.graphicsAnnot(x$label)): font family
'Roboto Condensed' not found in PostScript font database
Warning in grid.Call(C_stringMetric, as.graphicsAnnot(x$label)): font family
'Roboto Condensed' not found in PostScript font database
Warning in grid.Call(C_stringMetric, as.graphicsAnnot(x$label)): font family
'Roboto Condensed' not found in PostScript font database
Warning in grid.Call(C_stringMetric, as.graphicsAnnot(x$label)): font family
'Roboto Condensed' not found in PostScript font database
Warning in grid.Call(C_stringMetric, as.graphicsAnnot(x$label)): font family
'Roboto Condensed' not found in PostScript font database
Warning in grid.Call(C_stringMetric, as.graphicsAnnot(x$label)): font family
'Roboto Condensed' not found in PostScript font database
Warning in grid.Call(C_stringMetric, as.graphicsAnnot(x$label)): font family
'Roboto Condensed' not found in PostScript font database
Warning in grid.Call(C_stringMetric, as.graphicsAnnot(x$label)): font family
'Roboto Condensed' not found in PostScript font database
Warning in grid.Call(C_stringMetric, as.graphicsAnnot(x$label)): font family
'Roboto Condensed' not found in PostScript font database
Warning in grid.Call(C_stringMetric, as.graphicsAnnot(x$label)): font family
'Roboto Condensed' not found in PostScript font database
Warning in grid.Call(C_stringMetric, as.graphicsAnnot(x$label)): font family
'Roboto Condensed' not found in PostScript font database
Warning in grid.Call(C_stringMetric, as.graphicsAnnot(x$label)): font family
'Roboto Condensed' not found in PostScript font database
Warning in grid.Call(C_stringMetric, as.graphicsAnnot(x$label)): font family
'Roboto Condensed' not found in PostScript font database
Warning in grid.Call(C_stringMetric, as.graphicsAnnot(x$label)): font family
'Roboto Condensed' not found in PostScript font database
Warning in grid.Call(C_stringMetric, as.graphicsAnnot(x$label)): font family
'Roboto Condensed' not found in PostScript font database
Warning in grid.Call(C_stringMetric, as.graphicsAnnot(x$label)): font family
'Roboto Condensed' not found in PostScript font database
Warning in grid.Call(C_stringMetric, as.graphicsAnnot(x$label)): font family
'Roboto Condensed' not found in PostScript font database
Warning in grid.Call(C_stringMetric, as.graphicsAnnot(x$label)): font family
'Roboto Condensed' not found in PostScript font database
Warning in grid.Call(C_stringMetric, as.graphicsAnnot(x$label)): font family
'Roboto Condensed' not found in PostScript font database
Warning in grid.Call(C_stringMetric, as.graphicsAnnot(x$label)): font family
'Roboto Condensed' not found in PostScript font database
Warning in grid.Call(C_stringMetric, as.graphicsAnnot(x$label)): font family
'Roboto Condensed' not found in PostScript font database
Warning in grid.Call(C_stringMetric, as.graphicsAnnot(x$label)): font family
'Roboto Condensed' not found in PostScript font databaseWarning in grid.Call(C_textBounds, as.graphicsAnnot(x$label), x$x, x$y, : font
family 'Roboto Condensed' not found in PostScript font database
Warning in grid.Call(C_textBounds, as.graphicsAnnot(x$label), x$x, x$y, : font
family 'Roboto Condensed' not found in PostScript font database
Warning in grid.Call(C_textBounds, as.graphicsAnnot(x$label), x$x, x$y, : font
family 'Roboto Condensed' not found in PostScript font database
Warning in grid.Call(C_textBounds, as.graphicsAnnot(x$label), x$x, x$y, : font
family 'Roboto Condensed' not found in PostScript font database
Warning in grid.Call(C_textBounds, as.graphicsAnnot(x$label), x$x, x$y, : font
family 'Roboto Condensed' not found in PostScript font database
Warning in grid.Call(C_textBounds, as.graphicsAnnot(x$label), x$x, x$y, : font
family 'Roboto Condensed' not found in PostScript font database
Warning in grid.Call(C_textBounds, as.graphicsAnnot(x$label), x$x, x$y, : font
family 'Roboto Condensed' not found in PostScript font database
Warning in grid.Call(C_textBounds, as.graphicsAnnot(x$label), x$x, x$y, : font
family 'Roboto Condensed' not found in PostScript font database
Warning in grid.Call(C_textBounds, as.graphicsAnnot(x$label), x$x, x$y, : font
family 'Roboto Condensed' not found in PostScript font database
Warning in grid.Call(C_textBounds, as.graphicsAnnot(x$label), x$x, x$y, : font
family 'Roboto Condensed' not found in PostScript font database
Warning in grid.Call(C_textBounds, as.graphicsAnnot(x$label), x$x, x$y, : font
family 'Roboto Condensed' not found in PostScript font database
Warning in grid.Call(C_textBounds, as.graphicsAnnot(x$label), x$x, x$y, : font
family 'Roboto Condensed' not found in PostScript font database
Warning in grid.Call(C_textBounds, as.graphicsAnnot(x$label), x$x, x$y, : font
family 'Roboto Condensed' not found in PostScript font database
Warning in grid.Call(C_textBounds, as.graphicsAnnot(x$label), x$x, x$y, : font
family 'Roboto Condensed' not found in PostScript font database
Warning in grid.Call(C_textBounds, as.graphicsAnnot(x$label), x$x, x$y, : font
family 'Roboto Condensed' not found in PostScript font database
Warning in grid.Call(C_textBounds, as.graphicsAnnot(x$label), x$x, x$y, : font
family 'Roboto Condensed' not found in PostScript font database
Warning in grid.Call(C_textBounds, as.graphicsAnnot(x$label), x$x, x$y, : font
family 'Roboto Condensed' not found in PostScript font database
Warning in grid.Call(C_textBounds, as.graphicsAnnot(x$label), x$x, x$y, : font
family 'Roboto Condensed' not found in PostScript font database
Warning in grid.Call(C_textBounds, as.graphicsAnnot(x$label), x$x, x$y, : font
family 'Roboto Condensed' not found in PostScript font database
Warning in grid.Call(C_textBounds, as.graphicsAnnot(x$label), x$x, x$y, : font
family 'Roboto Condensed' not found in PostScript font database
Warning in grid.Call(C_textBounds, as.graphicsAnnot(x$label), x$x, x$y, : font
family 'Roboto Condensed' not found in PostScript font database
Warning in grid.Call(C_textBounds, as.graphicsAnnot(x$label), x$x, x$y, : font
family 'Roboto Condensed' not found in PostScript font database
Warning in grid.Call(C_textBounds, as.graphicsAnnot(x$label), x$x, x$y, : font
family 'Roboto Condensed' not found in PostScript font database
Warning in grid.Call(C_textBounds, as.graphicsAnnot(x$label), x$x, x$y, : font
family 'Roboto Condensed' not found in PostScript font database
Warning in grid.Call(C_textBounds, as.graphicsAnnot(x$label), x$x, x$y, : font
family 'Roboto Condensed' not found in PostScript font database
Warning in grid.Call(C_textBounds, as.graphicsAnnot(x$label), x$x, x$y, : font
family 'Roboto Condensed' not found in PostScript font database
Warning in grid.Call(C_textBounds, as.graphicsAnnot(x$label), x$x, x$y, : font
family 'Roboto Condensed' not found in PostScript font database
Warning in grid.Call(C_textBounds, as.graphicsAnnot(x$label), x$x, x$y, : font
family 'Roboto Condensed' not found in PostScript font database
Warning in grid.Call(C_textBounds, as.graphicsAnnot(x$label), x$x, x$y, : font
family 'Roboto Condensed' not found in PostScript font database
Warning in grid.Call(C_textBounds, as.graphicsAnnot(x$label), x$x, x$y, : font
family 'Roboto Condensed' not found in PostScript font database
Warning in grid.Call(C_textBounds, as.graphicsAnnot(x$label), x$x, x$y, : font
family 'Roboto Condensed' not found in PostScript font database
Warning in grid.Call(C_textBounds, as.graphicsAnnot(x$label), x$x, x$y, : font
family 'Roboto Condensed' not found in PostScript font database
Warning in grid.Call(C_textBounds, as.graphicsAnnot(x$label), x$x, x$y, : font
family 'Roboto Condensed' not found in PostScript font database
Warning in grid.Call(C_textBounds, as.graphicsAnnot(x$label), x$x, x$y, : font
family 'Roboto Condensed' not found in PostScript font database
Warning in grid.Call(C_textBounds, as.graphicsAnnot(x$label), x$x, x$y, : font
family 'Roboto Condensed' not found in PostScript font database
Warning in grid.Call(C_textBounds, as.graphicsAnnot(x$label), x$x, x$y, : font
family 'Roboto Condensed' not found in PostScript font database
Warning in grid.Call(C_textBounds, as.graphicsAnnot(x$label), x$x, x$y, : font
family 'Roboto Condensed' not found in PostScript font database
Warning in grid.Call(C_textBounds, as.graphicsAnnot(x$label), x$x, x$y, : font
family 'Roboto Condensed' not found in PostScript font database
Warning in grid.Call(C_textBounds, as.graphicsAnnot(x$label), x$x, x$y, : font
family 'Roboto Condensed' not found in PostScript font database
Warning in grid.Call(C_textBounds, as.graphicsAnnot(x$label), x$x, x$y, : font
family 'Roboto Condensed' not found in PostScript font database
Warning in grid.Call(C_textBounds, as.graphicsAnnot(x$label), x$x, x$y, : font
family 'Roboto Condensed' not found in PostScript font database
Warning in grid.Call(C_textBounds, as.graphicsAnnot(x$label), x$x, x$y, : font
family 'Roboto Condensed' not found in PostScript font database
Warning in grid.Call(C_textBounds, as.graphicsAnnot(x$label), x$x, x$y, : font
family 'Roboto Condensed' not found in PostScript font database
Warning in grid.Call(C_textBounds, as.graphicsAnnot(x$label), x$x, x$y, : font
family 'Roboto Condensed' not found in PostScript font database
Warning in grid.Call(C_textBounds, as.graphicsAnnot(x$label), x$x, x$y, : font
family 'Roboto Condensed' not found in PostScript font database
Warning in grid.Call(C_textBounds, as.graphicsAnnot(x$label), x$x, x$y, : font
family 'Roboto Condensed' not found in PostScript font database
Warning in grid.Call(C_textBounds, as.graphicsAnnot(x$label), x$x, x$y, : font
family 'Roboto Condensed' not found in PostScript font database
Warning in grid.Call(C_textBounds, as.graphicsAnnot(x$label), x$x, x$y, : font
family 'Roboto Condensed' not found in PostScript font database
Warning in grid.Call(C_textBounds, as.graphicsAnnot(x$label), x$x, x$y, : font
family 'Roboto Condensed' not found in PostScript font database
Warning in grid.Call(C_textBounds, as.graphicsAnnot(x$label), x$x, x$y, : font
family 'Roboto Condensed' not found in PostScript font database
Warning in grid.Call(C_textBounds, as.graphicsAnnot(x$label), x$x, x$y, : font
family 'Roboto Condensed' not found in PostScript font database
Warning in grid.Call(C_textBounds, as.graphicsAnnot(x$label), x$x, x$y, : font
family 'Roboto Condensed' not found in PostScript font databaseWarning in grid.Call(C_textBounds, as.graphicsAnnot(x$label), x$x, x$y, : font
family not found in Windows font database
Warning in grid.Call(C_textBounds, as.graphicsAnnot(x$label), x$x, x$y, : font
family not found in Windows font database
Warning in grid.Call(C_textBounds, as.graphicsAnnot(x$label), x$x, x$y, : font
family not found in Windows font database
Warning in grid.Call(C_textBounds, as.graphicsAnnot(x$label), x$x, x$y, : font
family not found in Windows font database
Warning in grid.Call(C_textBounds, as.graphicsAnnot(x$label), x$x, x$y, : font
family not found in Windows font database
Warning in grid.Call(C_textBounds, as.graphicsAnnot(x$label), x$x, x$y, : font
family not found in Windows font databaseWarning in grid.Call.graphics(C_text, as.graphicsAnnot(x$label), x$x, x$y, :
font family not found in Windows font database
Warning in grid.Call.graphics(C_text, as.graphicsAnnot(x$label), x$x, x$y, :
font family not found in Windows font database
Warning in grid.Call.graphics(C_text, as.graphicsAnnot(x$label), x$x, x$y, :
font family not found in Windows font database
Warning in grid.Call.graphics(C_text, as.graphicsAnnot(x$label), x$x, x$y, :
font family not found in Windows font database
Warning in grid.Call.graphics(C_text, as.graphicsAnnot(x$label), x$x, x$y, :
font family not found in Windows font database
Warning in grid.Call.graphics(C_text, as.graphicsAnnot(x$label), x$x, x$y, :
font family not found in Windows font database
Warning in grid.Call.graphics(C_text, as.graphicsAnnot(x$label), x$x, x$y, :
font family not found in Windows font database
Warning in grid.Call.graphics(C_text, as.graphicsAnnot(x$label), x$x, x$y, :
font family not found in Windows font database
Warning in grid.Call.graphics(C_text, as.graphicsAnnot(x$label), x$x, x$y, :
font family not found in Windows font databaseWarning in grid.Call(C_textBounds, as.graphicsAnnot(x$label), x$x, x$y, : font
family not found in Windows font databaseWarning in grid.Call.graphics(C_text, as.graphicsAnnot(x$label), x$x, x$y, :
font family not found in Windows font databaseWarning in grid.Call(C_textBounds, as.graphicsAnnot(x$label), x$x, x$y, : font
family not found in Windows font database
Warning in grid.Call(C_textBounds, as.graphicsAnnot(x$label), x$x, x$y, : font
family not found in Windows font database
Warning in grid.Call(C_textBounds, as.graphicsAnnot(x$label), x$x, x$y, : font
family not found in Windows font database
Warning in grid.Call(C_textBounds, as.graphicsAnnot(x$label), x$x, x$y, : font
family not found in Windows font database
Warning in grid.Call(C_textBounds, as.graphicsAnnot(x$label), x$x, x$y, : font
family not found in Windows font database
Warning in grid.Call(C_textBounds, as.graphicsAnnot(x$label), x$x, x$y, : font
family not found in Windows font database
Warning in grid.Call(C_textBounds, as.graphicsAnnot(x$label), x$x, x$y, : font
family not found in Windows font database
Warning in grid.Call(C_textBounds, as.graphicsAnnot(x$label), x$x, x$y, : font
family not found in Windows font database
Warning in grid.Call(C_textBounds, as.graphicsAnnot(x$label), x$x, x$y, : font
family not found in Windows font databaseWarning in grid.Call.graphics(C_text, as.graphicsAnnot(x$label), x$x, x$y, :
font family not found in Windows font database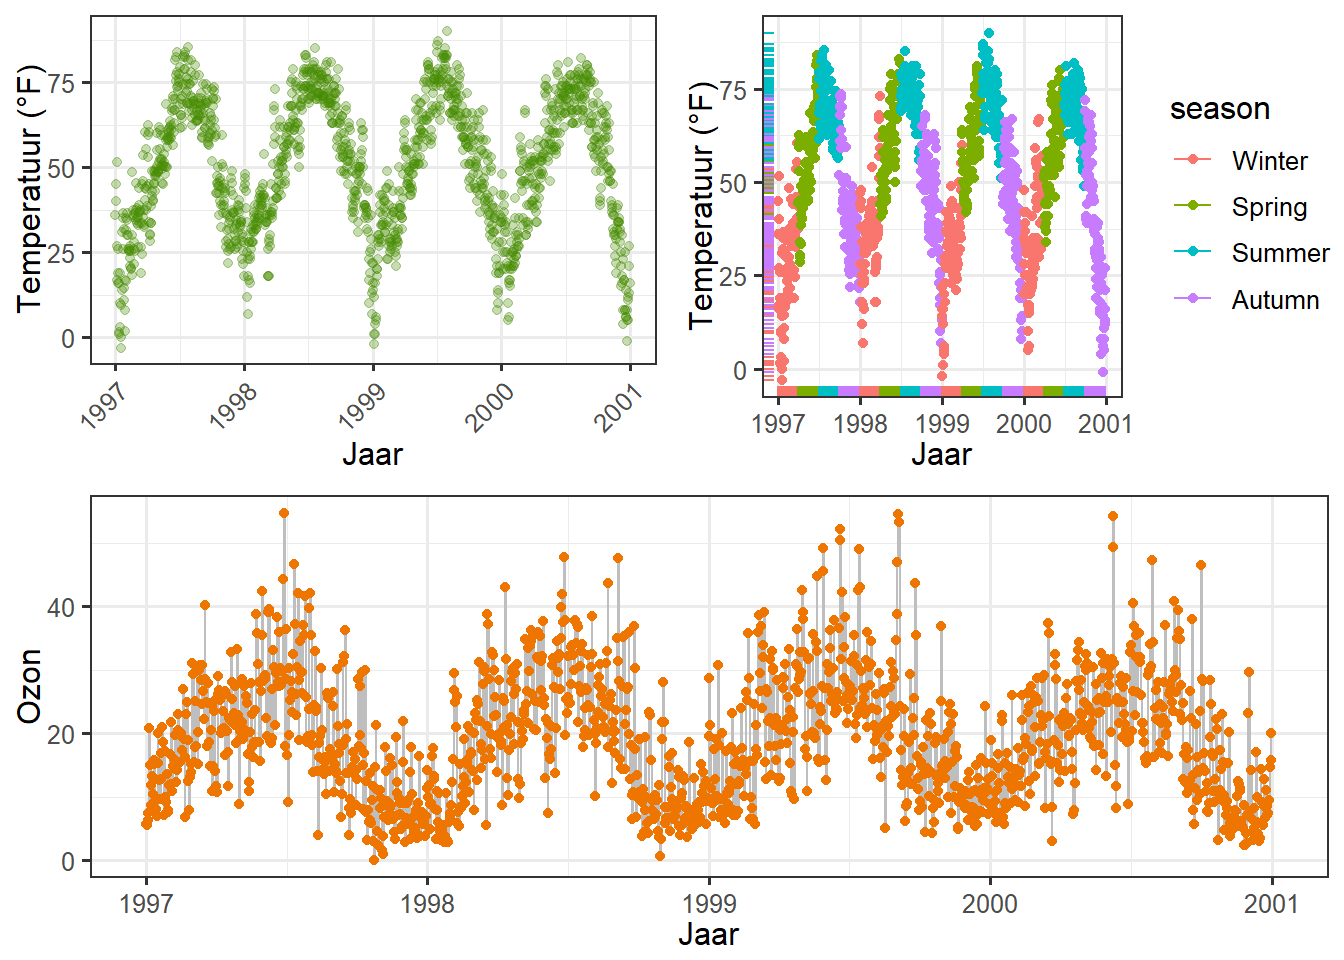
… en ook doet gridExtra package het goed:
library(gridExtra)
grid.arrange(g, p1, p2,
layout_matrix = rbind(c(1, 2), c(3, 3)))Warning in grid.Call(C_textBounds, as.graphicsAnnot(x$label), x$x, x$y, : font
family not found in Windows font database
Warning in grid.Call(C_textBounds, as.graphicsAnnot(x$label), x$x, x$y, : font
family not found in Windows font database
Warning in grid.Call(C_textBounds, as.graphicsAnnot(x$label), x$x, x$y, : font
family not found in Windows font database
Warning in grid.Call(C_textBounds, as.graphicsAnnot(x$label), x$x, x$y, : font
family not found in Windows font database
Warning in grid.Call(C_textBounds, as.graphicsAnnot(x$label), x$x, x$y, : font
family not found in Windows font database
Warning in grid.Call(C_textBounds, as.graphicsAnnot(x$label), x$x, x$y, : font
family not found in Windows font database
Warning in grid.Call(C_textBounds, as.graphicsAnnot(x$label), x$x, x$y, : font
family not found in Windows font database
Warning in grid.Call(C_textBounds, as.graphicsAnnot(x$label), x$x, x$y, : font
family not found in Windows font databaseWarning in grid.Call.graphics(C_text, as.graphicsAnnot(x$label), x$x, x$y, :
font family not found in Windows font database
Warning in grid.Call.graphics(C_text, as.graphicsAnnot(x$label), x$x, x$y, :
font family not found in Windows font database
Warning in grid.Call.graphics(C_text, as.graphicsAnnot(x$label), x$x, x$y, :
font family not found in Windows font database
Warning in grid.Call.graphics(C_text, as.graphicsAnnot(x$label), x$x, x$y, :
font family not found in Windows font database
Warning in grid.Call.graphics(C_text, as.graphicsAnnot(x$label), x$x, x$y, :
font family not found in Windows font database
Warning in grid.Call.graphics(C_text, as.graphicsAnnot(x$label), x$x, x$y, :
font family not found in Windows font database
Warning in grid.Call.graphics(C_text, as.graphicsAnnot(x$label), x$x, x$y, :
font family not found in Windows font database
Warning in grid.Call.graphics(C_text, as.graphicsAnnot(x$label), x$x, x$y, :
font family not found in Windows font database
Warning in grid.Call.graphics(C_text, as.graphicsAnnot(x$label), x$x, x$y, :
font family not found in Windows font databaseWarning in grid.Call(C_textBounds, as.graphicsAnnot(x$label), x$x, x$y, : font
family not found in Windows font databaseWarning in grid.Call.graphics(C_text, as.graphicsAnnot(x$label), x$x, x$y, :
font family not found in Windows font databaseWarning in grid.Call(C_textBounds, as.graphicsAnnot(x$label), x$x, x$y, : font
family not found in Windows font database
Warning in grid.Call(C_textBounds, as.graphicsAnnot(x$label), x$x, x$y, : font
family not found in Windows font database
Warning in grid.Call(C_textBounds, as.graphicsAnnot(x$label), x$x, x$y, : font
family not found in Windows font database
Warning in grid.Call(C_textBounds, as.graphicsAnnot(x$label), x$x, x$y, : font
family not found in Windows font database
Warning in grid.Call(C_textBounds, as.graphicsAnnot(x$label), x$x, x$y, : font
family not found in Windows font database
Warning in grid.Call(C_textBounds, as.graphicsAnnot(x$label), x$x, x$y, : font
family not found in Windows font database
Warning in grid.Call(C_textBounds, as.graphicsAnnot(x$label), x$x, x$y, : font
family not found in Windows font database
Warning in grid.Call(C_textBounds, as.graphicsAnnot(x$label), x$x, x$y, : font
family not found in Windows font database
Warning in grid.Call(C_textBounds, as.graphicsAnnot(x$label), x$x, x$y, : font
family not found in Windows font databaseWarning in grid.Call.graphics(C_text, as.graphicsAnnot(x$label), x$x, x$y, :
font family not found in Windows font database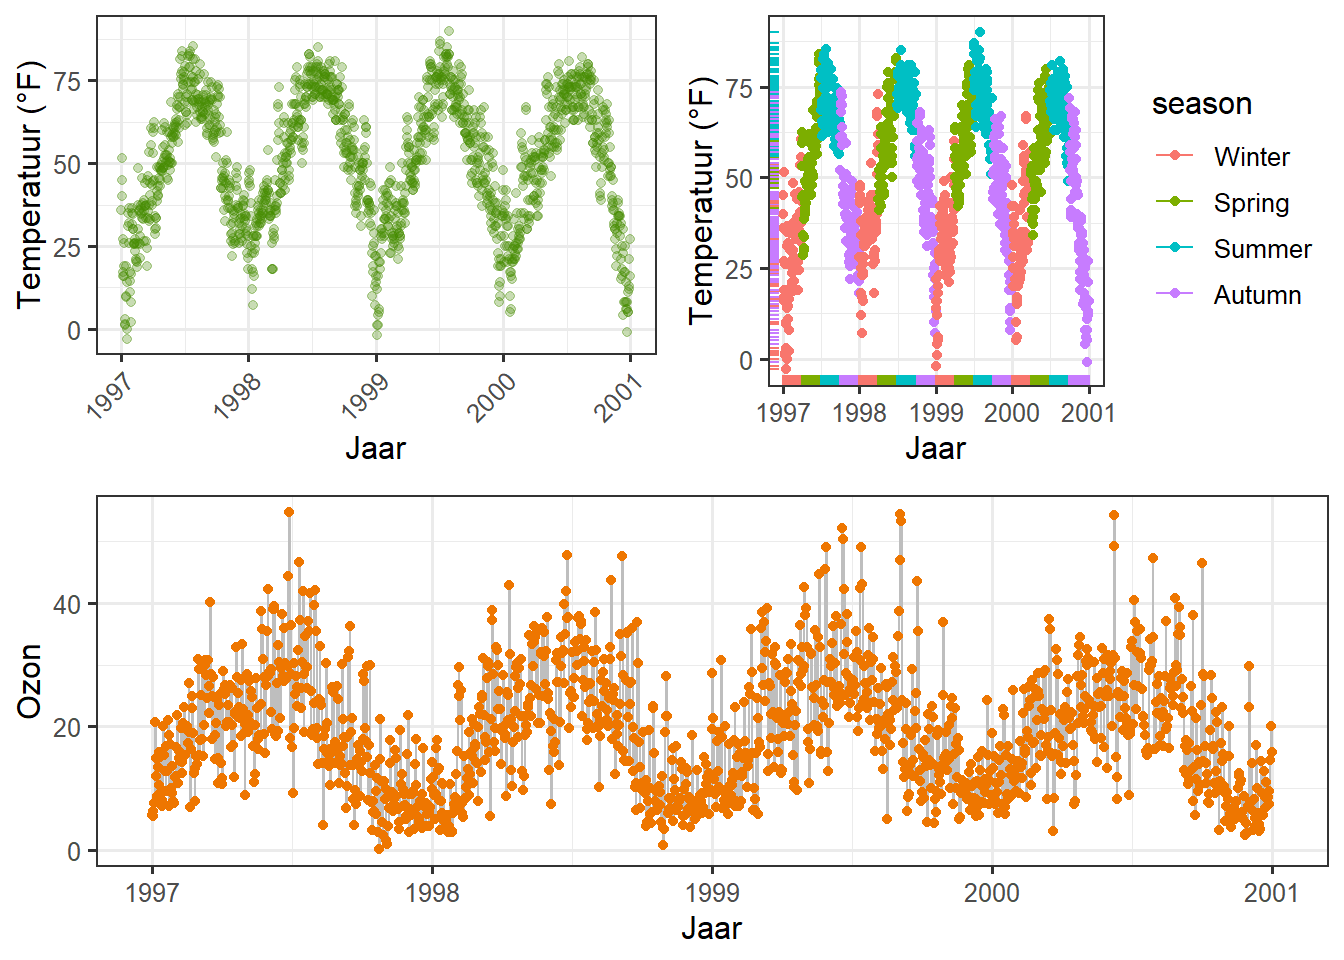
Hetzelfde idee van het definiëren van een lay-out kan worden gebruikt met patchwork, waarmee complexe composities kunnen worden gemaakt:
layout <- "
AABBBB#
AACCDDE
##CCDD#
##CC###
"
p2 + p1 + p1 + g + p2 +
plot_layout(design = layout)Warning in grid.Call(C_textBounds, as.graphicsAnnot(x$label), x$x, x$y, : font
family not found in Windows font database
Warning in grid.Call(C_textBounds, as.graphicsAnnot(x$label), x$x, x$y, : font
family not found in Windows font database

Warning in grid.Call(C_textBounds, as.graphicsAnnot(x$label), x$x, x$y, : font
family not found in Windows font database

Warning in grid.Call(C_textBounds, as.graphicsAnnot(x$label), x$x, x$y, : font
family not found in Windows font database

Warning in grid.Call(C_textBounds, as.graphicsAnnot(x$label), x$x, x$y, : font
family not found in Windows font database

Warning in grid.Call(C_textBounds, as.graphicsAnnot(x$label), x$x, x$y, : font
family not found in Windows font database

Warning in grid.Call(C_textBounds, as.graphicsAnnot(x$label), x$x, x$y, : font
family not found in Windows font database

Warning in grid.Call(C_textBounds, as.graphicsAnnot(x$label), x$x, x$y, : font
family not found in Windows font database

Warning in grid.Call(C_textBounds, as.graphicsAnnot(x$label), x$x, x$y, : font
family not found in Windows font database

Warning in grid.Call(C_textBounds, as.graphicsAnnot(x$label), x$x, x$y, : font
family not found in Windows font database

Warning in grid.Call(C_textBounds, as.graphicsAnnot(x$label), x$x, x$y, : font
family not found in Windows font database
Warning in grid.Call(C_textBounds, as.graphicsAnnot(x$label), x$x, x$y, : font
family not found in Windows font database
Warning in grid.Call(C_textBounds, as.graphicsAnnot(x$label), x$x, x$y, : font
family not found in Windows font database
Warning in grid.Call(C_textBounds, as.graphicsAnnot(x$label), x$x, x$y, : font
family not found in Windows font database
Warning in grid.Call(C_textBounds, as.graphicsAnnot(x$label), x$x, x$y, : font
family not found in Windows font database
Warning in grid.Call(C_textBounds, as.graphicsAnnot(x$label), x$x, x$y, : font
family not found in Windows font database
Warning in grid.Call(C_textBounds, as.graphicsAnnot(x$label), x$x, x$y, : font
family not found in Windows font databaseWarning in grid.Call.graphics(C_text, as.graphicsAnnot(x$label), x$x, x$y, :
font family not found in Windows font databaseWarning in grid.Call(C_textBounds, as.graphicsAnnot(x$label), x$x, x$y, : font
family not found in Windows font database
Warning in grid.Call(C_textBounds, as.graphicsAnnot(x$label), x$x, x$y, : font
family not found in Windows font database
Warning in grid.Call(C_textBounds, as.graphicsAnnot(x$label), x$x, x$y, : font
family not found in Windows font databaseWarning in grid.Call.graphics(C_text, as.graphicsAnnot(x$label), x$x, x$y, :
font family not found in Windows font databaseWarning in grid.Call(C_textBounds, as.graphicsAnnot(x$label), x$x, x$y, : font
family not found in Windows font database
Warning in grid.Call(C_textBounds, as.graphicsAnnot(x$label), x$x, x$y, : font
family not found in Windows font databaseWarning in grid.Call.graphics(C_text, as.graphicsAnnot(x$label), x$x, x$y, :
font family not found in Windows font database
Warning in grid.Call.graphics(C_text, as.graphicsAnnot(x$label), x$x, x$y, :
font family not found in Windows font database
Warning in grid.Call.graphics(C_text, as.graphicsAnnot(x$label), x$x, x$y, :
font family not found in Windows font database
Warning in grid.Call.graphics(C_text, as.graphicsAnnot(x$label), x$x, x$y, :
font family not found in Windows font database
Warning in grid.Call.graphics(C_text, as.graphicsAnnot(x$label), x$x, x$y, :
font family not found in Windows font database
Warning in grid.Call.graphics(C_text, as.graphicsAnnot(x$label), x$x, x$y, :
font family not found in Windows font database
Warning in grid.Call.graphics(C_text, as.graphicsAnnot(x$label), x$x, x$y, :
font family not found in Windows font database
Warning in grid.Call.graphics(C_text, as.graphicsAnnot(x$label), x$x, x$y, :
font family not found in Windows font database
Warning in grid.Call.graphics(C_text, as.graphicsAnnot(x$label), x$x, x$y, :
font family not found in Windows font databaseWarning in grid.Call(C_textBounds, as.graphicsAnnot(x$label), x$x, x$y, : font
family not found in Windows font databaseWarning in grid.Call.graphics(C_text, as.graphicsAnnot(x$label), x$x, x$y, :
font family not found in Windows font databaseWarning in grid.Call(C_textBounds, as.graphicsAnnot(x$label), x$x, x$y, : font
family not found in Windows font database
Warning in grid.Call(C_textBounds, as.graphicsAnnot(x$label), x$x, x$y, : font
family not found in Windows font databaseWarning in grid.Call.graphics(C_text, as.graphicsAnnot(x$label), x$x, x$y, :
font family not found in Windows font database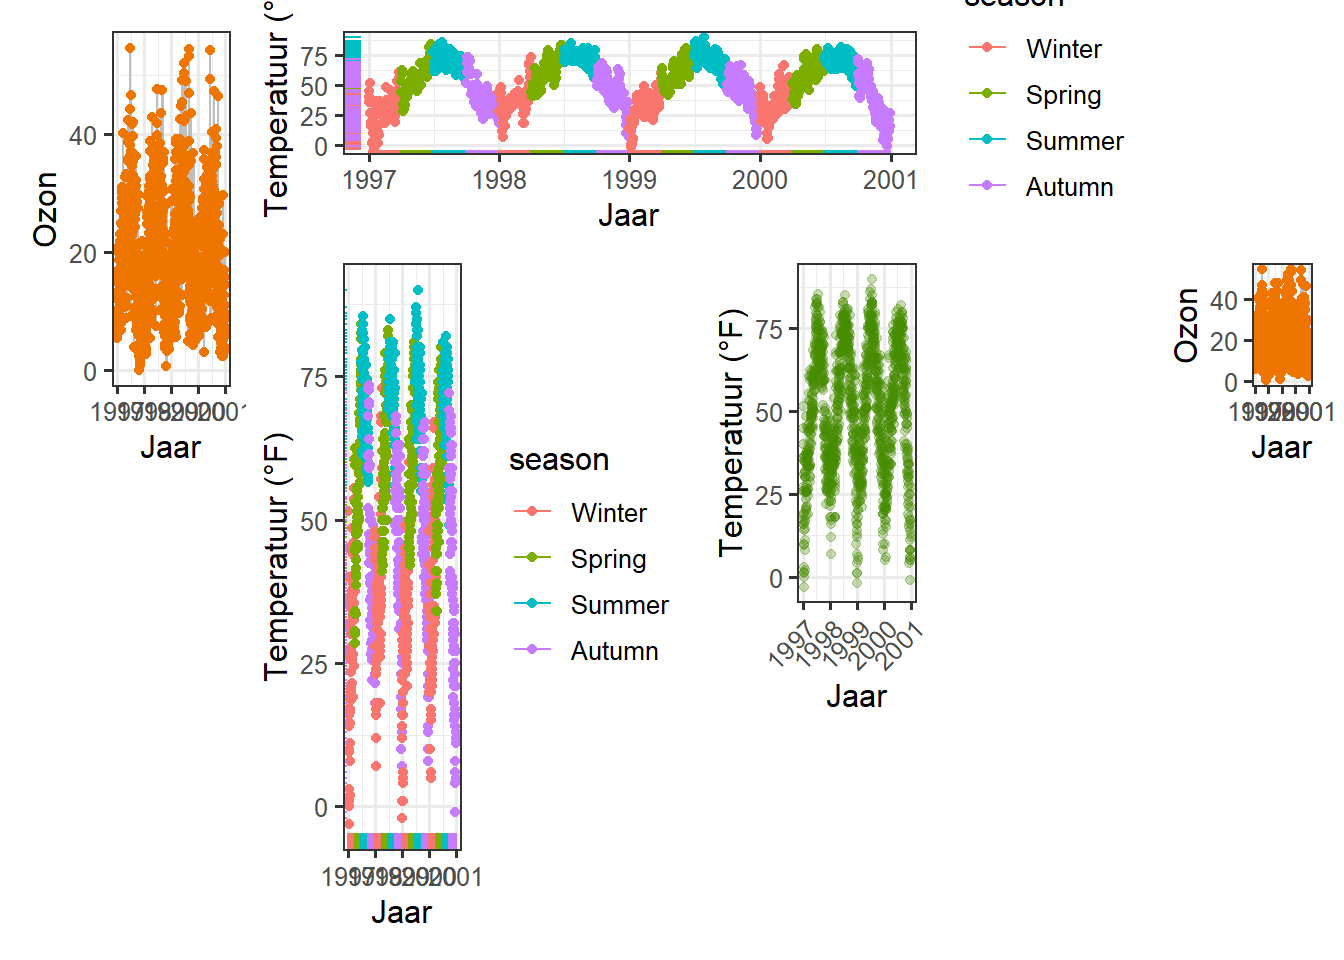
Werken met kleuren
Voor eenvoudige toepassingen is het werken met kleuren in ggplot2 rechttoe rechtaan. Voor een meer gevorderde behandeling van het onderwerp moet je waarschijnlijk Hadley’s boek aanschaffen, dat een goede dekking heeft. Andere goede bronnen zijn het R Cookbook en de `color sectie in de R Graph Gallery door Yan Holtz.
Er zijn twee belangrijke verschillen als het gaat om kleuren in ggplot2. Beide argumenten, color en fill, kunnen
- gespecificeerd als enkele kleur of
- toegekend aan variabelen.
Zoals je in het begin van deze tutorial al hebt gezien, worden variabelen die binnen de aesthetiek vallen gecodeerd door variabelen en die erbuiten vallen zijn eigenschappen die niets met de variabelen te maken hebben. Deze complete nonsens plot met het aantal records per jaar en seizoen illustreert dat feit:
ggplot(chic, aes(year)) +
geom_bar(aes(fill = season), color = "grey", size = 2) +
labs(x = "Jaar", y = "Observaties", fill = "Seizoen:")Warning in grid.Call(C_textBounds, as.graphicsAnnot(x$label), x$x, x$y, : font
family not found in Windows font database
Warning in grid.Call(C_textBounds, as.graphicsAnnot(x$label), x$x, x$y, : font
family not found in Windows font database
Warning in grid.Call(C_textBounds, as.graphicsAnnot(x$label), x$x, x$y, : font
family not found in Windows font database
Warning in grid.Call(C_textBounds, as.graphicsAnnot(x$label), x$x, x$y, : font
family not found in Windows font database
Warning in grid.Call(C_textBounds, as.graphicsAnnot(x$label), x$x, x$y, : font
family not found in Windows font database
Warning in grid.Call(C_textBounds, as.graphicsAnnot(x$label), x$x, x$y, : font
family not found in Windows font database
Warning in grid.Call(C_textBounds, as.graphicsAnnot(x$label), x$x, x$y, : font
family not found in Windows font database
Warning in grid.Call(C_textBounds, as.graphicsAnnot(x$label), x$x, x$y, : font
family not found in Windows font database
Warning in grid.Call(C_textBounds, as.graphicsAnnot(x$label), x$x, x$y, : font
family not found in Windows font databaseWarning in grid.Call.graphics(C_text, as.graphicsAnnot(x$label), x$x, x$y, :
font family not found in Windows font databaseWarning in grid.Call(C_textBounds, as.graphicsAnnot(x$label), x$x, x$y, : font
family not found in Windows font database
Warning in grid.Call(C_textBounds, as.graphicsAnnot(x$label), x$x, x$y, : font
family not found in Windows font database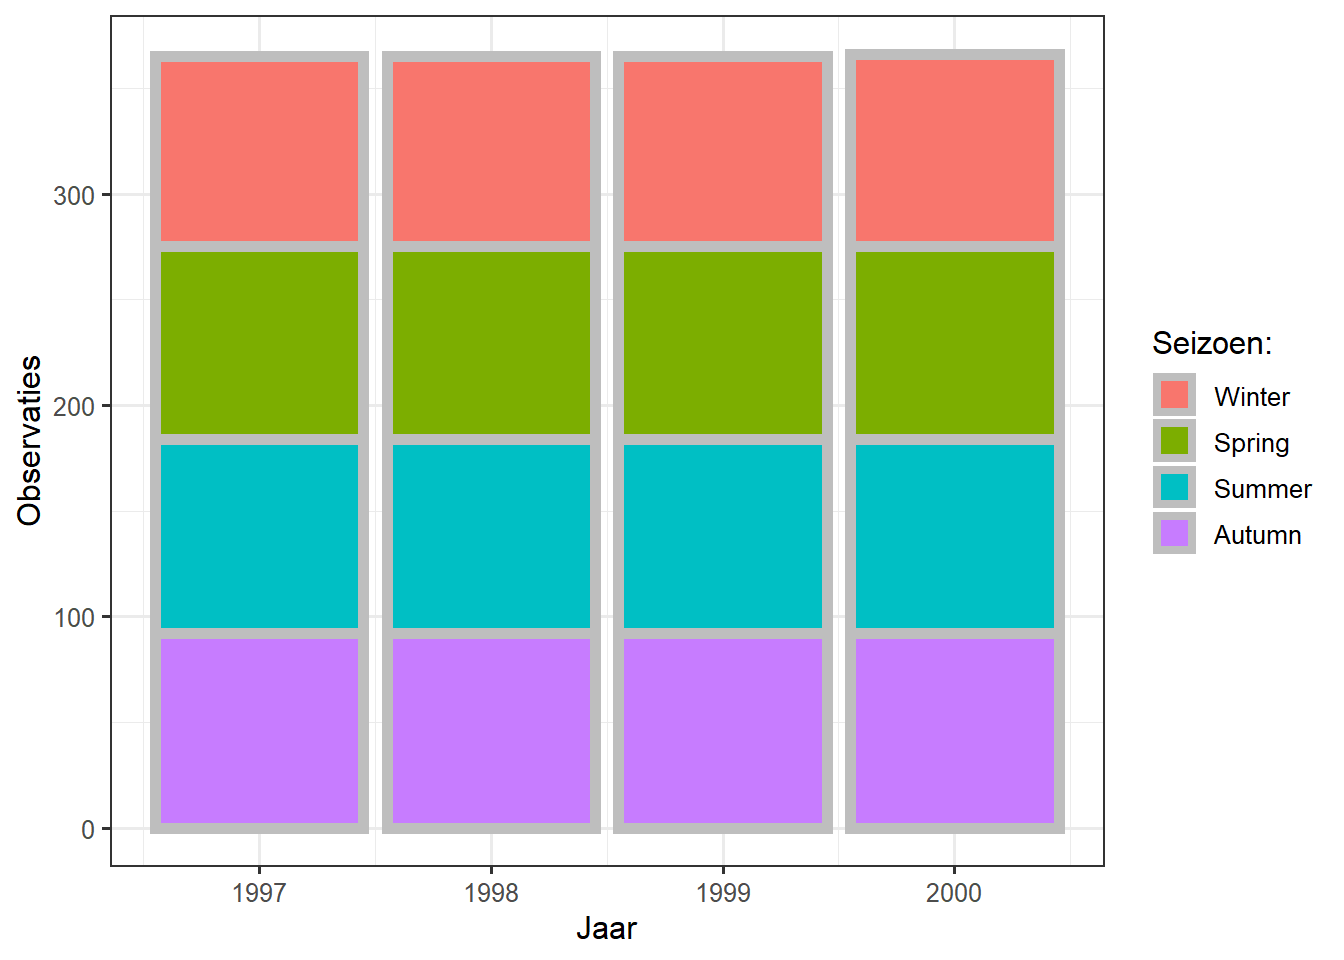
Afzonderlijke kleuren specificeren
Statische, enkele kleuren zijn eenvoudig te gebruiken. We kunnen een enkele kleur specificeren voor een geom:
ggplot(chic, aes(x = date, y = temp)) +
geom_point(color = "steelblue", size = 2) +
labs(x = "Jaar", y = "Temperatuur (°F)")Warning in grid.Call(C_textBounds, as.graphicsAnnot(x$label), x$x, x$y, : font
family not found in Windows font database
Warning in grid.Call(C_textBounds, as.graphicsAnnot(x$label), x$x, x$y, : font
family not found in Windows font database
Warning in grid.Call(C_textBounds, as.graphicsAnnot(x$label), x$x, x$y, : font
family not found in Windows font database
Warning in grid.Call(C_textBounds, as.graphicsAnnot(x$label), x$x, x$y, : font
family not found in Windows font database
Warning in grid.Call(C_textBounds, as.graphicsAnnot(x$label), x$x, x$y, : font
family not found in Windows font database
Warning in grid.Call(C_textBounds, as.graphicsAnnot(x$label), x$x, x$y, : font
family not found in Windows font database
Warning in grid.Call(C_textBounds, as.graphicsAnnot(x$label), x$x, x$y, : font
family not found in Windows font databaseWarning in grid.Call.graphics(C_text, as.graphicsAnnot(x$label), x$x, x$y, :
font family not found in Windows font database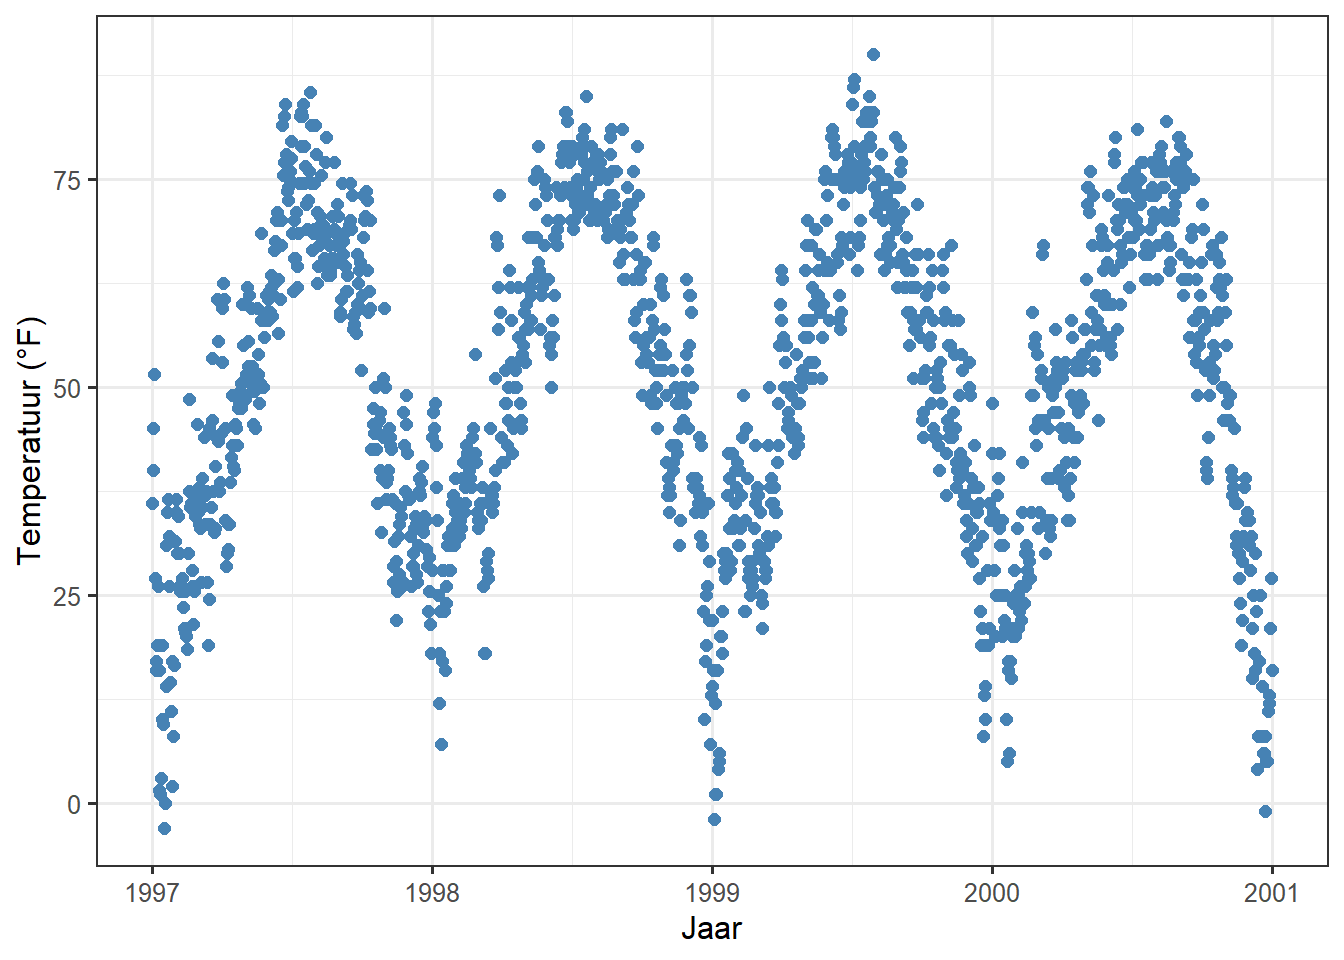
… en in het geval dat het beide biedt, een color (omtrekkleur) en een fill (vulkleur):
ggplot(chic, aes(x = date, y = temp)) +
geom_point(shape = 21, size = 2, stroke = 1,
color = "#3cc08f", fill = "#c08f3c") +
labs(x = "Jaar", y = "Temperatuur (°F)")Warning in grid.Call(C_textBounds, as.graphicsAnnot(x$label), x$x, x$y, : font
family not found in Windows font database
Warning in grid.Call(C_textBounds, as.graphicsAnnot(x$label), x$x, x$y, : font
family not found in Windows font database
Warning in grid.Call(C_textBounds, as.graphicsAnnot(x$label), x$x, x$y, : font
family not found in Windows font database
Warning in grid.Call(C_textBounds, as.graphicsAnnot(x$label), x$x, x$y, : font
family not found in Windows font database
Warning in grid.Call(C_textBounds, as.graphicsAnnot(x$label), x$x, x$y, : font
family not found in Windows font database
Warning in grid.Call(C_textBounds, as.graphicsAnnot(x$label), x$x, x$y, : font
family not found in Windows font database
Warning in grid.Call(C_textBounds, as.graphicsAnnot(x$label), x$x, x$y, : font
family not found in Windows font databaseWarning in grid.Call.graphics(C_text, as.graphicsAnnot(x$label), x$x, x$y, :
font family not found in Windows font database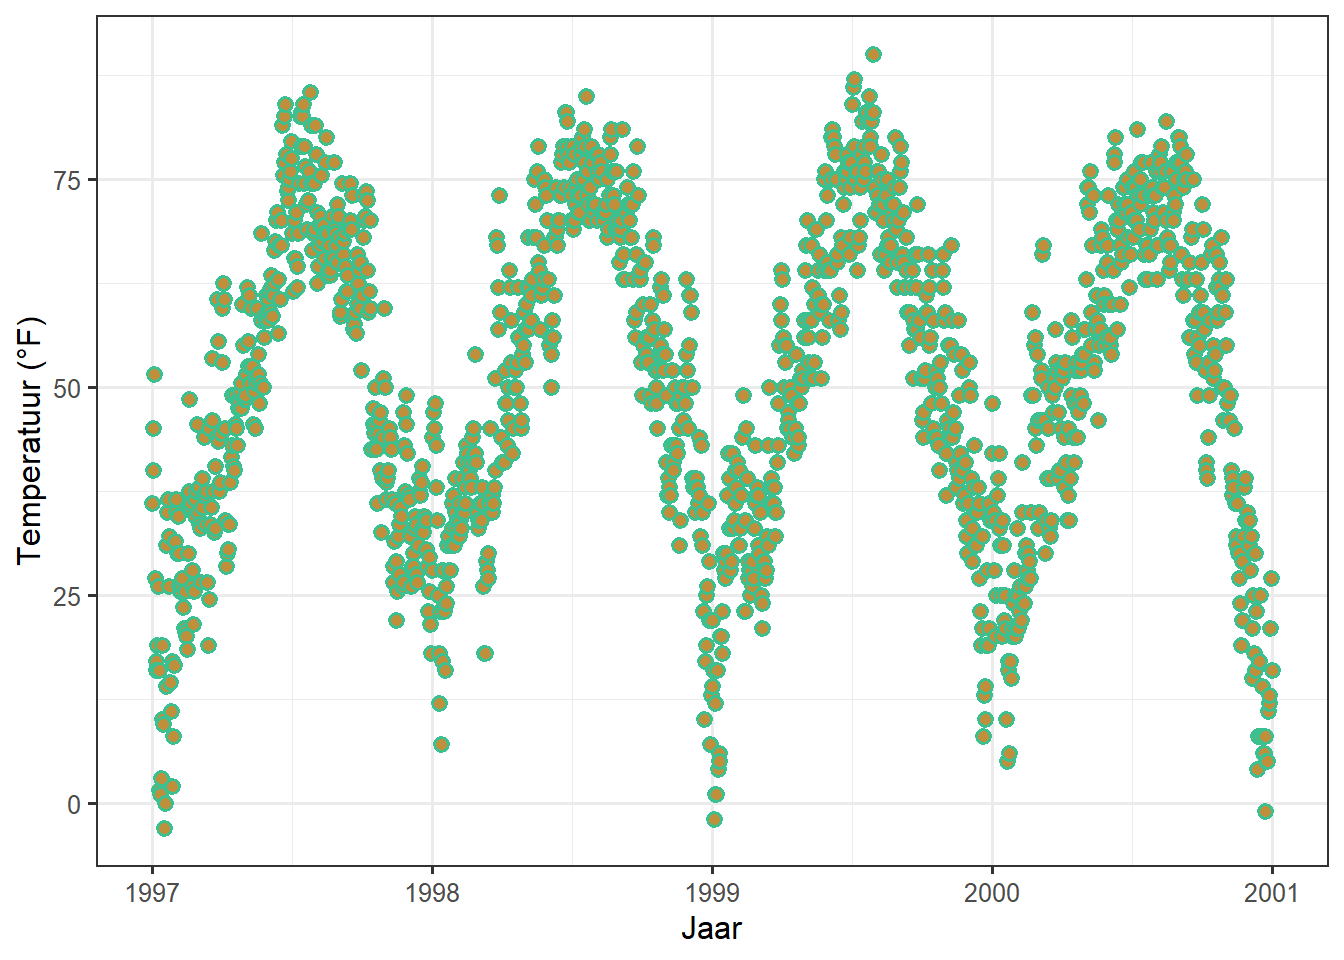
Tian Zheng van Columbia heeft een handige [PDF van R kleuren] gemaakt (http://www.stat.columbia.edu/~tzheng/files/Rcolor.pdf). Natuurlijk kun je ook hex kleurcodes opgeven (gewoon als strings zoals in het voorbeeld hierboven), maar ook RGB of RGBA waarden (via de rgb() functie: rgb(red, green, blue, alpha)).
Kleuren toewijzen aan variabelen
In ggplot2 worden kleuren die aan variabelen zijn toegekend, gewijzigd via de functies scale_color_* en scale_fill_*. Om kleuren te gebruiken met uw gegevens, moet u vooral weten of u te maken heeft met een categorische of continue variabele. Het kleurenpalet moet worden gekozen afhankelijk van het type variabele, waarbij sequentiële of divergerende kleurenpaletten worden gebruikt voor continue variabelen en kwalitatieve kleurenpaletten voor categorische variabelen:
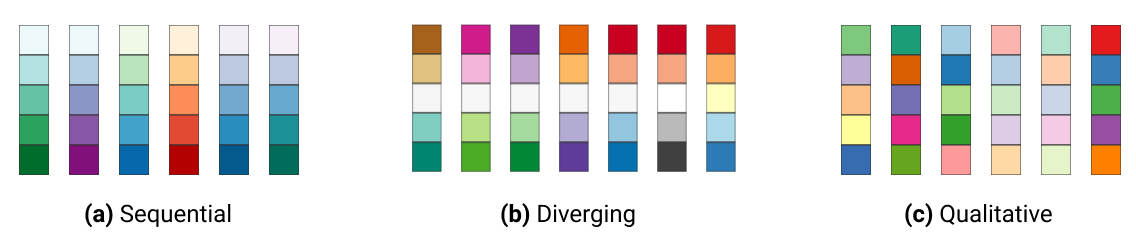
Kwalitatieve variabelen
Kwalitatieve of categorische variabelen staan voor soorten gegevens die in groepen (categorieën) kunnen worden ingedeeld. De variabele kan verder worden gespecificeerd als nominaal, ordinaal, en binair (dichotomisch). Voorbeelden van kwalitatieve/categorische variabelen zijn:

Het standaard categorisch kleurenpalet ziet er als volgt uit:
(ga <- ggplot(chic, aes(x = date, y = temp, color = season)) +
geom_point() +
labs(x = "Jaar", y = "Temperatuur (°F)", color = NULL))Warning in grid.Call(C_textBounds, as.graphicsAnnot(x$label), x$x, x$y, : font
family not found in Windows font database
Warning in grid.Call(C_textBounds, as.graphicsAnnot(x$label), x$x, x$y, : font
family not found in Windows font database
Warning in grid.Call(C_textBounds, as.graphicsAnnot(x$label), x$x, x$y, : font
family not found in Windows font database
Warning in grid.Call(C_textBounds, as.graphicsAnnot(x$label), x$x, x$y, : font
family not found in Windows font database
Warning in grid.Call(C_textBounds, as.graphicsAnnot(x$label), x$x, x$y, : font
family not found in Windows font database
Warning in grid.Call(C_textBounds, as.graphicsAnnot(x$label), x$x, x$y, : font
family not found in Windows font database
Warning in grid.Call(C_textBounds, as.graphicsAnnot(x$label), x$x, x$y, : font
family not found in Windows font database
Warning in grid.Call(C_textBounds, as.graphicsAnnot(x$label), x$x, x$y, : font
family not found in Windows font databaseWarning in grid.Call.graphics(C_text, as.graphicsAnnot(x$label), x$x, x$y, :
font family not found in Windows font databaseWarning in grid.Call(C_textBounds, as.graphicsAnnot(x$label), x$x, x$y, : font
family not found in Windows font database
Handmatig kwalitatieve kleuren kiezen
Je kunt je eigen set kleuren kiezen en ze toewijzen aan een categorische variabele via de functie scale_*_manual() (de * kan color, colour, of fill zijn). Het aantal gespecificeerde kleuren moet overeenkomen met het aantal categorieën:
ga + scale_color_manual(values = c("dodgerblue4",
"darkolivegreen4",
"darkorchid3",
"goldenrod1"))Warning in grid.Call(C_textBounds, as.graphicsAnnot(x$label), x$x, x$y, : font
family not found in Windows font database
Warning in grid.Call(C_textBounds, as.graphicsAnnot(x$label), x$x, x$y, : font
family not found in Windows font database
Warning in grid.Call(C_textBounds, as.graphicsAnnot(x$label), x$x, x$y, : font
family not found in Windows font database
Warning in grid.Call(C_textBounds, as.graphicsAnnot(x$label), x$x, x$y, : font
family not found in Windows font database
Warning in grid.Call(C_textBounds, as.graphicsAnnot(x$label), x$x, x$y, : font
family not found in Windows font database
Warning in grid.Call(C_textBounds, as.graphicsAnnot(x$label), x$x, x$y, : font
family not found in Windows font database
Warning in grid.Call(C_textBounds, as.graphicsAnnot(x$label), x$x, x$y, : font
family not found in Windows font database
Warning in grid.Call(C_textBounds, as.graphicsAnnot(x$label), x$x, x$y, : font
family not found in Windows font databaseWarning in grid.Call.graphics(C_text, as.graphicsAnnot(x$label), x$x, x$y, :
font family not found in Windows font databaseWarning in grid.Call(C_textBounds, as.graphicsAnnot(x$label), x$x, x$y, : font
family not found in Windows font database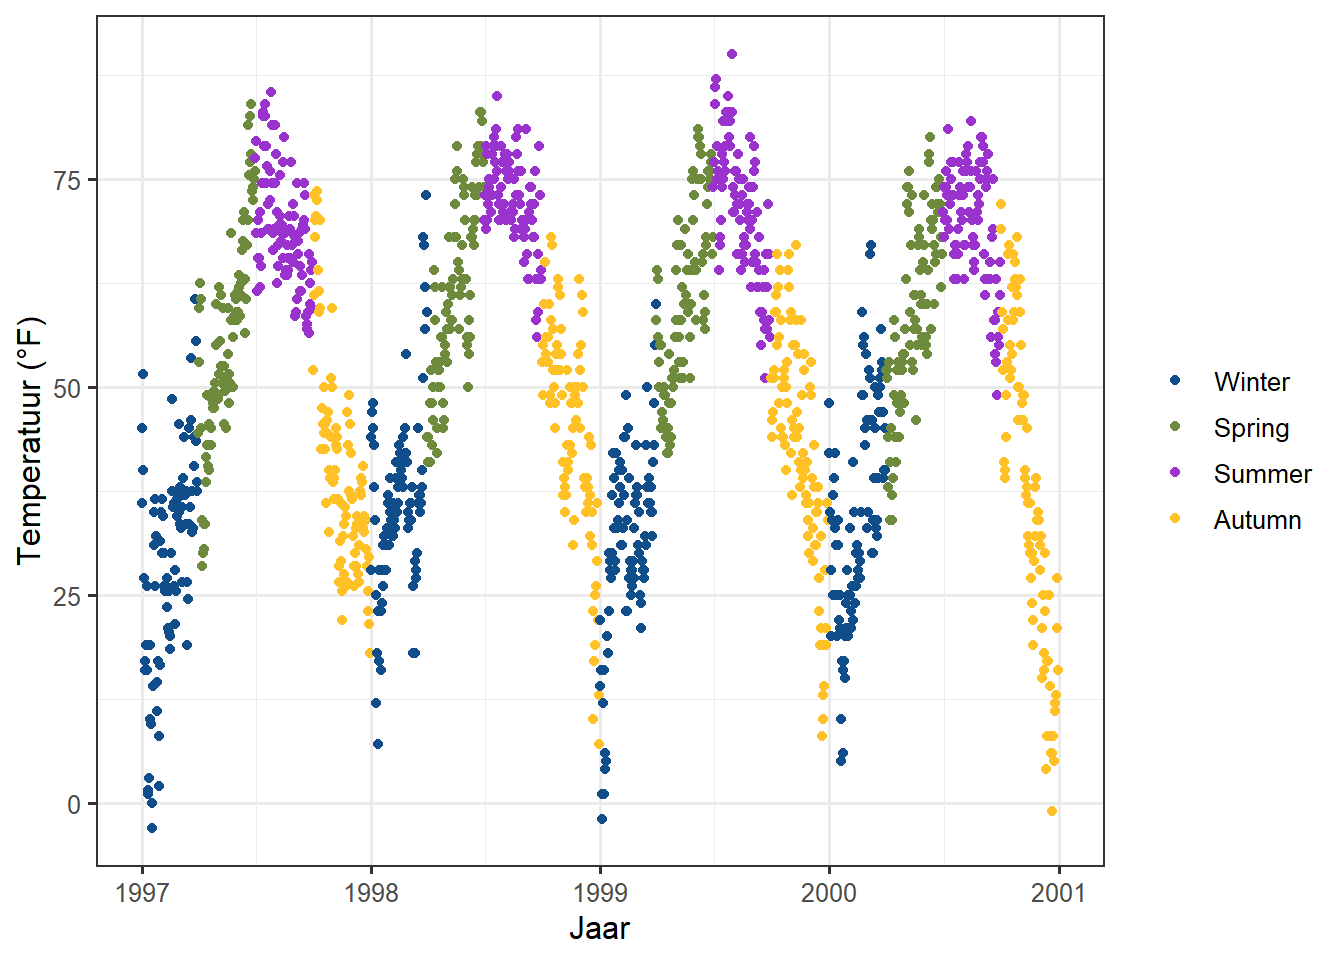
Gebruik Ingebouwde Kwalitatieve Kleurenpaletten
De ColorBrewer palettes is een populair online hulpmiddel voor het selecteren van kleurenschema’s voor kaarten. De verschillende kleurensets zijn ontworpen om aantrekkelijke kleurenschema’s te maken met een gelijkaardig uitzicht, variërend van drie tot twaalf. Deze paletten zijn beschikbaar als ingebouwde functies in het ggplot2 pakket en kunnen worden toegepast door scale_*_brewer() aan te roepen:
ga + scale_color_brewer(palette = "Set1")Warning in grid.Call(C_textBounds, as.graphicsAnnot(x$label), x$x, x$y, : font
family not found in Windows font database
Warning in grid.Call(C_textBounds, as.graphicsAnnot(x$label), x$x, x$y, : font
family not found in Windows font database
Warning in grid.Call(C_textBounds, as.graphicsAnnot(x$label), x$x, x$y, : font
family not found in Windows font database
Warning in grid.Call(C_textBounds, as.graphicsAnnot(x$label), x$x, x$y, : font
family not found in Windows font database
Warning in grid.Call(C_textBounds, as.graphicsAnnot(x$label), x$x, x$y, : font
family not found in Windows font database
Warning in grid.Call(C_textBounds, as.graphicsAnnot(x$label), x$x, x$y, : font
family not found in Windows font database
Warning in grid.Call(C_textBounds, as.graphicsAnnot(x$label), x$x, x$y, : font
family not found in Windows font database
Warning in grid.Call(C_textBounds, as.graphicsAnnot(x$label), x$x, x$y, : font
family not found in Windows font databaseWarning in grid.Call.graphics(C_text, as.graphicsAnnot(x$label), x$x, x$y, :
font family not found in Windows font databaseWarning in grid.Call(C_textBounds, as.graphicsAnnot(x$label), x$x, x$y, : font
family not found in Windows font database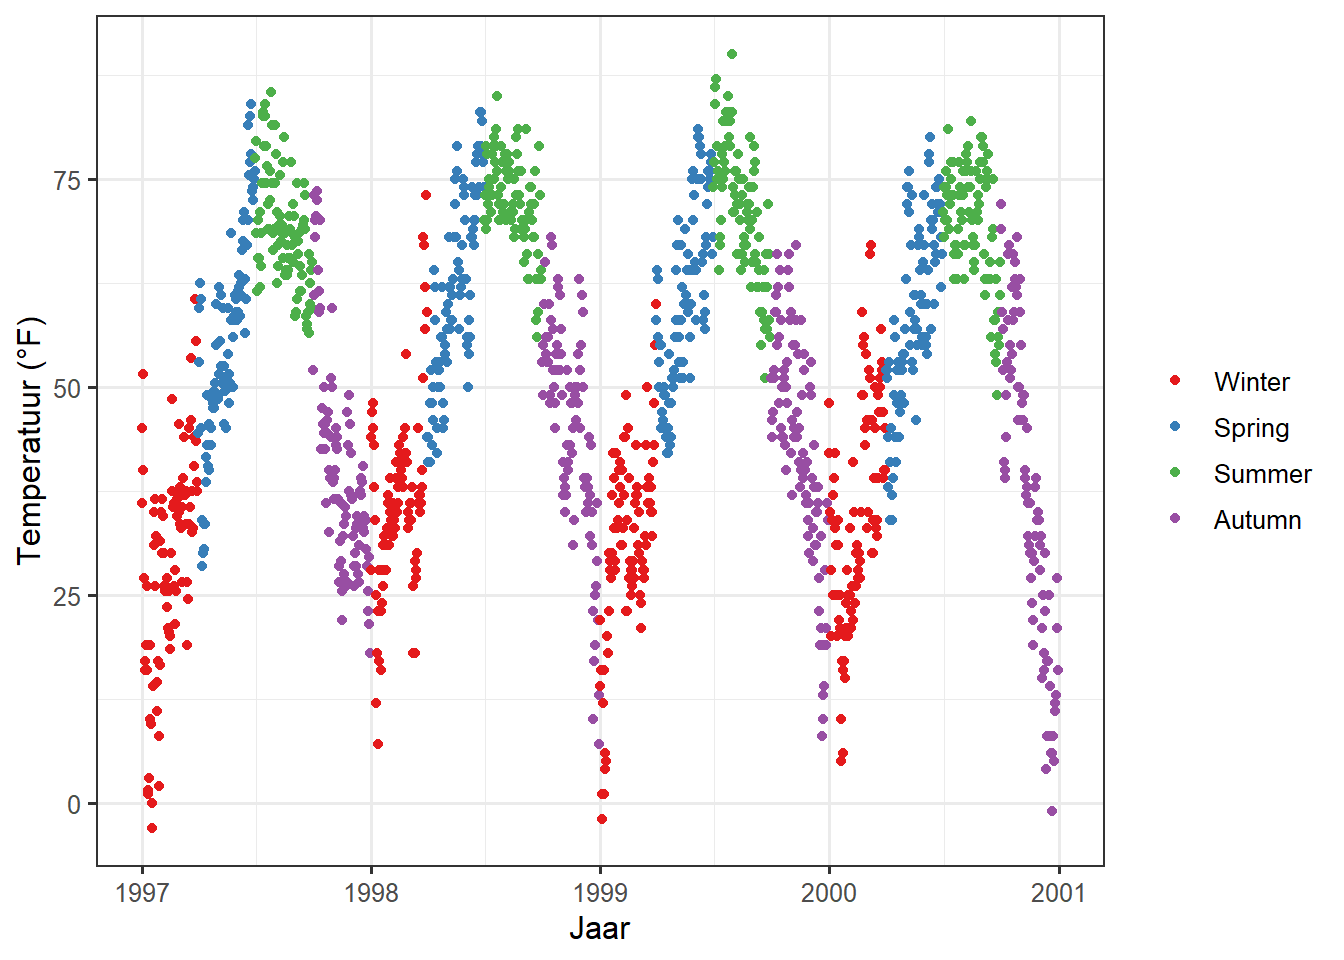
Je kunt alle beschikbare kleurenpaletten bekijken via
RColorBrewer::display.brewer.all().
Er zijn veel uitbreidingspakketten die extra kleurpaletten bieden. Het gebruik ervan verschilt afhankelijk van de manier waarop het pakket is ontworpen. Voor een uitgebreid overzicht van kleurenpaletten die in R beschikbaar zijn, zie de collection provided by Emil Hvitfeldt. Men kan ook zijn paletteer package gebruiken, een uitgebreide verzameling van kleurenpaletten in R die een consistente syntax gebruikt.
Voorbeelden:
Het ggthemes package bijvoorbeeld geeft R gebruikers toegang tot de Tableau kleuren. Tableau is een beroemde visualisatie software met een bekend kleuren palet.
library(ggthemes)
ga + scale_color_tableau()Warning in grid.Call(C_textBounds, as.graphicsAnnot(x$label), x$x, x$y, : font
family not found in Windows font database
Warning in grid.Call(C_textBounds, as.graphicsAnnot(x$label), x$x, x$y, : font
family not found in Windows font database
Warning in grid.Call(C_textBounds, as.graphicsAnnot(x$label), x$x, x$y, : font
family not found in Windows font database
Warning in grid.Call(C_textBounds, as.graphicsAnnot(x$label), x$x, x$y, : font
family not found in Windows font database
Warning in grid.Call(C_textBounds, as.graphicsAnnot(x$label), x$x, x$y, : font
family not found in Windows font database
Warning in grid.Call(C_textBounds, as.graphicsAnnot(x$label), x$x, x$y, : font
family not found in Windows font database
Warning in grid.Call(C_textBounds, as.graphicsAnnot(x$label), x$x, x$y, : font
family not found in Windows font database
Warning in grid.Call(C_textBounds, as.graphicsAnnot(x$label), x$x, x$y, : font
family not found in Windows font databaseWarning in grid.Call.graphics(C_text, as.graphicsAnnot(x$label), x$x, x$y, :
font family not found in Windows font databaseWarning in grid.Call(C_textBounds, as.graphicsAnnot(x$label), x$x, x$y, : font
family not found in Windows font database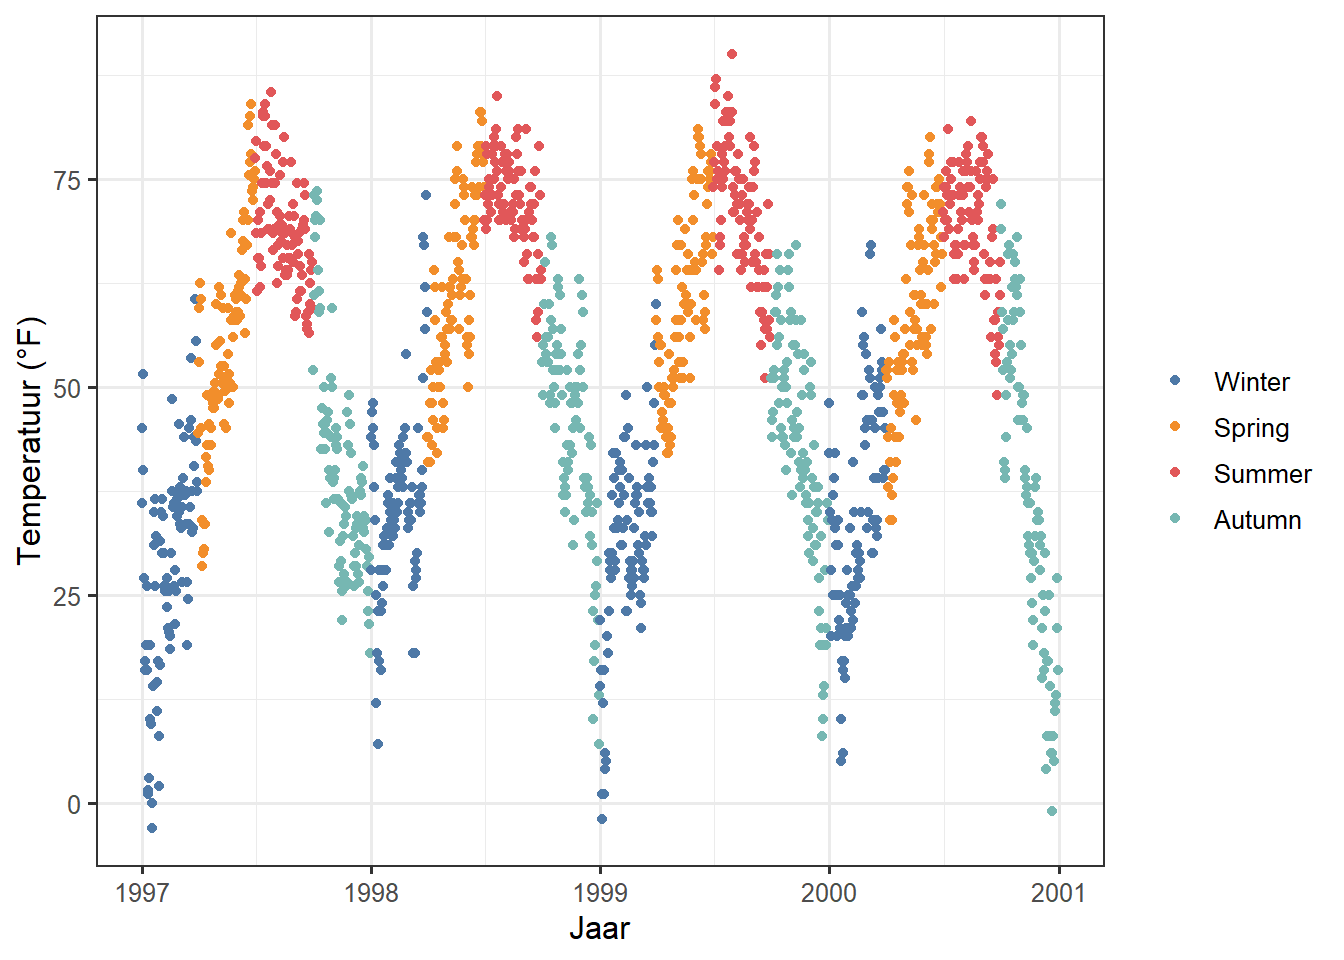
Het ggsci package biedt kleurenpaletten voor wetenschappelijke tijdschriften en sci-fi thema’s. Wil je een plot met kleuren die eruit zien alsof ze gepubliceerd zijn in Science of Nature? Hier ga je!
library(ggsci)
g1 <- ga + scale_color_aaas()
g2 <- ga + scale_color_npg()
library(patchwork)
(g1 + g2) * theme(legend.position = "top")Warning in grid.Call(C_textBounds, as.graphicsAnnot(x$label), x$x, x$y, : font
family not found in Windows font database
Warning in grid.Call(C_textBounds, as.graphicsAnnot(x$label), x$x, x$y, : font
family not found in Windows font database
Warning in grid.Call(C_textBounds, as.graphicsAnnot(x$label), x$x, x$y, : font
family not found in Windows font database
Warning in grid.Call(C_textBounds, as.graphicsAnnot(x$label), x$x, x$y, : font
family not found in Windows font database
Warning in grid.Call(C_textBounds, as.graphicsAnnot(x$label), x$x, x$y, : font
family not found in Windows font database
Warning in grid.Call(C_textBounds, as.graphicsAnnot(x$label), x$x, x$y, : font
family not found in Windows font database
Warning in grid.Call(C_textBounds, as.graphicsAnnot(x$label), x$x, x$y, : font
family not found in Windows font database
Warning in grid.Call(C_textBounds, as.graphicsAnnot(x$label), x$x, x$y, : font
family not found in Windows font databaseWarning in grid.Call.graphics(C_text, as.graphicsAnnot(x$label), x$x, x$y, :
font family not found in Windows font databaseWarning in grid.Call(C_textBounds, as.graphicsAnnot(x$label), x$x, x$y, : font
family not found in Windows font database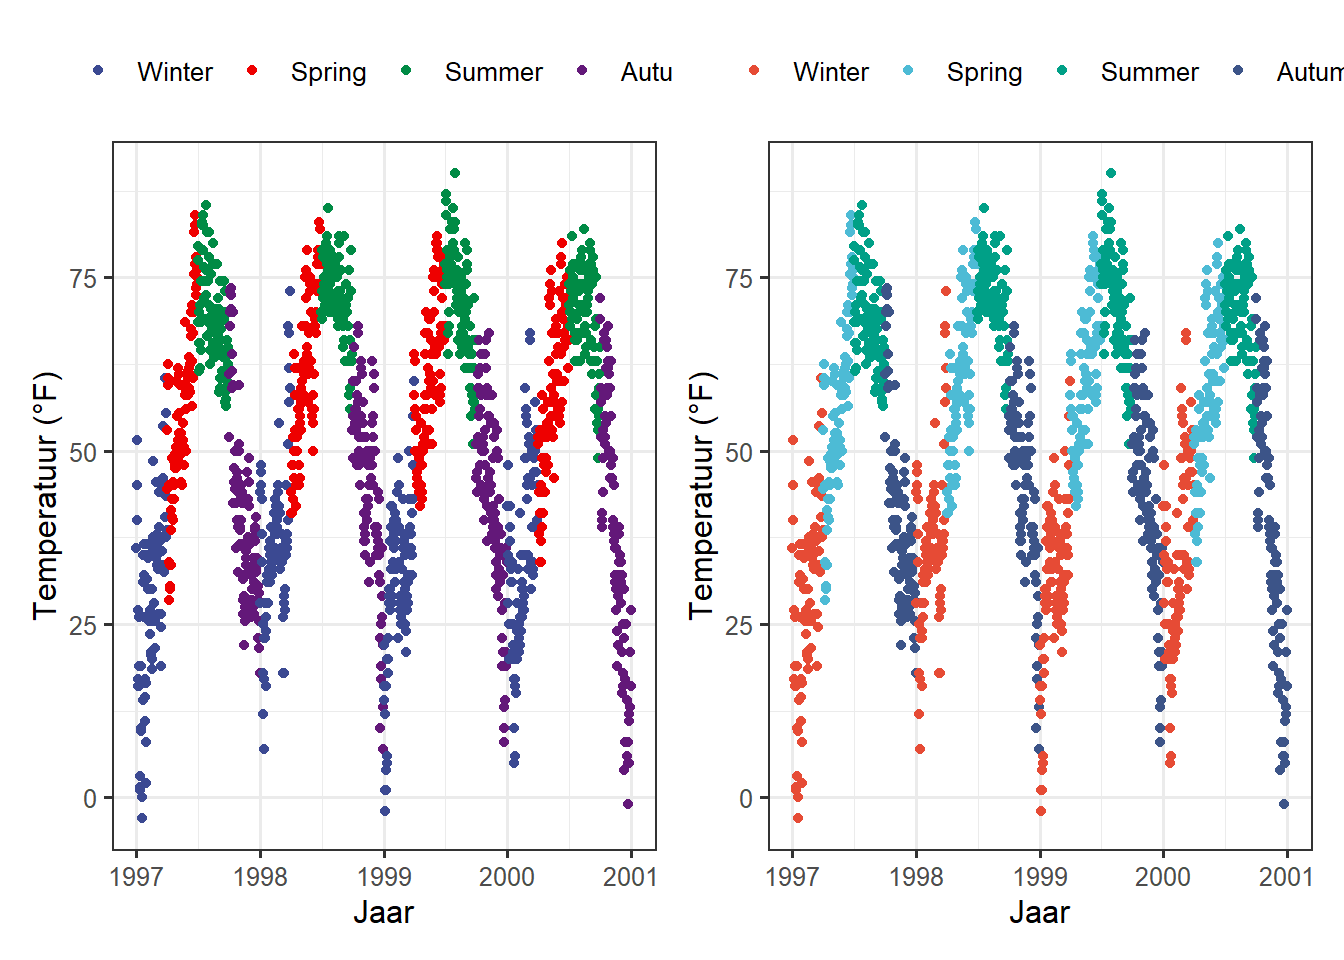
Kwantitatieve variabelen
Kwantitatieve variabelen vertegenwoordigen een meetbare grootheid en zijn dus numeriek. Kwantitatieve gegevens kunnen verder worden ingedeeld in continue of discrete gegevens:

In ons voorbeeld veranderen we de variabele die we willen kleuren in ozon, een continue variabele die sterk gerelateerd is aan temperatuur (hogere temperatuur = hogere ozon). De functie scale_*_gradient() is een sequentiële gradiënt terwijl scale_*_gradient2() divergerend is.
Hier is het standaard ggplot2 sequentieel kleurenschema voor continue variabelen:
gb <- ggplot(chic, aes(x = date, y = temp, color = temp)) +
geom_point() +
labs(x = "Jaar", y = "Temperatuur (°F)", color = "Temperatuur (°F):")
gb + scale_color_continuous()Warning in grid.Call(C_textBounds, as.graphicsAnnot(x$label), x$x, x$y, : font
family not found in Windows font database
Warning in grid.Call(C_textBounds, as.graphicsAnnot(x$label), x$x, x$y, : font
family not found in Windows font database
Warning in grid.Call(C_textBounds, as.graphicsAnnot(x$label), x$x, x$y, : font
family not found in Windows font database
Warning in grid.Call(C_textBounds, as.graphicsAnnot(x$label), x$x, x$y, : font
family not found in Windows font database
Warning in grid.Call(C_textBounds, as.graphicsAnnot(x$label), x$x, x$y, : font
family not found in Windows font database
Warning in grid.Call(C_textBounds, as.graphicsAnnot(x$label), x$x, x$y, : font
family not found in Windows font database
Warning in grid.Call(C_textBounds, as.graphicsAnnot(x$label), x$x, x$y, : font
family not found in Windows font database
Warning in grid.Call(C_textBounds, as.graphicsAnnot(x$label), x$x, x$y, : font
family not found in Windows font database
Warning in grid.Call(C_textBounds, as.graphicsAnnot(x$label), x$x, x$y, : font
family not found in Windows font databaseWarning in grid.Call.graphics(C_text, as.graphicsAnnot(x$label), x$x, x$y, :
font family not found in Windows font databaseWarning in grid.Call(C_textBounds, as.graphicsAnnot(x$label), x$x, x$y, : font
family not found in Windows font database
Warning in grid.Call(C_textBounds, as.graphicsAnnot(x$label), x$x, x$y, : font
family not found in Windows font database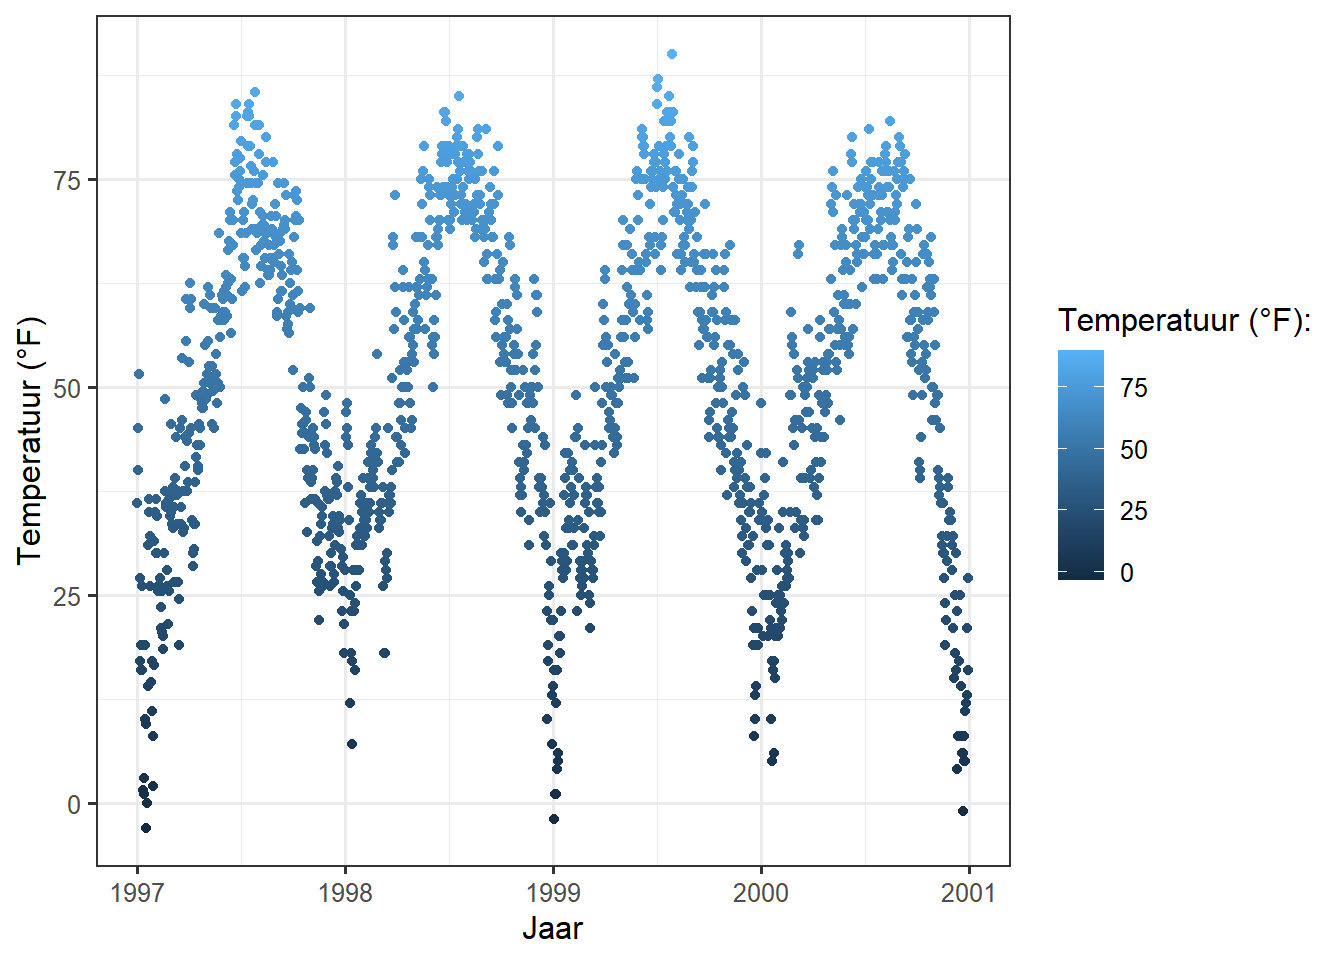
Deze code laat dezelfde plot zien:
gb + scale_color_gradient()Warning in grid.Call(C_textBounds, as.graphicsAnnot(x$label), x$x, x$y, : font
family not found in Windows font database
Warning in grid.Call(C_textBounds, as.graphicsAnnot(x$label), x$x, x$y, : font
family not found in Windows font database
Warning in grid.Call(C_textBounds, as.graphicsAnnot(x$label), x$x, x$y, : font
family not found in Windows font database
Warning in grid.Call(C_textBounds, as.graphicsAnnot(x$label), x$x, x$y, : font
family not found in Windows font database
Warning in grid.Call(C_textBounds, as.graphicsAnnot(x$label), x$x, x$y, : font
family not found in Windows font database
Warning in grid.Call(C_textBounds, as.graphicsAnnot(x$label), x$x, x$y, : font
family not found in Windows font database
Warning in grid.Call(C_textBounds, as.graphicsAnnot(x$label), x$x, x$y, : font
family not found in Windows font database
Warning in grid.Call(C_textBounds, as.graphicsAnnot(x$label), x$x, x$y, : font
family not found in Windows font database
Warning in grid.Call(C_textBounds, as.graphicsAnnot(x$label), x$x, x$y, : font
family not found in Windows font databaseWarning in grid.Call.graphics(C_text, as.graphicsAnnot(x$label), x$x, x$y, :
font family not found in Windows font databaseWarning in grid.Call(C_textBounds, as.graphicsAnnot(x$label), x$x, x$y, : font
family not found in Windows font database
Warning in grid.Call(C_textBounds, as.graphicsAnnot(x$label), x$x, x$y, : font
family not found in Windows font database
En hier is het divergerende standaard kleurschema:
mid <- mean(chic$temp) ## midpoint
gb + scale_color_gradient2(midpoint = mid)Warning in grid.Call(C_textBounds, as.graphicsAnnot(x$label), x$x, x$y, : font
family not found in Windows font database
Warning in grid.Call(C_textBounds, as.graphicsAnnot(x$label), x$x, x$y, : font
family not found in Windows font database
Warning in grid.Call(C_textBounds, as.graphicsAnnot(x$label), x$x, x$y, : font
family not found in Windows font database
Warning in grid.Call(C_textBounds, as.graphicsAnnot(x$label), x$x, x$y, : font
family not found in Windows font database
Warning in grid.Call(C_textBounds, as.graphicsAnnot(x$label), x$x, x$y, : font
family not found in Windows font database
Warning in grid.Call(C_textBounds, as.graphicsAnnot(x$label), x$x, x$y, : font
family not found in Windows font database
Warning in grid.Call(C_textBounds, as.graphicsAnnot(x$label), x$x, x$y, : font
family not found in Windows font database
Warning in grid.Call(C_textBounds, as.graphicsAnnot(x$label), x$x, x$y, : font
family not found in Windows font database
Warning in grid.Call(C_textBounds, as.graphicsAnnot(x$label), x$x, x$y, : font
family not found in Windows font databaseWarning in grid.Call.graphics(C_text, as.graphicsAnnot(x$label), x$x, x$y, :
font family not found in Windows font databaseWarning in grid.Call(C_textBounds, as.graphicsAnnot(x$label), x$x, x$y, : font
family not found in Windows font database
Warning in grid.Call(C_textBounds, as.graphicsAnnot(x$label), x$x, x$y, : font
family not found in Windows font database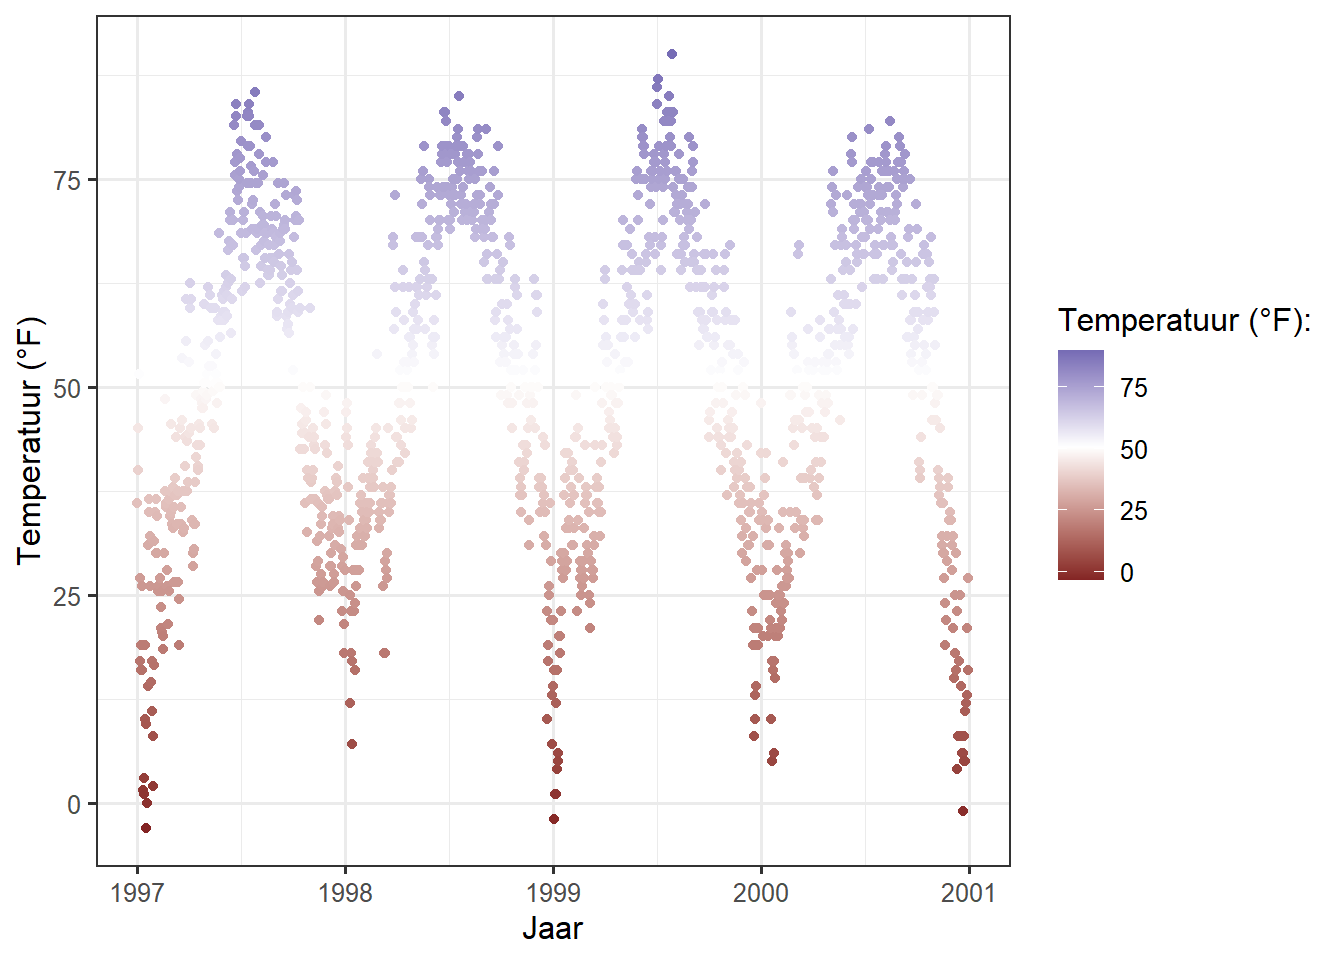
Handmatig een sequentieel kleurenschema instellen
Je kunt handmatig geleidelijk veranderende kleurenpaletten instellen voor continue variabelen via scale_*_gradient():
gb + scale_color_gradient(low = "darkkhaki",
high = "darkgreen")Warning in grid.Call(C_textBounds, as.graphicsAnnot(x$label), x$x, x$y, : font
family not found in Windows font database
Warning in grid.Call(C_textBounds, as.graphicsAnnot(x$label), x$x, x$y, : font
family not found in Windows font database
Warning in grid.Call(C_textBounds, as.graphicsAnnot(x$label), x$x, x$y, : font
family not found in Windows font database
Warning in grid.Call(C_textBounds, as.graphicsAnnot(x$label), x$x, x$y, : font
family not found in Windows font database
Warning in grid.Call(C_textBounds, as.graphicsAnnot(x$label), x$x, x$y, : font
family not found in Windows font database
Warning in grid.Call(C_textBounds, as.graphicsAnnot(x$label), x$x, x$y, : font
family not found in Windows font database
Warning in grid.Call(C_textBounds, as.graphicsAnnot(x$label), x$x, x$y, : font
family not found in Windows font database
Warning in grid.Call(C_textBounds, as.graphicsAnnot(x$label), x$x, x$y, : font
family not found in Windows font database
Warning in grid.Call(C_textBounds, as.graphicsAnnot(x$label), x$x, x$y, : font
family not found in Windows font databaseWarning in grid.Call.graphics(C_text, as.graphicsAnnot(x$label), x$x, x$y, :
font family not found in Windows font databaseWarning in grid.Call(C_textBounds, as.graphicsAnnot(x$label), x$x, x$y, : font
family not found in Windows font database
Warning in grid.Call(C_textBounds, as.graphicsAnnot(x$label), x$x, x$y, : font
family not found in Windows font database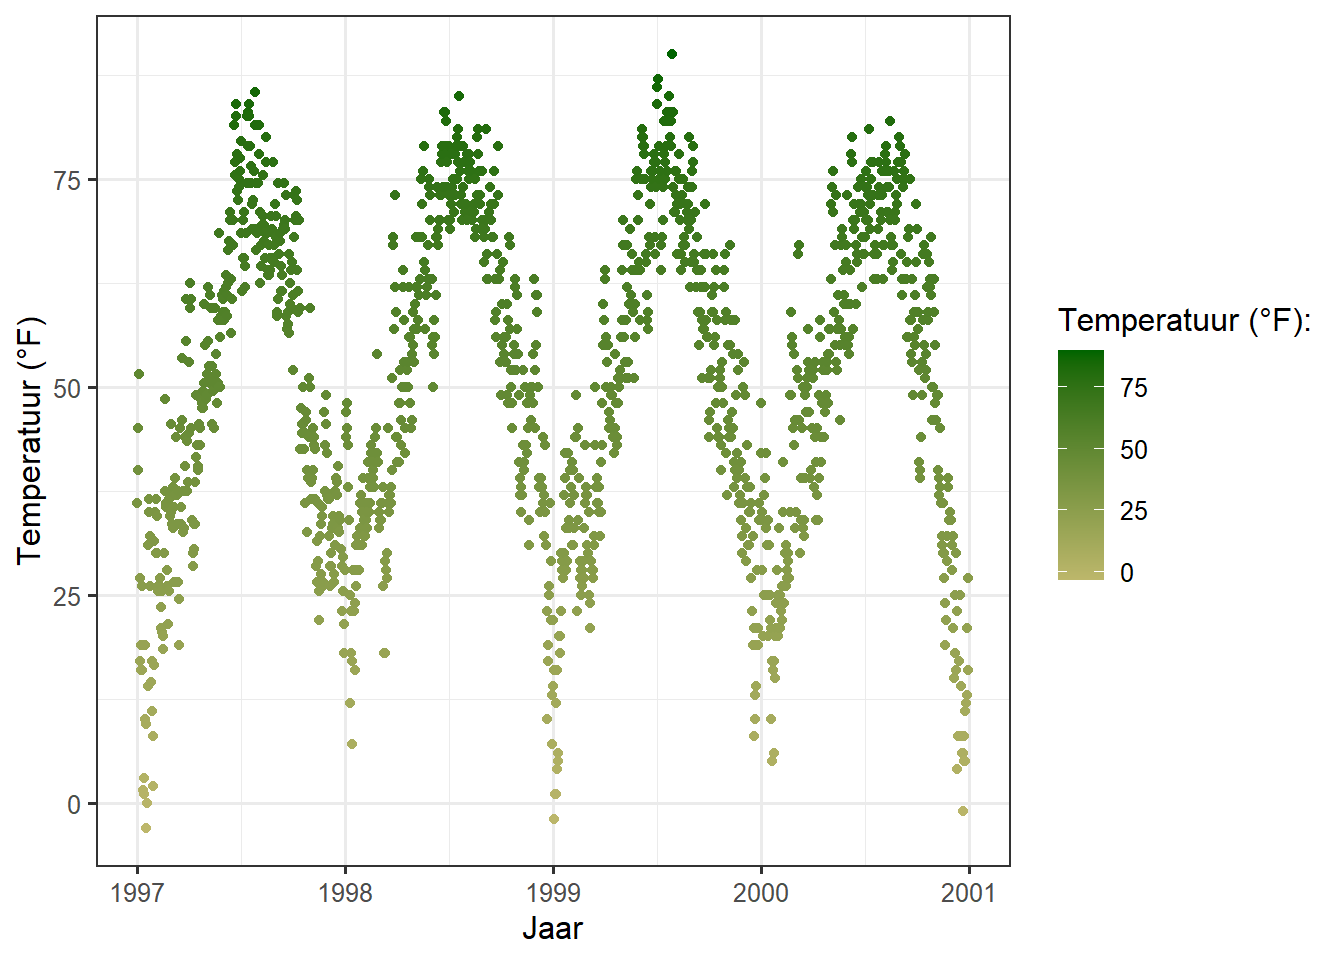
Temperatuurgegevens zijn normaal verdeeld, dus wat denk je van een divergerende kleurenschema (in plaats van sequentieel)… Voor divergerende kleuren kun je de scale_*_gradient2() functie gebruiken:
gb + scale_color_gradient2(midpoint = mid, low = "#dd8a0b",
mid = "grey92", high = "#32a676")Warning in grid.Call(C_textBounds, as.graphicsAnnot(x$label), x$x, x$y, : font
family not found in Windows font database
Warning in grid.Call(C_textBounds, as.graphicsAnnot(x$label), x$x, x$y, : font
family not found in Windows font database
Warning in grid.Call(C_textBounds, as.graphicsAnnot(x$label), x$x, x$y, : font
family not found in Windows font database
Warning in grid.Call(C_textBounds, as.graphicsAnnot(x$label), x$x, x$y, : font
family not found in Windows font database
Warning in grid.Call(C_textBounds, as.graphicsAnnot(x$label), x$x, x$y, : font
family not found in Windows font database
Warning in grid.Call(C_textBounds, as.graphicsAnnot(x$label), x$x, x$y, : font
family not found in Windows font database
Warning in grid.Call(C_textBounds, as.graphicsAnnot(x$label), x$x, x$y, : font
family not found in Windows font database
Warning in grid.Call(C_textBounds, as.graphicsAnnot(x$label), x$x, x$y, : font
family not found in Windows font database
Warning in grid.Call(C_textBounds, as.graphicsAnnot(x$label), x$x, x$y, : font
family not found in Windows font databaseWarning in grid.Call.graphics(C_text, as.graphicsAnnot(x$label), x$x, x$y, :
font family not found in Windows font databaseWarning in grid.Call(C_textBounds, as.graphicsAnnot(x$label), x$x, x$y, : font
family not found in Windows font database
Warning in grid.Call(C_textBounds, as.graphicsAnnot(x$label), x$x, x$y, : font
family not found in Windows font database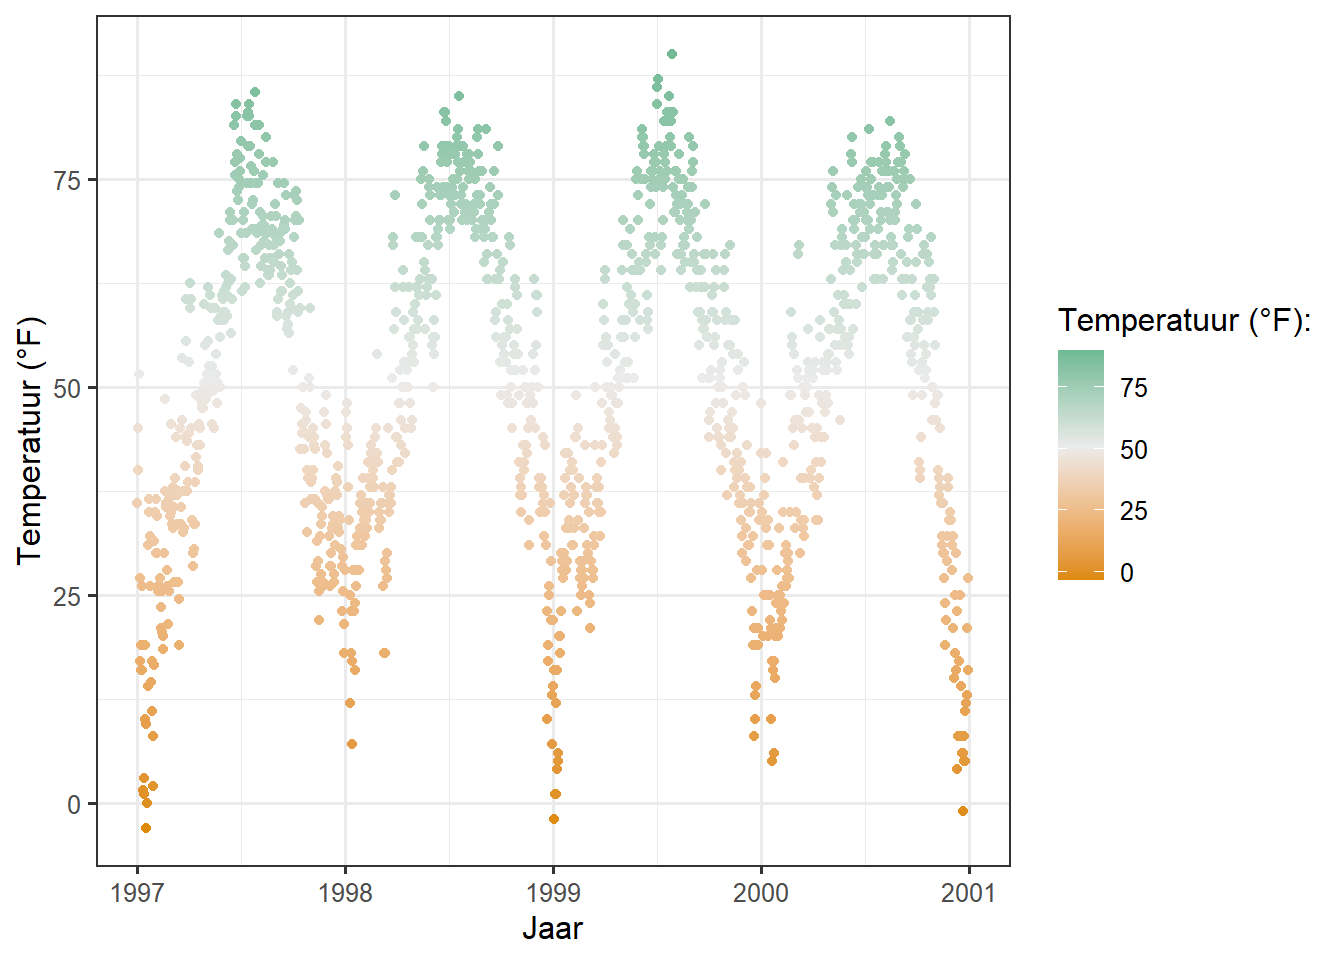
Het mooie Viridis Kleurenpalet
De viridis kleurenpaletten maken jouw plots niet alleen mooi en goed waarneembaar, maar ook gemakkelijker te lezen door mensen met kleurenblindheid en goed af te drukken in grijstinten. U kunt testen hoe uw grafieken er onder verschillende vormen van kleurenblindheid uitzien met het dichromate pakket.
En ze worden nu ook geleverd met ggplot2! De volgende multi-panel plot illustreert drie van de vier viridis paletten:
p1 <- gb + scale_color_viridis_c() + ggtitle("'viridis' (default)")
p2 <- gb + scale_color_viridis_c(option = "inferno") + ggtitle("'inferno'")
p3 <- gb + scale_color_viridis_c(option = "plasma") + ggtitle("'plasma'")
p4 <- gb + scale_color_viridis_c(option = "cividis") + ggtitle("'cividis'")
library(patchwork)
(p1 + p2 + p3 + p4) * theme(legend.position = "bottom")Warning in grid.Call(C_textBounds, as.graphicsAnnot(x$label), x$x, x$y, : font
family not found in Windows font database
Warning in grid.Call(C_textBounds, as.graphicsAnnot(x$label), x$x, x$y, : font
family not found in Windows font databaseWarning in grid.Call(C_stringMetric, as.graphicsAnnot(x$label)): font family not
found in Windows font databaseWarning in grid.Call(C_textBounds, as.graphicsAnnot(x$label), x$x, x$y, : font
family not found in Windows font database
Warning in grid.Call(C_textBounds, as.graphicsAnnot(x$label), x$x, x$y, : font
family not found in Windows font database
Warning in grid.Call(C_textBounds, as.graphicsAnnot(x$label), x$x, x$y, : font
family not found in Windows font database
Warning in grid.Call(C_textBounds, as.graphicsAnnot(x$label), x$x, x$y, : font
family not found in Windows font database
Warning in grid.Call(C_textBounds, as.graphicsAnnot(x$label), x$x, x$y, : font
family not found in Windows font database
Warning in grid.Call(C_textBounds, as.graphicsAnnot(x$label), x$x, x$y, : font
family not found in Windows font database
Warning in grid.Call(C_textBounds, as.graphicsAnnot(x$label), x$x, x$y, : font
family not found in Windows font database
Warning in grid.Call(C_textBounds, as.graphicsAnnot(x$label), x$x, x$y, : font
family not found in Windows font database
Warning in grid.Call(C_textBounds, as.graphicsAnnot(x$label), x$x, x$y, : font
family not found in Windows font database
Warning in grid.Call(C_textBounds, as.graphicsAnnot(x$label), x$x, x$y, : font
family not found in Windows font database
Warning in grid.Call(C_textBounds, as.graphicsAnnot(x$label), x$x, x$y, : font
family not found in Windows font database
Warning in grid.Call(C_textBounds, as.graphicsAnnot(x$label), x$x, x$y, : font
family not found in Windows font database
Warning in grid.Call(C_textBounds, as.graphicsAnnot(x$label), x$x, x$y, : font
family not found in Windows font database
Warning in grid.Call(C_textBounds, as.graphicsAnnot(x$label), x$x, x$y, : font
family not found in Windows font database
Warning in grid.Call(C_textBounds, as.graphicsAnnot(x$label), x$x, x$y, : font
family not found in Windows font database
Warning in grid.Call(C_textBounds, as.graphicsAnnot(x$label), x$x, x$y, : font
family not found in Windows font database
Warning in grid.Call(C_textBounds, as.graphicsAnnot(x$label), x$x, x$y, : font
family not found in Windows font database
Warning in grid.Call(C_textBounds, as.graphicsAnnot(x$label), x$x, x$y, : font
family not found in Windows font database
Warning in grid.Call(C_textBounds, as.graphicsAnnot(x$label), x$x, x$y, : font
family not found in Windows font database
Warning in grid.Call(C_textBounds, as.graphicsAnnot(x$label), x$x, x$y, : font
family not found in Windows font database
Warning in grid.Call(C_textBounds, as.graphicsAnnot(x$label), x$x, x$y, : font
family not found in Windows font database
Warning in grid.Call(C_textBounds, as.graphicsAnnot(x$label), x$x, x$y, : font
family not found in Windows font database
Warning in grid.Call(C_textBounds, as.graphicsAnnot(x$label), x$x, x$y, : font
family not found in Windows font database
Warning in grid.Call(C_textBounds, as.graphicsAnnot(x$label), x$x, x$y, : font
family not found in Windows font database
Warning in grid.Call(C_textBounds, as.graphicsAnnot(x$label), x$x, x$y, : font
family not found in Windows font databaseWarning in grid.Call.graphics(C_text, as.graphicsAnnot(x$label), x$x, x$y, :
font family not found in Windows font databaseWarning in grid.Call(C_textBounds, as.graphicsAnnot(x$label), x$x, x$y, : font
family not found in Windows font database
Warning in grid.Call(C_textBounds, as.graphicsAnnot(x$label), x$x, x$y, : font
family not found in Windows font database
Warning in grid.Call(C_textBounds, as.graphicsAnnot(x$label), x$x, x$y, : font
family not found in Windows font database
Warning in grid.Call(C_textBounds, as.graphicsAnnot(x$label), x$x, x$y, : font
family not found in Windows font database
Warning in grid.Call(C_textBounds, as.graphicsAnnot(x$label), x$x, x$y, : font
family not found in Windows font databaseWarning in grid.Call.graphics(C_text, as.graphicsAnnot(x$label), x$x, x$y, :
font family not found in Windows font databaseWarning in grid.Call(C_textBounds, as.graphicsAnnot(x$label), x$x, x$y, : font
family not found in Windows font database
Warning in grid.Call(C_textBounds, as.graphicsAnnot(x$label), x$x, x$y, : font
family not found in Windows font database
Warning in grid.Call(C_textBounds, as.graphicsAnnot(x$label), x$x, x$y, : font
family not found in Windows font database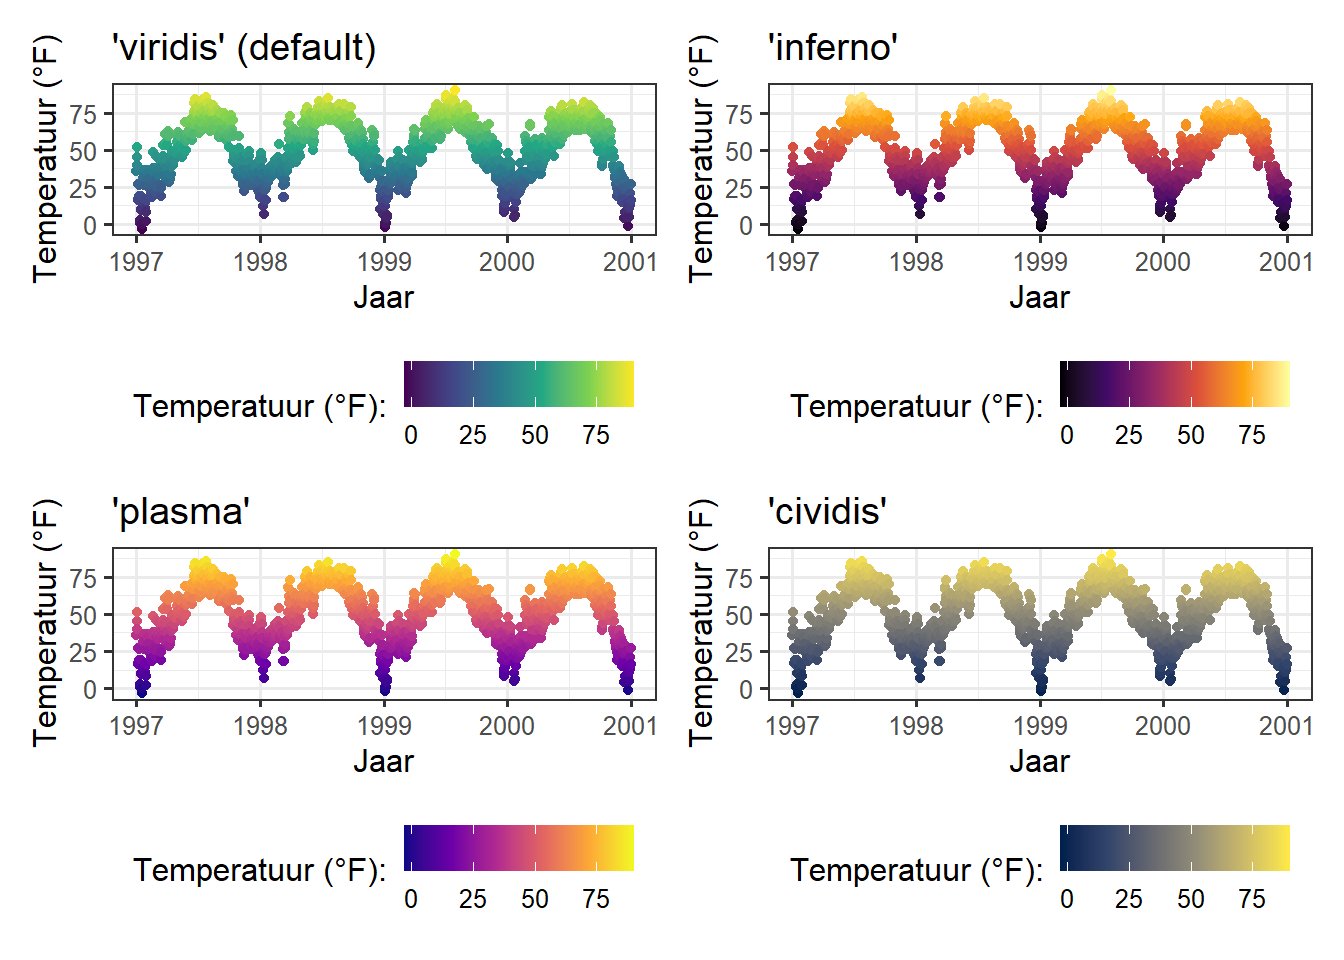
Het is ook mogelijk om de viridis kleurenpaletten te gebruiken voor discrete variabelen:
ga + scale_color_viridis_d(guide = "none")Warning in grid.Call(C_textBounds, as.graphicsAnnot(x$label), x$x, x$y, : font
family not found in Windows font database
Warning in grid.Call(C_textBounds, as.graphicsAnnot(x$label), x$x, x$y, : font
family not found in Windows font database
Warning in grid.Call(C_textBounds, as.graphicsAnnot(x$label), x$x, x$y, : font
family not found in Windows font database
Warning in grid.Call(C_textBounds, as.graphicsAnnot(x$label), x$x, x$y, : font
family not found in Windows font database
Warning in grid.Call(C_textBounds, as.graphicsAnnot(x$label), x$x, x$y, : font
family not found in Windows font database
Warning in grid.Call(C_textBounds, as.graphicsAnnot(x$label), x$x, x$y, : font
family not found in Windows font database
Warning in grid.Call(C_textBounds, as.graphicsAnnot(x$label), x$x, x$y, : font
family not found in Windows font databaseWarning in grid.Call.graphics(C_text, as.graphicsAnnot(x$label), x$x, x$y, :
font family not found in Windows font database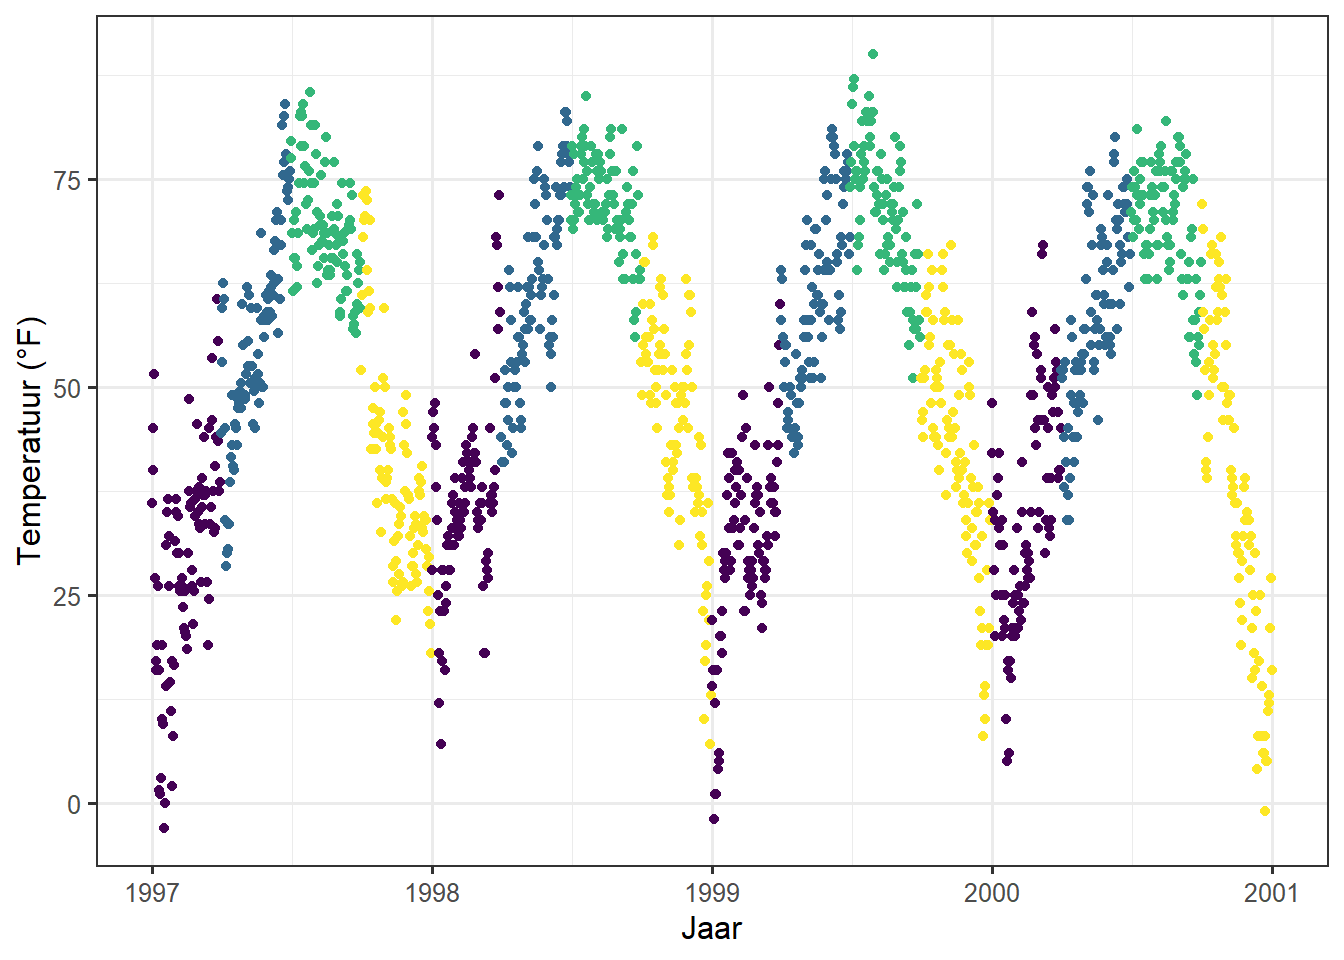
Kwantitatieve kleurenpaletten uit uitbreidingspakketten gebruiken
De vele uitbreidingspakketten bieden niet alleen bijkomende categorische kleurenpaletten, maar ook sequentiële, divergerende en zelfs cyclische paletten. Nogmaals, ik verwijs je naar de geweldige verzameling geleverd door Emil Hvitfeldt voor een overzicht.
Voorbeelden:
Het rcartocolors pakket koppelt het prachtige CARTOcolors aan ggplot2 en bevat verschillende van mijn meest gebruikte paletten:
library(rcartocolor)
g1 <- gb + scale_color_carto_c(palette = "BurgYl")
g2 <- gb + scale_color_carto_c(palette = "Earth")
(g1 + g2) * theme(legend.position = "bottom")Warning in grid.Call(C_textBounds, as.graphicsAnnot(x$label), x$x, x$y, : font
family not found in Windows font database
Warning in grid.Call(C_textBounds, as.graphicsAnnot(x$label), x$x, x$y, : font
family not found in Windows font database
Warning in grid.Call(C_textBounds, as.graphicsAnnot(x$label), x$x, x$y, : font
family not found in Windows font database
Warning in grid.Call(C_textBounds, as.graphicsAnnot(x$label), x$x, x$y, : font
family not found in Windows font database
Warning in grid.Call(C_textBounds, as.graphicsAnnot(x$label), x$x, x$y, : font
family not found in Windows font database
Warning in grid.Call(C_textBounds, as.graphicsAnnot(x$label), x$x, x$y, : font
family not found in Windows font database
Warning in grid.Call(C_textBounds, as.graphicsAnnot(x$label), x$x, x$y, : font
family not found in Windows font database
Warning in grid.Call(C_textBounds, as.graphicsAnnot(x$label), x$x, x$y, : font
family not found in Windows font database
Warning in grid.Call(C_textBounds, as.graphicsAnnot(x$label), x$x, x$y, : font
family not found in Windows font database
Warning in grid.Call(C_textBounds, as.graphicsAnnot(x$label), x$x, x$y, : font
family not found in Windows font database
Warning in grid.Call(C_textBounds, as.graphicsAnnot(x$label), x$x, x$y, : font
family not found in Windows font databaseWarning in grid.Call.graphics(C_text, as.graphicsAnnot(x$label), x$x, x$y, :
font family not found in Windows font databaseWarning in grid.Call(C_textBounds, as.graphicsAnnot(x$label), x$x, x$y, : font
family not found in Windows font database
Warning in grid.Call(C_textBounds, as.graphicsAnnot(x$label), x$x, x$y, : font
family not found in Windows font database
Warning in grid.Call(C_textBounds, as.graphicsAnnot(x$label), x$x, x$y, : font
family not found in Windows font database
Warning in grid.Call(C_textBounds, as.graphicsAnnot(x$label), x$x, x$y, : font
family not found in Windows font databaseWarning in grid.Call.graphics(C_text, as.graphicsAnnot(x$label), x$x, x$y, :
font family not found in Windows font databaseWarning in grid.Call(C_textBounds, as.graphicsAnnot(x$label), x$x, x$y, : font
family not found in Windows font database
Warning in grid.Call(C_textBounds, as.graphicsAnnot(x$label), x$x, x$y, : font
family not found in Windows font database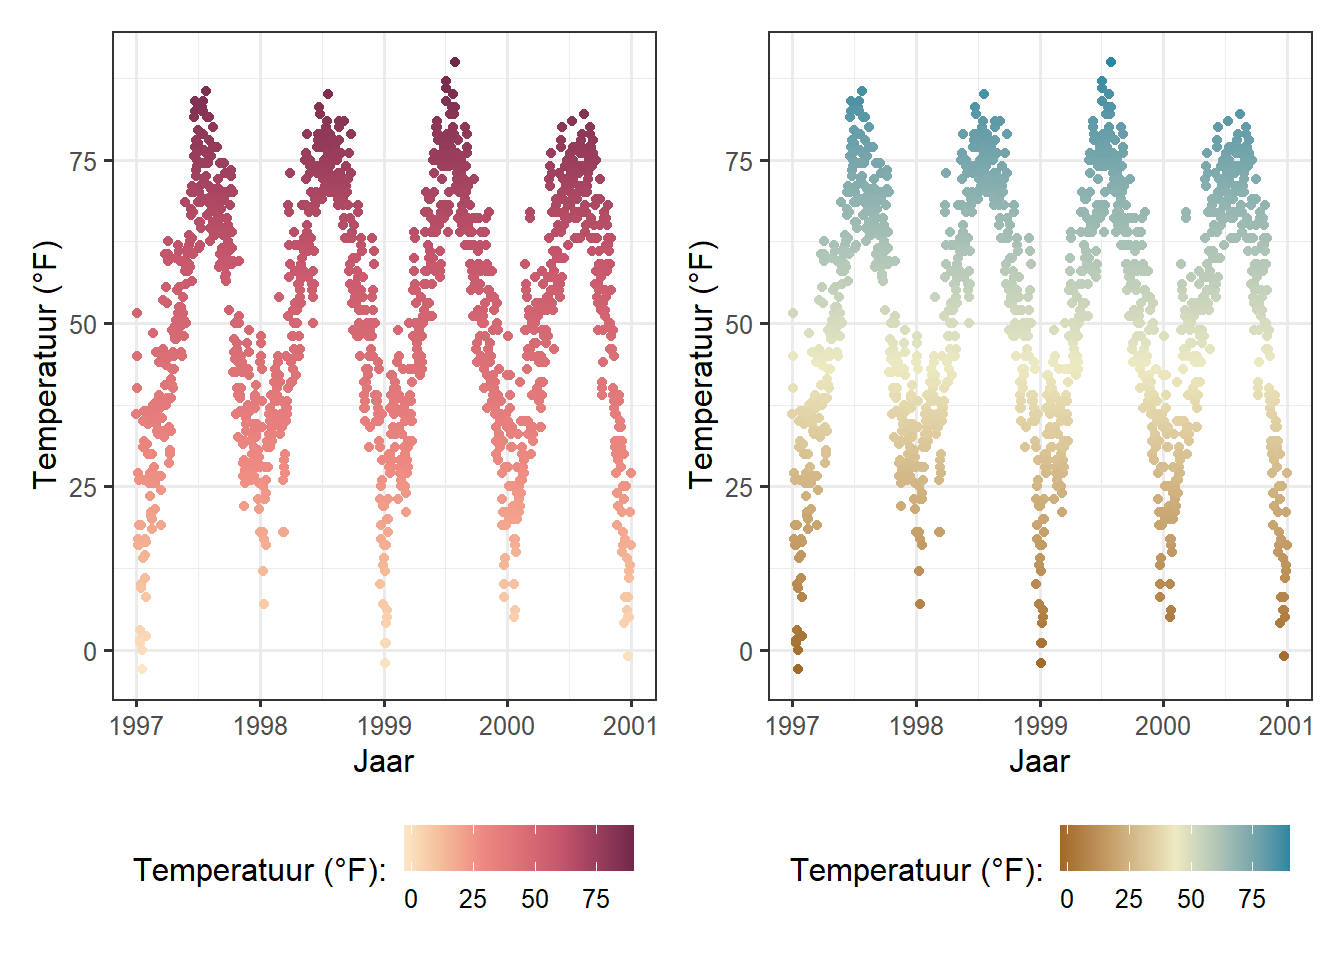
Het scico pakket biedt toegang tot de kleurenpaletten ontwikkeld door Fabio Crameri. Deze kleurenpaletten zijn niet alleen mooi en vaak ongebruikelijk, maar ook een goede keuze omdat ze ontwikkeld zijn om perceptueel uniform en geordend te zijn. Bovendien werken ze ook voor mensen met een kleurentekort en in grijstinten:
library(scico)
g1 <- gb + scale_color_scico(palette = "berlin")
g2 <- gb + scale_color_scico(palette = "hawaii", direction = -1)
(g1 + g2) * theme(legend.position = "bottom")Warning in grid.Call(C_textBounds, as.graphicsAnnot(x$label), x$x, x$y, : font
family not found in Windows font database
Warning in grid.Call(C_textBounds, as.graphicsAnnot(x$label), x$x, x$y, : font
family not found in Windows font database
Warning in grid.Call(C_textBounds, as.graphicsAnnot(x$label), x$x, x$y, : font
family not found in Windows font database
Warning in grid.Call(C_textBounds, as.graphicsAnnot(x$label), x$x, x$y, : font
family not found in Windows font database
Warning in grid.Call(C_textBounds, as.graphicsAnnot(x$label), x$x, x$y, : font
family not found in Windows font database
Warning in grid.Call(C_textBounds, as.graphicsAnnot(x$label), x$x, x$y, : font
family not found in Windows font database
Warning in grid.Call(C_textBounds, as.graphicsAnnot(x$label), x$x, x$y, : font
family not found in Windows font database
Warning in grid.Call(C_textBounds, as.graphicsAnnot(x$label), x$x, x$y, : font
family not found in Windows font database
Warning in grid.Call(C_textBounds, as.graphicsAnnot(x$label), x$x, x$y, : font
family not found in Windows font database
Warning in grid.Call(C_textBounds, as.graphicsAnnot(x$label), x$x, x$y, : font
family not found in Windows font database
Warning in grid.Call(C_textBounds, as.graphicsAnnot(x$label), x$x, x$y, : font
family not found in Windows font databaseWarning in grid.Call.graphics(C_text, as.graphicsAnnot(x$label), x$x, x$y, :
font family not found in Windows font databaseWarning in grid.Call(C_textBounds, as.graphicsAnnot(x$label), x$x, x$y, : font
family not found in Windows font database
Warning in grid.Call(C_textBounds, as.graphicsAnnot(x$label), x$x, x$y, : font
family not found in Windows font database
Warning in grid.Call(C_textBounds, as.graphicsAnnot(x$label), x$x, x$y, : font
family not found in Windows font database
Warning in grid.Call(C_textBounds, as.graphicsAnnot(x$label), x$x, x$y, : font
family not found in Windows font databaseWarning in grid.Call.graphics(C_text, as.graphicsAnnot(x$label), x$x, x$y, :
font family not found in Windows font databaseWarning in grid.Call(C_textBounds, as.graphicsAnnot(x$label), x$x, x$y, : font
family not found in Windows font database
Warning in grid.Call(C_textBounds, as.graphicsAnnot(x$label), x$x, x$y, : font
family not found in Windows font database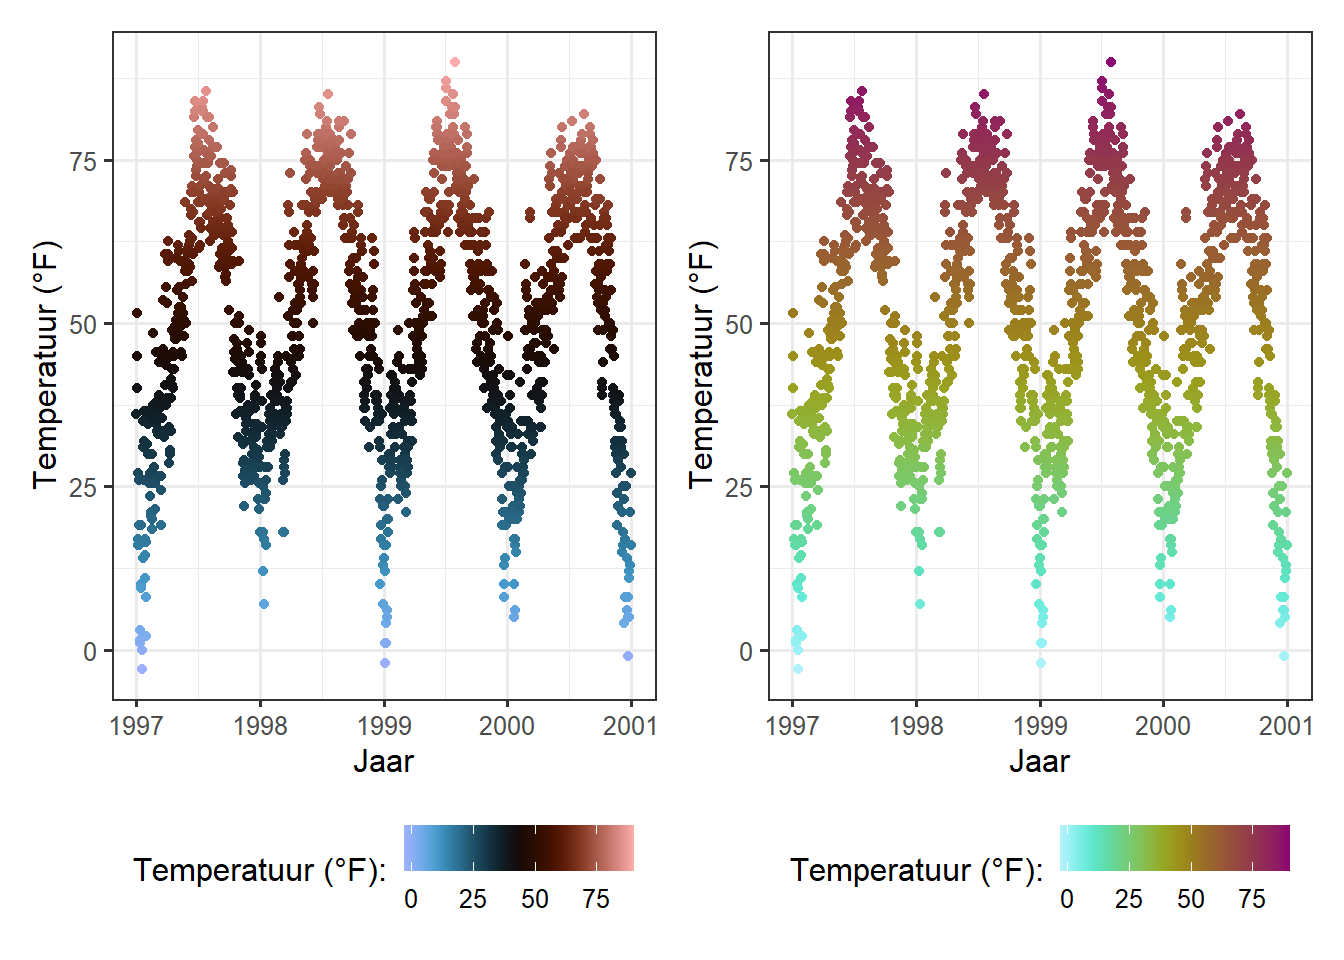
Kleurpaletten naderhand aanpassen
Sinds de laatste versie van ggplot2 3.0.0, kan men de esthetiek van de lagen wijzigen nadat ze zijn toegewezen aan de gegevens. Of zoals ggplot2 het zegt: “Gebruik after_scale() om de evaluatie van de mapping te markeren voor nadat de gegevens zijn geschaald.”
Dus waarom niet meteen de aangepaste kleuren gebruiken? Aangezien ggplot2 slechts één kleur en één vul schaal kan behandelen, is dit een interessante functionaliteit. Kijk eens naar het volgende voorbeeld waar we invert_color() uit het ggdark [package] gebruiken (https://github.com/nsgrantham/ggdark):
ggplot(chic, aes(date, temp, color = temp)) +
geom_point(size = 5) +
geom_point(aes(color = temp,
color = after_scale(invert_color(color))),
size = 2) +
scale_color_scico(palette = "hawaii", guide = "none") +
labs(x = "Jaar", y = "Temperatuur (°F)")Warning: Duplicated aesthetics after name standardisation: colourWarning in grid.Call(C_textBounds, as.graphicsAnnot(x$label), x$x, x$y, : font
family not found in Windows font database
Warning in grid.Call(C_textBounds, as.graphicsAnnot(x$label), x$x, x$y, : font
family not found in Windows font database
Warning in grid.Call(C_textBounds, as.graphicsAnnot(x$label), x$x, x$y, : font
family not found in Windows font database
Warning in grid.Call(C_textBounds, as.graphicsAnnot(x$label), x$x, x$y, : font
family not found in Windows font database
Warning in grid.Call(C_textBounds, as.graphicsAnnot(x$label), x$x, x$y, : font
family not found in Windows font database
Warning in grid.Call(C_textBounds, as.graphicsAnnot(x$label), x$x, x$y, : font
family not found in Windows font database
Warning in grid.Call(C_textBounds, as.graphicsAnnot(x$label), x$x, x$y, : font
family not found in Windows font databaseWarning in grid.Call.graphics(C_text, as.graphicsAnnot(x$label), x$x, x$y, :
font family not found in Windows font database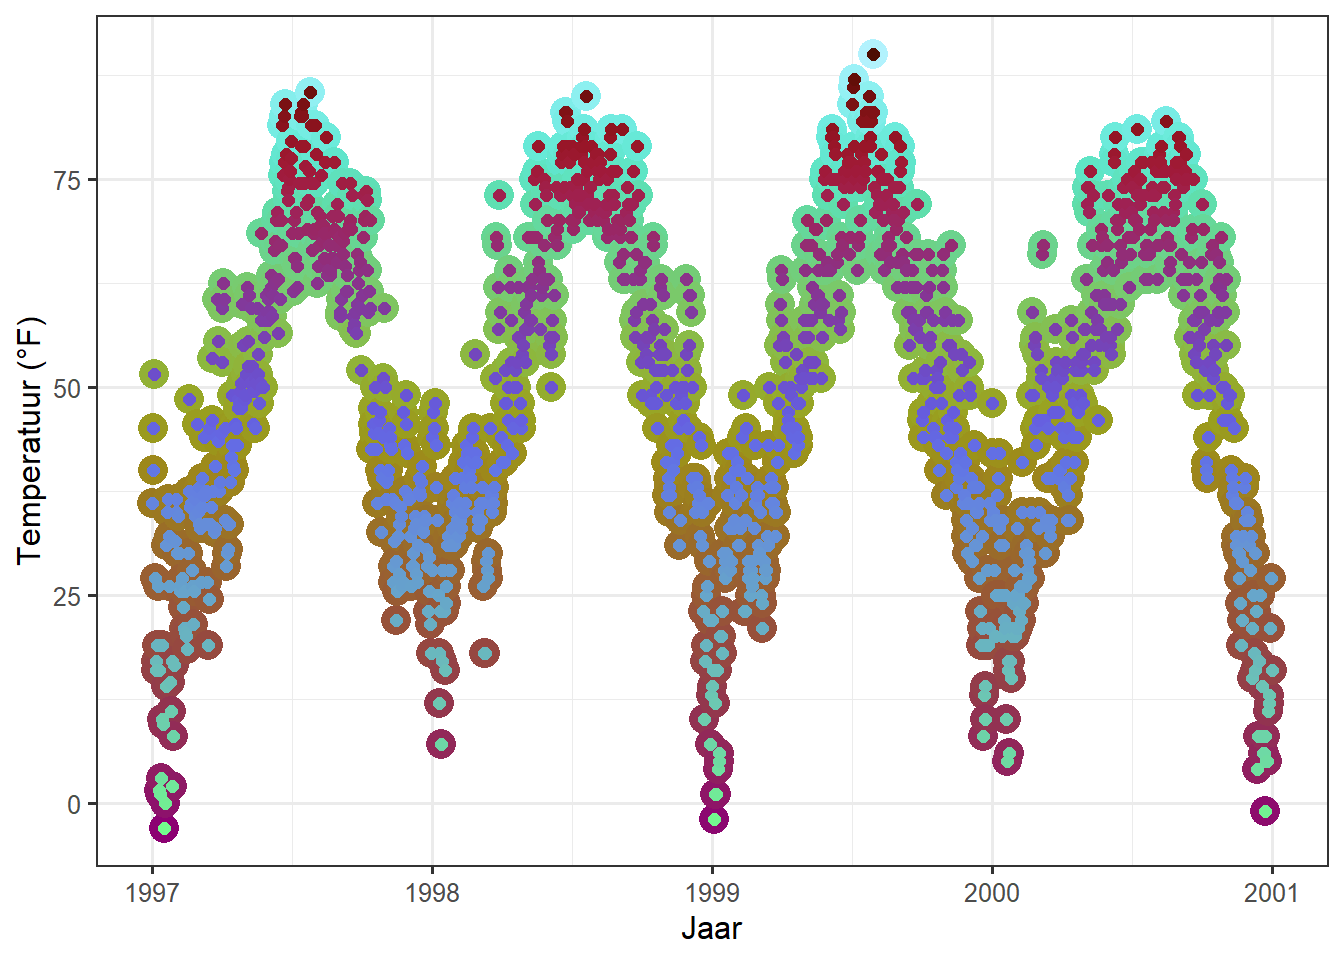
Het achteraf veranderen van het kleurenschema is vooral leuk met functies uit de ggdark en colorspace pakketten, namelijk invert_color(), lighten(), darken() en desature(). Je kunt deze functies zelfs combineren. Hier plotten we een boxplot met beide argumenten, color en fill:
library(colorspace)
ggplot(chic, aes(date, temp)) +
geom_boxplot(aes(color = season,
fill = after_scale(desaturate(lighten(color, .6), .6))),
size = 1) +
scale_color_brewer(palette = "Dark2", guide = "none") +
labs(x = "Jaar", y = "Temperatuur (°F)")Warning in grid.Call(C_textBounds, as.graphicsAnnot(x$label), x$x, x$y, : font
family not found in Windows font database
Warning in grid.Call(C_textBounds, as.graphicsAnnot(x$label), x$x, x$y, : font
family not found in Windows font database
Warning in grid.Call(C_textBounds, as.graphicsAnnot(x$label), x$x, x$y, : font
family not found in Windows font database
Warning in grid.Call(C_textBounds, as.graphicsAnnot(x$label), x$x, x$y, : font
family not found in Windows font database
Warning in grid.Call(C_textBounds, as.graphicsAnnot(x$label), x$x, x$y, : font
family not found in Windows font database
Warning in grid.Call(C_textBounds, as.graphicsAnnot(x$label), x$x, x$y, : font
family not found in Windows font database
Warning in grid.Call(C_textBounds, as.graphicsAnnot(x$label), x$x, x$y, : font
family not found in Windows font databaseWarning in grid.Call.graphics(C_text, as.graphicsAnnot(x$label), x$x, x$y, :
font family not found in Windows font database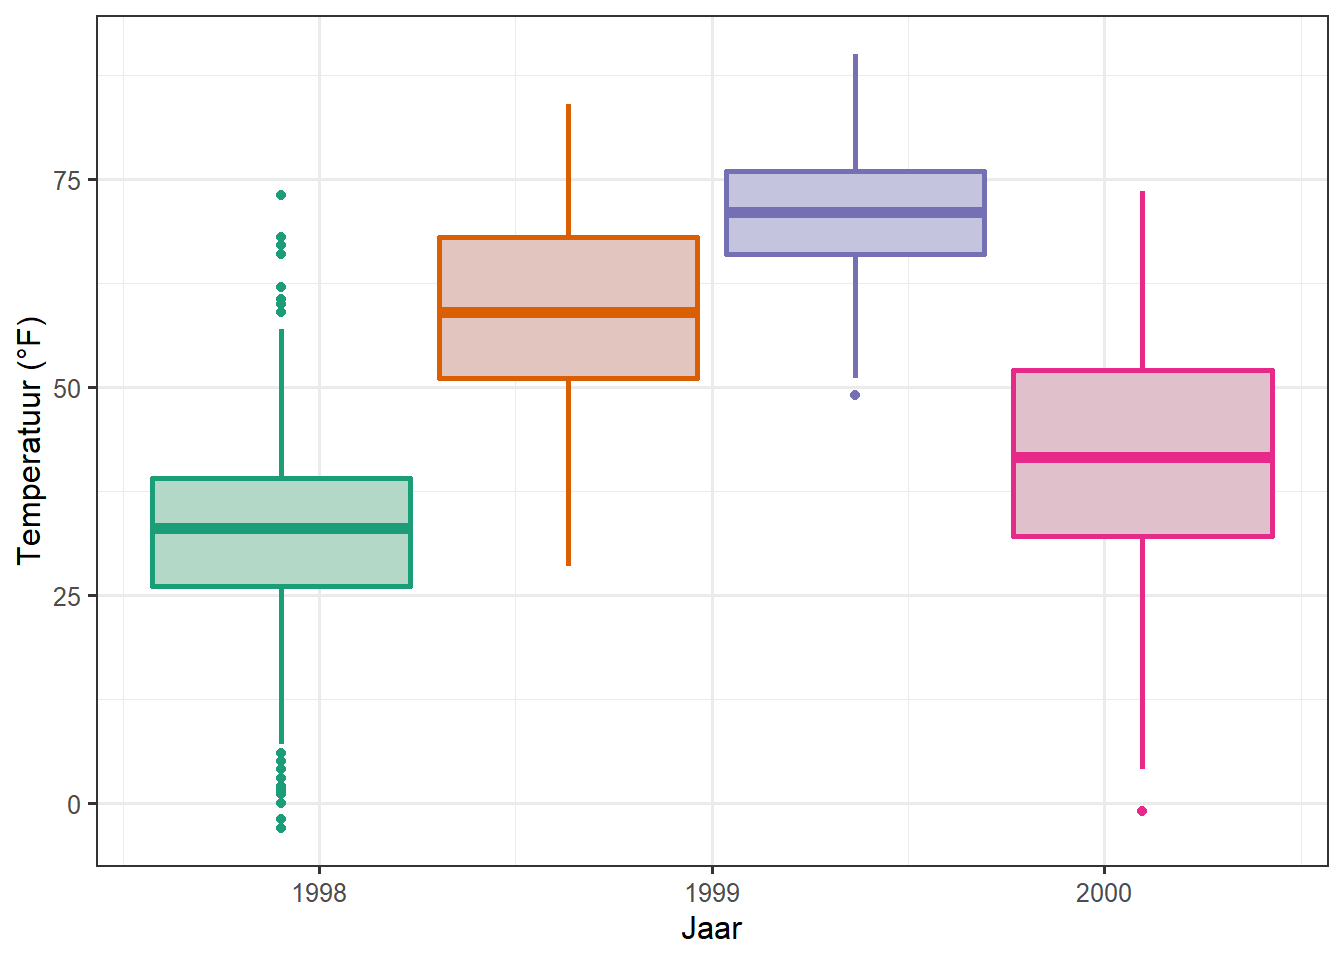
Merk op dat je de kleur en/of vulling moet opgeven in de aes() van de respectievelijke geom_*() of stat_*() om after_scale() te laten werken.
Dit lijkt een beetje ingewikkeld voor nu-je zou gewoon de
colorenfillschalen voor beide kunnen gebruiken. Ja, dat is waar, maar denk eens aan gevallen waarin je meerderecoloren/offillschalen nodig hebt. In zo’n geval zou het onzinnig zijn om defillschaal te bezetten met een iets donkerder versie van het palet dat voorcolorwordt gebruikt.
Werken met Thema’s
De algemene uitzetstijl veranderen
U kunt het uiterlijk van de plot veranderen door thema’s te gebruiken. ggplot2 wordt geleverd met acht ingebouwde thema’s:
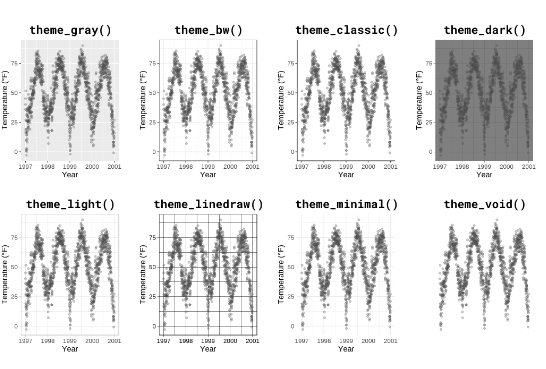
Er zijn verschillende pakketten die aanvullende thema’s leveren, sommige zelfs met verschillende standaard kleurenpaletten. Jeffrey Arnold heeft bijvoorbeeld de bibliotheek ggthemes samengesteld met verschillende aangepaste thema’s die populaire ontwerpen imiteren. Voor een lijst kunt u de ggthemes package site bezoeken. Zonder enige codering kun je gewoon verschillende stijlen aanpassen, waarvan sommige bekend staan om hun stijl en esthetiek.
Hier is een voorbeeld van het kopiëren van de plotting style in het The Economist magazine door gebruik te maken van theme_economist() en scale_color_economist():
library(ggthemes)
ggplot(chic,
       aes(x = date, y = temp, color = season)) +
  geom_point() +
labs(x = "Jaar", y = "Temperatuur (°F)") +
ggtitle("Ups en downs van Chicago's dagelijkse temperaturen") +
theme_economist() +
scale_color_economist(name = NULL)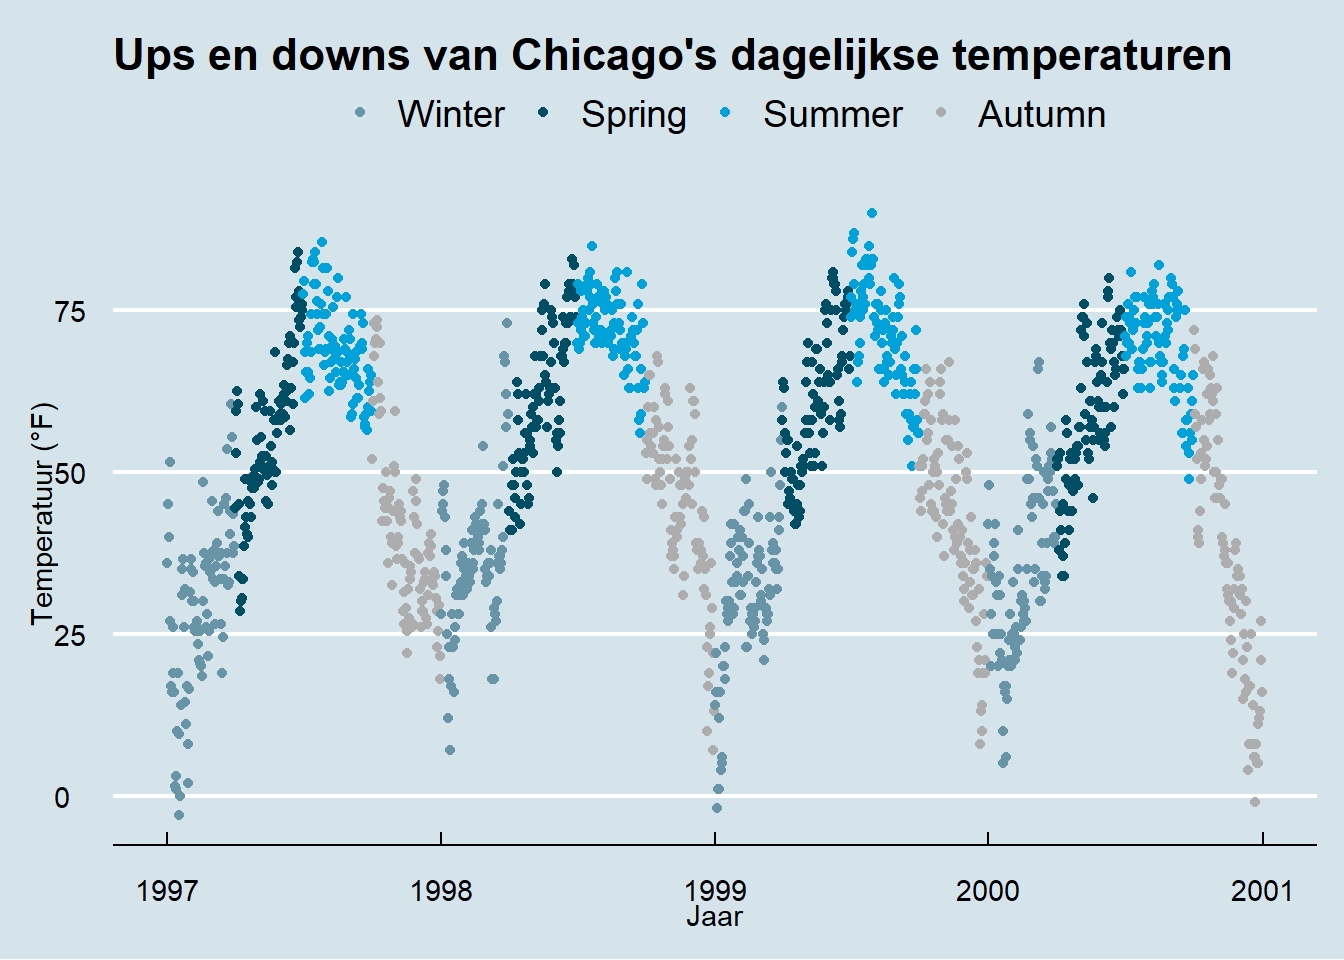
Een ander voorbeeld is de plottenstijl van Tufte, een minimaal inktthema gebaseerd op Edward Tufte’s boek The Visual Display of Quantitative Information. Dit is het boek dat Minard’s grafiek van Napoleon’s opmars naar Rusland populair maakte als een van de beste statistische tekeningen ooit gemaakt. Tufte’s plots werden beroemd door het purisme in hun stijl. Maar kijk zelf maar:
chic_2000 <- filter(chic, year == 2000)
ggplot(chic_2000, aes(x = temp, y = o3)) +
geom_point() +
labs(x = "Temperatuur (°F)", y = "Ozon") +
ggtitle("Temperatuur en Ozon niveaus in het jaar 2000 in Chicago") +
theme_tufte()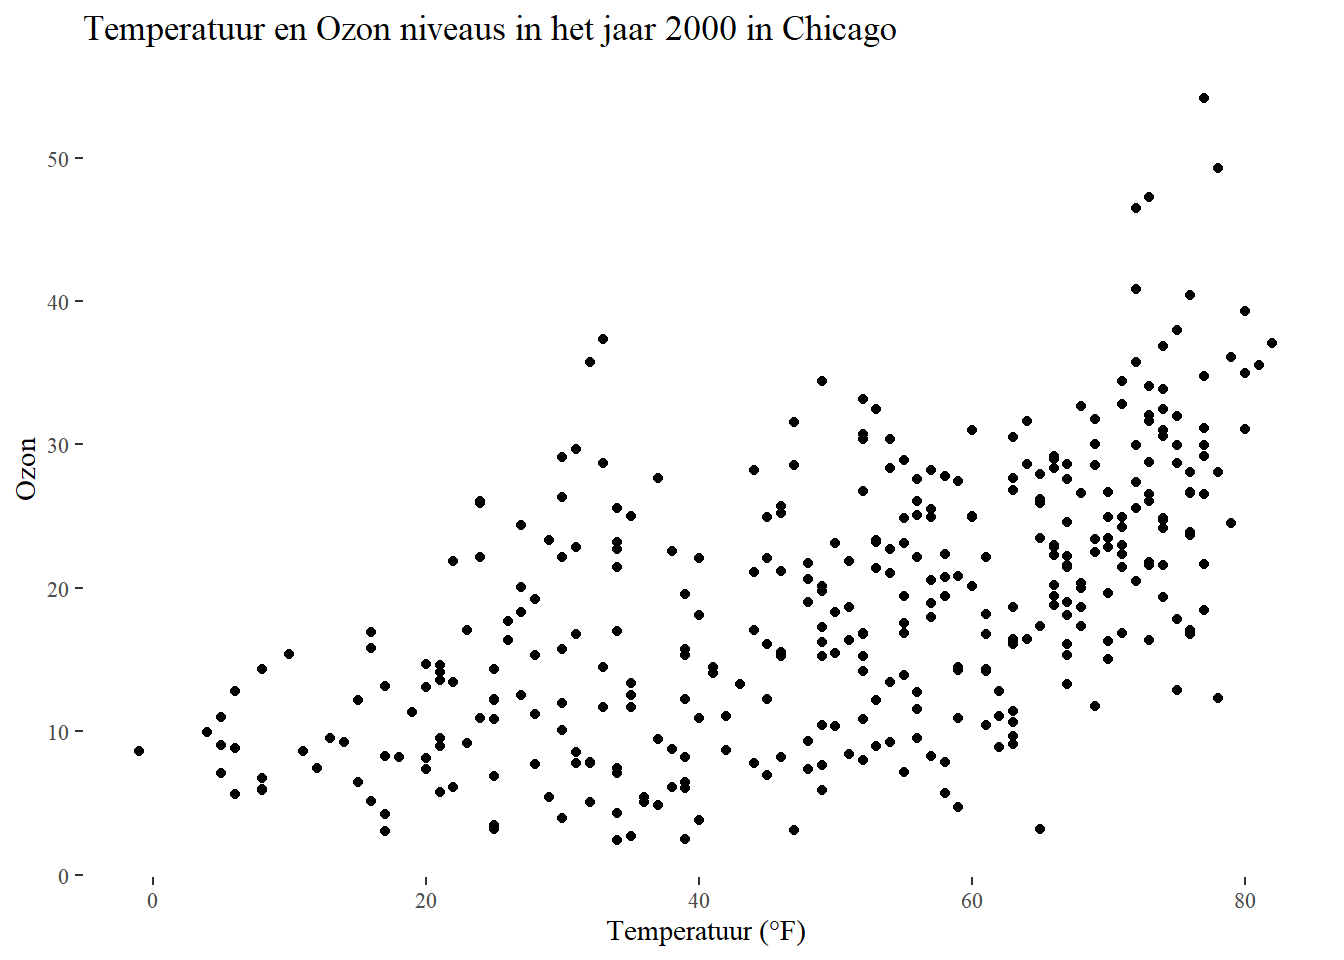
Ik heb het aantal datapunten hier beperkt, gewoon om in Tufte’s minimalistische stijl te passen. Als je van deze manier van plotten houdt, kijk dan eens naar deze blog entry over het maken van verschillende Tufte plots in R.
Een ander mooi pakket met moderne thema’s en een preset van niet-standaard lettertypen is het hrbrthemes pakket door Bob Rudis met verschillende lichte maar ook donkere thema’s:
library(hrbrthemes)
ggplot(chic, aes(x = temp, y = o3)) +
geom_point(aes(color = dewpoint), show.legend = FALSE) +
labs(x = "Temperatuur (°F)", y = "Ozon") +
ggtitle("Temperatuur en Ozonniveaus in Chicago")Warning in grid.Call(C_textBounds, as.graphicsAnnot(x$label), x$x, x$y, : font
family not found in Windows font database
Warning in grid.Call(C_textBounds, as.graphicsAnnot(x$label), x$x, x$y, : font
family not found in Windows font database

Warning in grid.Call(C_textBounds, as.graphicsAnnot(x$label), x$x, x$y, : font
family not found in Windows font database

Warning in grid.Call(C_textBounds, as.graphicsAnnot(x$label), x$x, x$y, : font
family not found in Windows font database

Warning in grid.Call(C_textBounds, as.graphicsAnnot(x$label), x$x, x$y, : font
family not found in Windows font database

Warning in grid.Call(C_textBounds, as.graphicsAnnot(x$label), x$x, x$y, : font
family not found in Windows font database

Warning in grid.Call(C_textBounds, as.graphicsAnnot(x$label), x$x, x$y, : font
family not found in Windows font database

Warning in grid.Call(C_textBounds, as.graphicsAnnot(x$label), x$x, x$y, : font
family not found in Windows font database

Warning in grid.Call(C_textBounds, as.graphicsAnnot(x$label), x$x, x$y, : font
family not found in Windows font database

Warning in grid.Call(C_textBounds, as.graphicsAnnot(x$label), x$x, x$y, : font
family not found in Windows font database
Warning in grid.Call.graphics(C_text, as.graphicsAnnot(x$label), x$x, x$y, :
font family not found in Windows font databaseWarning in grid.Call(C_textBounds, as.graphicsAnnot(x$label), x$x, x$y, : font
family not found in Windows font database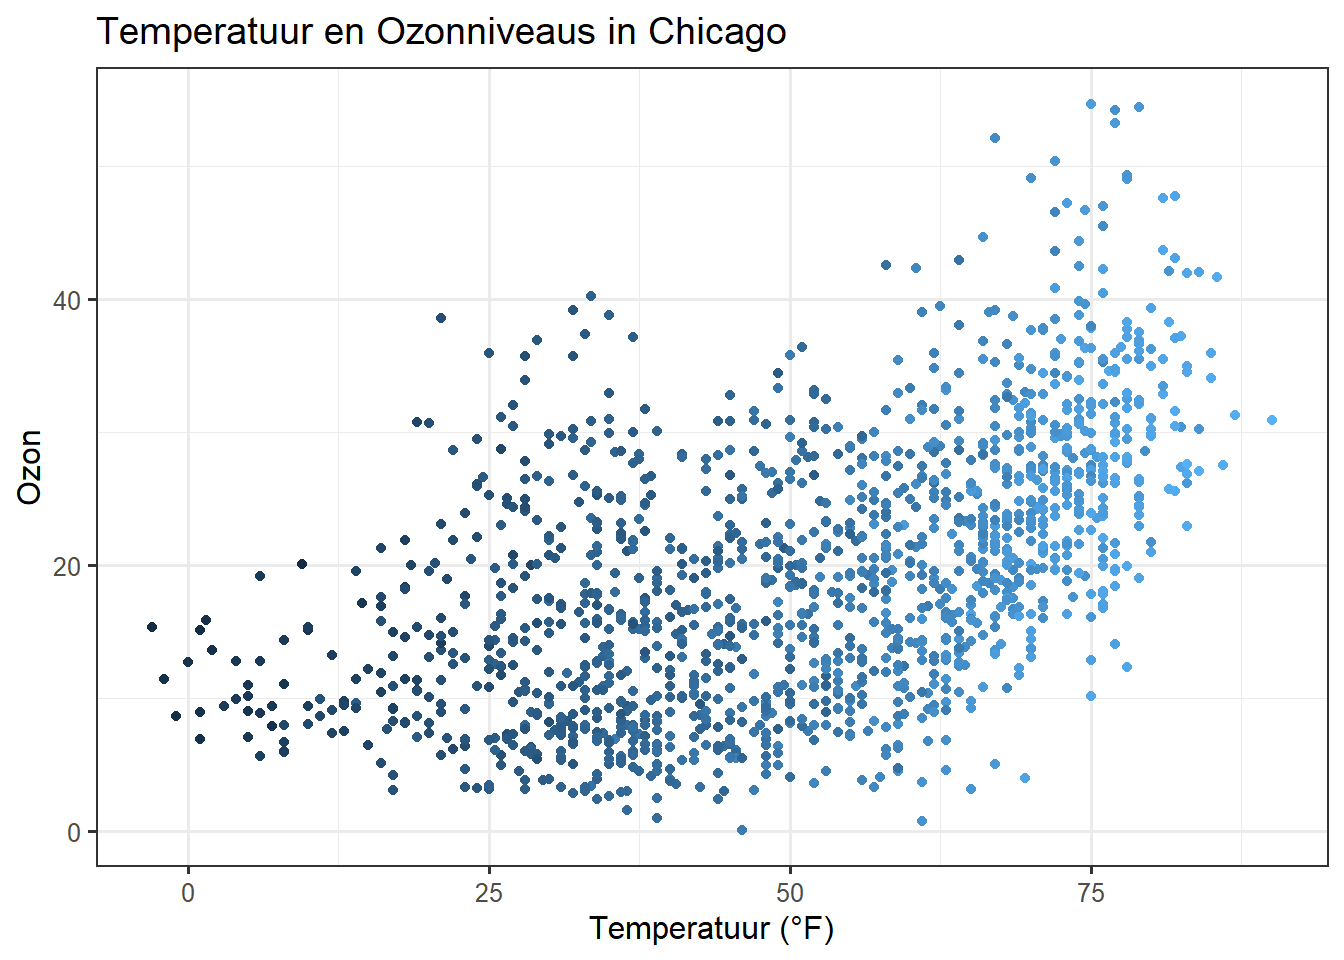
Verander het lettertype van alle tekstelementen
Het is ongelofelijk eenvoudig om de instellingen van alle tekst elementen in een keer te veranderen. Alle thema’s komen met een argument genaamd basis_familie:
g <- ggplot(chic, aes(x = date, y = temp)) +
geom_point(color = "firebrick") +
labs(x = "Jaar", y = "Temperatuur (°F)",
title = "Temperaturen in Chicago")
g + theme_bw(base_family = "Playfair")Warning in grid.Call(C_stringMetric, as.graphicsAnnot(x$label)): font family not
found in Windows font database
Warning in grid.Call(C_stringMetric, as.graphicsAnnot(x$label)): font family not
found in Windows font database
Warning in grid.Call(C_stringMetric, as.graphicsAnnot(x$label)): font family not
found in Windows font databaseWarning in grid.Call(C_textBounds, as.graphicsAnnot(x$label), x$x, x$y, : font
family not found in Windows font database
Warning in grid.Call(C_textBounds, as.graphicsAnnot(x$label), x$x, x$y, : font
family not found in Windows font database
Warning in grid.Call(C_textBounds, as.graphicsAnnot(x$label), x$x, x$y, : font
family not found in Windows font database
Warning in grid.Call(C_textBounds, as.graphicsAnnot(x$label), x$x, x$y, : font
family not found in Windows font database
Warning in grid.Call(C_textBounds, as.graphicsAnnot(x$label), x$x, x$y, : font
family not found in Windows font database
Warning in grid.Call(C_textBounds, as.graphicsAnnot(x$label), x$x, x$y, : font
family not found in Windows font database
Warning in grid.Call(C_textBounds, as.graphicsAnnot(x$label), x$x, x$y, : font
family not found in Windows font database
Warning in grid.Call(C_textBounds, as.graphicsAnnot(x$label), x$x, x$y, : font
family not found in Windows font database
Warning in grid.Call(C_textBounds, as.graphicsAnnot(x$label), x$x, x$y, : font
family not found in Windows font database
Warning in grid.Call(C_textBounds, as.graphicsAnnot(x$label), x$x, x$y, : font
family not found in Windows font databaseWarning in grid.Call.graphics(C_text, as.graphicsAnnot(x$label), x$x, x$y, :
font family not found in Windows font databaseWarning in grid.Call(C_textBounds, as.graphicsAnnot(x$label), x$x, x$y, : font
family not found in Windows font database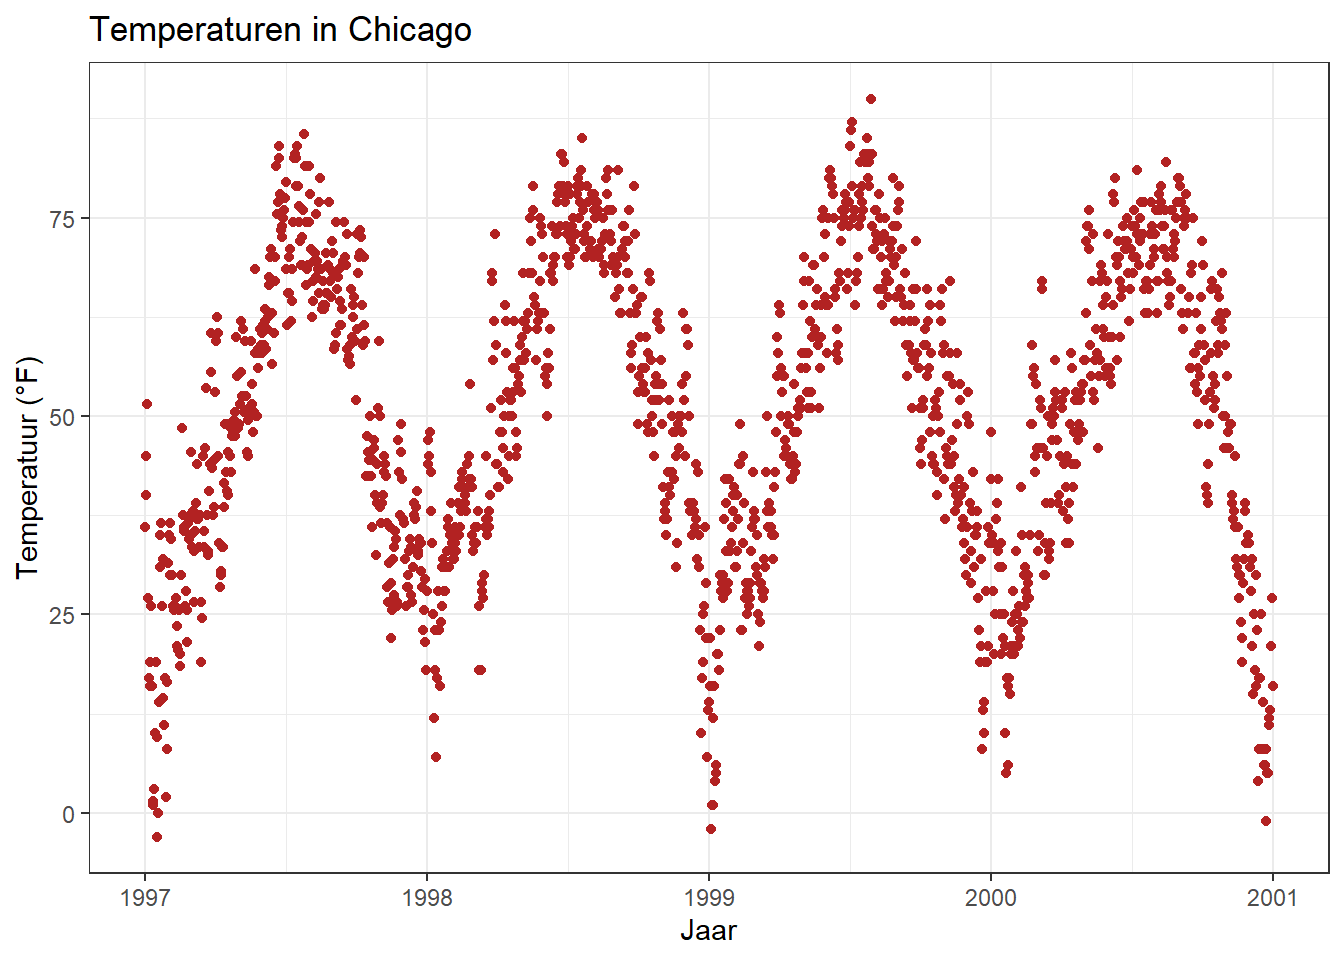
Verander de grootte van alle tekst elementen
De thema_*() functies hebben ook een aantal andere basis_* argumenten. Als je het standaard thema bekijkt (zie hoofdstuk “Maak en gebruik je eigen thema” hieronder) zul je zien dat de grootte van alle elementen relatief (rel()) is ten opzichte van de base_size. Als gevolg hiervan kunt u eenvoudig de base_size veranderen als u de leesbaarheid van uw plots wilt vergroten:
g + theme_bw(base_size = 20, base_family = "Roboto Condensed")Warning in grid.Call(C_stringMetric, as.graphicsAnnot(x$label)): font family not
found in Windows font databaseWarning in grid.Call(C_textBounds, as.graphicsAnnot(x$label), x$x, x$y, : font
family not found in Windows font database
Warning in grid.Call(C_textBounds, as.graphicsAnnot(x$label), x$x, x$y, : font
family not found in Windows font database
Warning in grid.Call(C_textBounds, as.graphicsAnnot(x$label), x$x, x$y, : font
family not found in Windows font database
Warning in grid.Call(C_textBounds, as.graphicsAnnot(x$label), x$x, x$y, : font
family not found in Windows font database
Warning in grid.Call(C_textBounds, as.graphicsAnnot(x$label), x$x, x$y, : font
family not found in Windows font database
Warning in grid.Call(C_textBounds, as.graphicsAnnot(x$label), x$x, x$y, : font
family not found in Windows font database
Warning in grid.Call(C_textBounds, as.graphicsAnnot(x$label), x$x, x$y, : font
family not found in Windows font database
Warning in grid.Call(C_textBounds, as.graphicsAnnot(x$label), x$x, x$y, : font
family not found in Windows font database
Warning in grid.Call(C_textBounds, as.graphicsAnnot(x$label), x$x, x$y, : font
family not found in Windows font database
Warning in grid.Call(C_textBounds, as.graphicsAnnot(x$label), x$x, x$y, : font
family not found in Windows font databaseWarning in grid.Call.graphics(C_text, as.graphicsAnnot(x$label), x$x, x$y, :
font family not found in Windows font databaseWarning in grid.Call(C_textBounds, as.graphicsAnnot(x$label), x$x, x$y, : font
family not found in Windows font database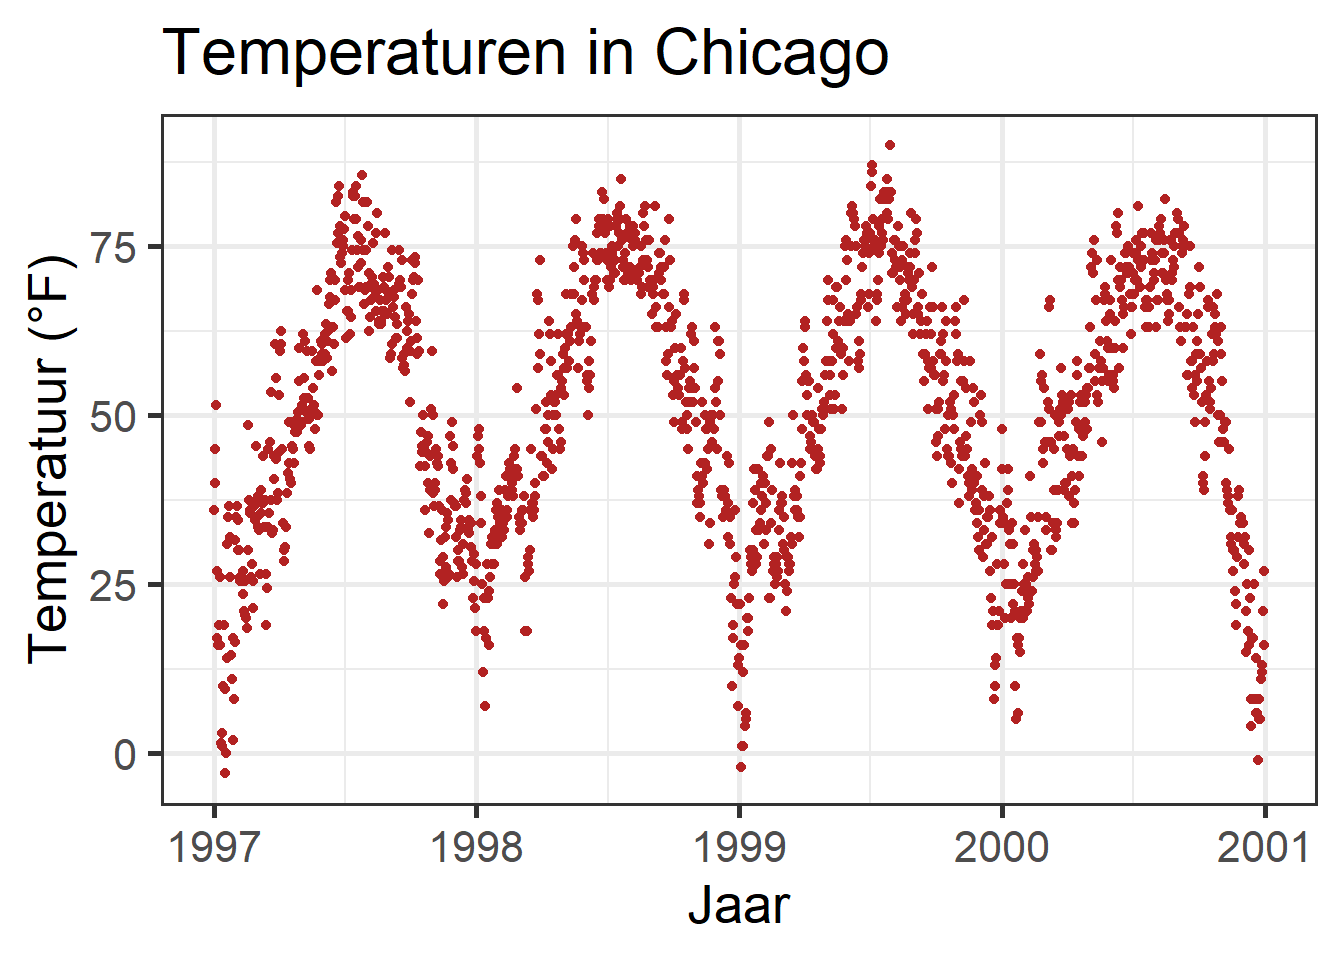
De grootte van alle lijn- en rechthoekelementen wijzigen
Op dezelfde manier kun je de grootte van alle elementen van het type lijn en recht wijzigen:
g + theme_bw(base_line_size = 1, base_rect_size = 1)
Maak je eigen thema
Als je het thema voor een hele sessie wilt veranderen, kun je theme_set gebruiken zoals in theme_set(theme_bw()). Het standaard thema heet theme_gray. Als je je eigen aangepaste thema wilt maken, zou je de code direct uit het grijze thema kunnen halen en aanpassen. Merk op dat de rel() functie de maten verandert ten opzichte van de base_size.
theme_grayfunction (base_size = 11, base_family = "", base_line_size = base_size/22,
base_rect_size = base_size/22)
{
half_line <- base_size/2
t <- theme(line = element_line(colour = "black", size = base_line_size,
linetype = 1, lineend = "butt"), rect = element_rect(fill = "white",
colour = "black", size = base_rect_size, linetype = 1),
text = element_text(family = base_family, face = "plain",
colour = "black", size = base_size, lineheight = 0.9,
hjust = 0.5, vjust = 0.5, angle = 0, margin = margin(),
debug = FALSE), axis.line = element_blank(), axis.line.x = NULL,
axis.line.y = NULL, axis.text = element_text(size = rel(0.8),
colour = "grey30"), axis.text.x = element_text(margin = margin(t = 0.8 *
half_line/2), vjust = 1), axis.text.x.top = element_text(margin = margin(b = 0.8 *
half_line/2), vjust = 0), axis.text.y = element_text(margin = margin(r = 0.8 *
half_line/2), hjust = 1), axis.text.y.right = element_text(margin = margin(l = 0.8 *
half_line/2), hjust = 0), axis.ticks = element_line(colour = "grey20"),
axis.ticks.length = unit(half_line/2, "pt"), axis.ticks.length.x = NULL,
axis.ticks.length.x.top = NULL, axis.ticks.length.x.bottom = NULL,
axis.ticks.length.y = NULL, axis.ticks.length.y.left = NULL,
axis.ticks.length.y.right = NULL, axis.title.x = element_text(margin = margin(t = half_line/2),
vjust = 1), axis.title.x.top = element_text(margin = margin(b = half_line/2),
vjust = 0), axis.title.y = element_text(angle = 90,
margin = margin(r = half_line/2), vjust = 1), axis.title.y.right = element_text(angle = -90,
margin = margin(l = half_line/2), vjust = 0), legend.background = element_rect(colour = NA),
legend.spacing = unit(2 * half_line, "pt"), legend.spacing.x = NULL,
legend.spacing.y = NULL, legend.margin = margin(half_line,
half_line, half_line, half_line), legend.key = element_rect(fill = "grey95",
colour = NA), legend.key.size = unit(1.2, "lines"),
legend.key.height = NULL, legend.key.width = NULL, legend.text = element_text(size = rel(0.8)),
legend.text.align = NULL, legend.title = element_text(hjust = 0),
legend.title.align = NULL, legend.position = "right",
legend.direction = NULL, legend.justification = "center",
legend.box = NULL, legend.box.margin = margin(0, 0, 0,
0, "cm"), legend.box.background = element_blank(),
legend.box.spacing = unit(2 * half_line, "pt"), panel.background = element_rect(fill = "grey92",
colour = NA), panel.border = element_blank(), panel.grid = element_line(colour = "white"),
panel.grid.minor = element_line(size = rel(0.5)), panel.spacing = unit(half_line,
"pt"), panel.spacing.x = NULL, panel.spacing.y = NULL,
panel.ontop = FALSE, strip.background = element_rect(fill = "grey85",
colour = NA), strip.text = element_text(colour = "grey10",
size = rel(0.8), margin = margin(0.8 * half_line,
0.8 * half_line, 0.8 * half_line, 0.8 * half_line)),
strip.text.x = NULL, strip.text.y = element_text(angle = -90),
strip.text.y.left = element_text(angle = 90), strip.placement = "inside",
strip.placement.x = NULL, strip.placement.y = NULL, strip.switch.pad.grid = unit(half_line/2,
"pt"), strip.switch.pad.wrap = unit(half_line/2,
"pt"), plot.background = element_rect(colour = "white"),
plot.title = element_text(size = rel(1.2), hjust = 0,
vjust = 1, margin = margin(b = half_line)), plot.title.position = "panel",
plot.subtitle = element_text(hjust = 0, vjust = 1, margin = margin(b = half_line)),
plot.caption = element_text(size = rel(0.8), hjust = 1,
vjust = 1, margin = margin(t = half_line)), plot.caption.position = "panel",
plot.tag = element_text(size = rel(1.2), hjust = 0.5,
vjust = 0.5), plot.tag.position = "topleft", plot.margin = margin(half_line,
half_line, half_line, half_line), complete = TRUE)
ggplot_global$theme_all_null %+replace% t
}
<bytecode: 0x0000000023963ba0>
<environment: namespace:ggplot2>Laten we nu de standaard themafunctie wijzigen en het resultaat bekijken:
theme_custom <- function (base_size = 12, base_family = "Roboto Condensed") {
half_line <- base_size/2
theme(
line = element_line(color = "black", size = .5,
linetype = 1, lineend = "butt"),
rect = element_rect(fill = "white", color = "black",
size = .5, linetype = 1),
text = element_text(family = base_family, face = "plain",
color = "black", size = base_size,
lineheight = .9, hjust = .5, vjust = .5,
angle = 0, margin = margin(), debug = FALSE),
axis.line = element_blank(),
axis.line.x = NULL,
axis.line.y = NULL,
axis.text = element_text(size = base_size * 1.1, color = "gray30"),
axis.text.x = element_text(margin = margin(t = .8 * half_line/2),
vjust = 1),
axis.text.x.top = element_text(margin = margin(b = .8 * half_line/2),
vjust = 0),
axis.text.y = element_text(margin = margin(r = .8 * half_line/2),
hjust = 1),
axis.text.y.right = element_text(margin = margin(l = .8 * half_line/2),
hjust = 0),
axis.ticks = element_line(color = "gray30", size = .7),
axis.ticks.length = unit(half_line / 1.5, "pt"),
axis.ticks.length.x = NULL,
axis.ticks.length.x.top = NULL,
axis.ticks.length.x.bottom = NULL,
axis.ticks.length.y = NULL,
axis.ticks.length.y.left = NULL,
axis.ticks.length.y.right = NULL,
axis.title.x = element_text(margin = margin(t = half_line),
vjust = 1, size = base_size * 1.3,
face = "bold"),
axis.title.x.top = element_text(margin = margin(b = half_line),
vjust = 0),
axis.title.y = element_text(angle = 90, vjust = 1,
margin = margin(r = half_line),
size = base_size * 1.3, face = "bold"),
axis.title.y.right = element_text(angle = -90, vjust = 0,
margin = margin(l = half_line)),
legend.background = element_rect(color = NA),
legend.spacing = unit(.4, "cm"),
legend.spacing.x = NULL,
legend.spacing.y = NULL,
legend.margin = margin(.2, .2, .2, .2, "cm"),
legend.key = element_rect(fill = "gray95", color = "white"),
legend.key.size = unit(1.2, "lines"),
legend.key.height = NULL,
legend.key.width = NULL,
legend.text = element_text(size = rel(.8)),
legend.text.align = NULL,
legend.title = element_text(hjust = 0),
legend.title.align = NULL,
legend.position = "right",
legend.direction = NULL,
legend.justification = "center",
legend.box = NULL,
legend.box.margin = margin(0, 0, 0, 0, "cm"),
legend.box.background = element_blank(),
legend.box.spacing = unit(.4, "cm"),
panel.background = element_rect(fill = "white", color = NA),
panel.border = element_rect(color = "gray30",
fill = NA, size = .7),
panel.grid.major = element_line(color = "gray90", size = 1),
panel.grid.minor = element_line(color = "gray90", size = .5,
linetype = "dashed"),
panel.spacing = unit(base_size, "pt"),
panel.spacing.x = NULL,
panel.spacing.y = NULL,
panel.ontop = FALSE,
strip.background = element_rect(fill = "white", color = "gray30"),
strip.text = element_text(color = "black", size = base_size),
strip.text.x = element_text(margin = margin(t = half_line,
b = half_line)),
strip.text.y = element_text(angle = -90,
margin = margin(l = half_line,
r = half_line)),
strip.text.y.left = element_text(angle = 90),
strip.placement = "inside",
strip.placement.x = NULL,
strip.placement.y = NULL,
strip.switch.pad.grid = unit(0.1, "cm"),
strip.switch.pad.wrap = unit(0.1, "cm"),
plot.background = element_rect(color = NA),
plot.title = element_text(size = base_size * 1.8, hjust = .5,
vjust = 1, face = "bold",
margin = margin(b = half_line * 1.2)),
plot.title.position = "panel",
plot.subtitle = element_text(size = base_size * 1.3,
hjust = .5, vjust = 1,
margin = margin(b = half_line * .9)),
plot.caption = element_text(size = rel(0.9), hjust = 1, vjust = 1,
margin = margin(t = half_line * .9)),
plot.caption.position = "panel",
plot.tag = element_text(size = rel(1.2), hjust = .5, vjust = .5),
plot.tag.position = "topleft",
plot.margin = margin(base_size, base_size, base_size, base_size),
complete = TRUE
)
}Je kunt alleen de standaardwaarden overschrijven voor alle elementen die je wilt veranderen. Hier heb ik ze allemaal opgesomd, zodat je kunt zien dat je letterlijk alles kunt veranderen!
Kijk eens naar de gewijzigde esthetiek met de nieuwe look van het paneel en de rasterlijnen, alsook de assen, teksten en titels:
theme_set(theme_custom())
ggplot(chic, aes(x = date, y = temp, color = season)) +
geom_point() + labs(x = "Jaar", y = "Temperatuur (°F)") + guides(color = FALSE)Warning: `guides(<scale> = FALSE)` is deprecated. Please use `guides(<scale> =
"none")` instead.Warning in grid.Call(C_stringMetric, as.graphicsAnnot(x$label)): font family not
found in Windows font database
Warning in grid.Call(C_stringMetric, as.graphicsAnnot(x$label)): font family not
found in Windows font databaseWarning in grid.Call(C_textBounds, as.graphicsAnnot(x$label), x$x, x$y, : font
family not found in Windows font database
Warning in grid.Call(C_textBounds, as.graphicsAnnot(x$label), x$x, x$y, : font
family not found in Windows font database
Warning in grid.Call(C_textBounds, as.graphicsAnnot(x$label), x$x, x$y, : font
family not found in Windows font database
Warning in grid.Call(C_textBounds, as.graphicsAnnot(x$label), x$x, x$y, : font
family not found in Windows font database
Warning in grid.Call(C_textBounds, as.graphicsAnnot(x$label), x$x, x$y, : font
family not found in Windows font database
Warning in grid.Call(C_textBounds, as.graphicsAnnot(x$label), x$x, x$y, : font
family not found in Windows font database
Warning in grid.Call(C_textBounds, as.graphicsAnnot(x$label), x$x, x$y, : font
family not found in Windows font databaseWarning in grid.Call.graphics(C_text, as.graphicsAnnot(x$label), x$x, x$y, :
font family not found in Windows font database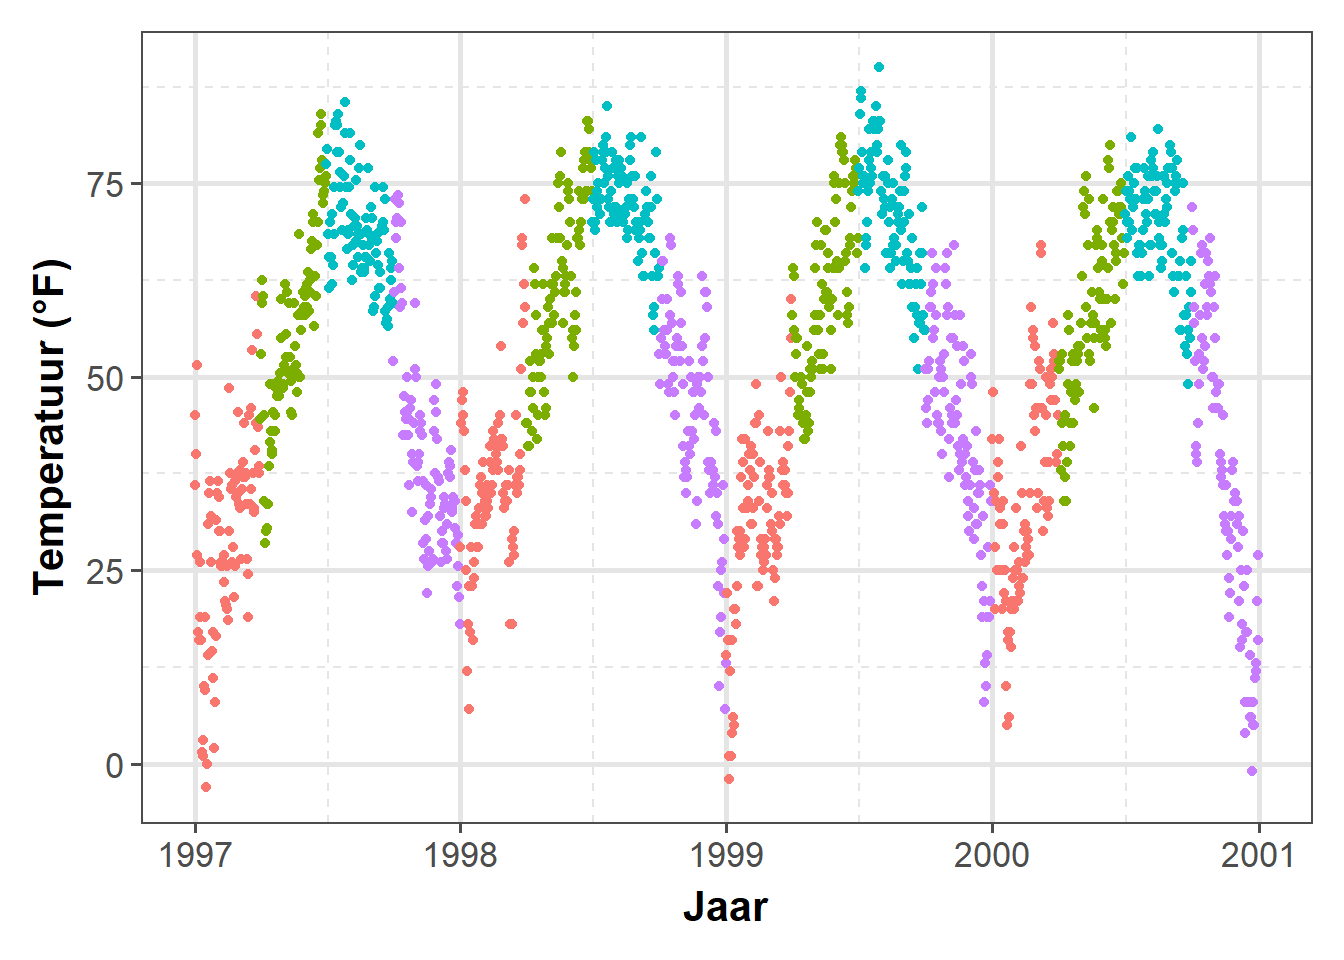
Deze manier om het plotontwerp te veranderen wordt sterk aanbevolen! Het stelt je in staat om snel elk element van jouw plots te veranderen door het eenmaal te veranderen. Je kunt binnen enkele seconden al uw resultaten in een congruente stijl plotten en het aan andere behoeften aanpassen (b.v. een presentatie met grotere lettergrootte of tijdschriftvereisten).
Het huidige thema bijwerken
Je kunt ook snelle veranderingen instellen met theme_update():
theme_custom <- theme_update(panel.background = element_rect(fill = "gray60"))
ggplot(chic, aes(x = date, y = temp, color = season)) +
geom_point() + labs(x = "Jaar", y = "Temperatuur (°F)") + guides(color = FALSE)Warning: `guides(<scale> = FALSE)` is deprecated. Please use `guides(<scale> =
"none")` instead.Warning in grid.Call(C_textBounds, as.graphicsAnnot(x$label), x$x, x$y, : font
family not found in Windows font database
Warning in grid.Call(C_textBounds, as.graphicsAnnot(x$label), x$x, x$y, : font
family not found in Windows font database
Warning in grid.Call(C_textBounds, as.graphicsAnnot(x$label), x$x, x$y, : font
family not found in Windows font database
Warning in grid.Call(C_textBounds, as.graphicsAnnot(x$label), x$x, x$y, : font
family not found in Windows font database
Warning in grid.Call(C_textBounds, as.graphicsAnnot(x$label), x$x, x$y, : font
family not found in Windows font database
Warning in grid.Call(C_textBounds, as.graphicsAnnot(x$label), x$x, x$y, : font
family not found in Windows font database
Warning in grid.Call(C_textBounds, as.graphicsAnnot(x$label), x$x, x$y, : font
family not found in Windows font databaseWarning in grid.Call.graphics(C_text, as.graphicsAnnot(x$label), x$x, x$y, :
font family not found in Windows font database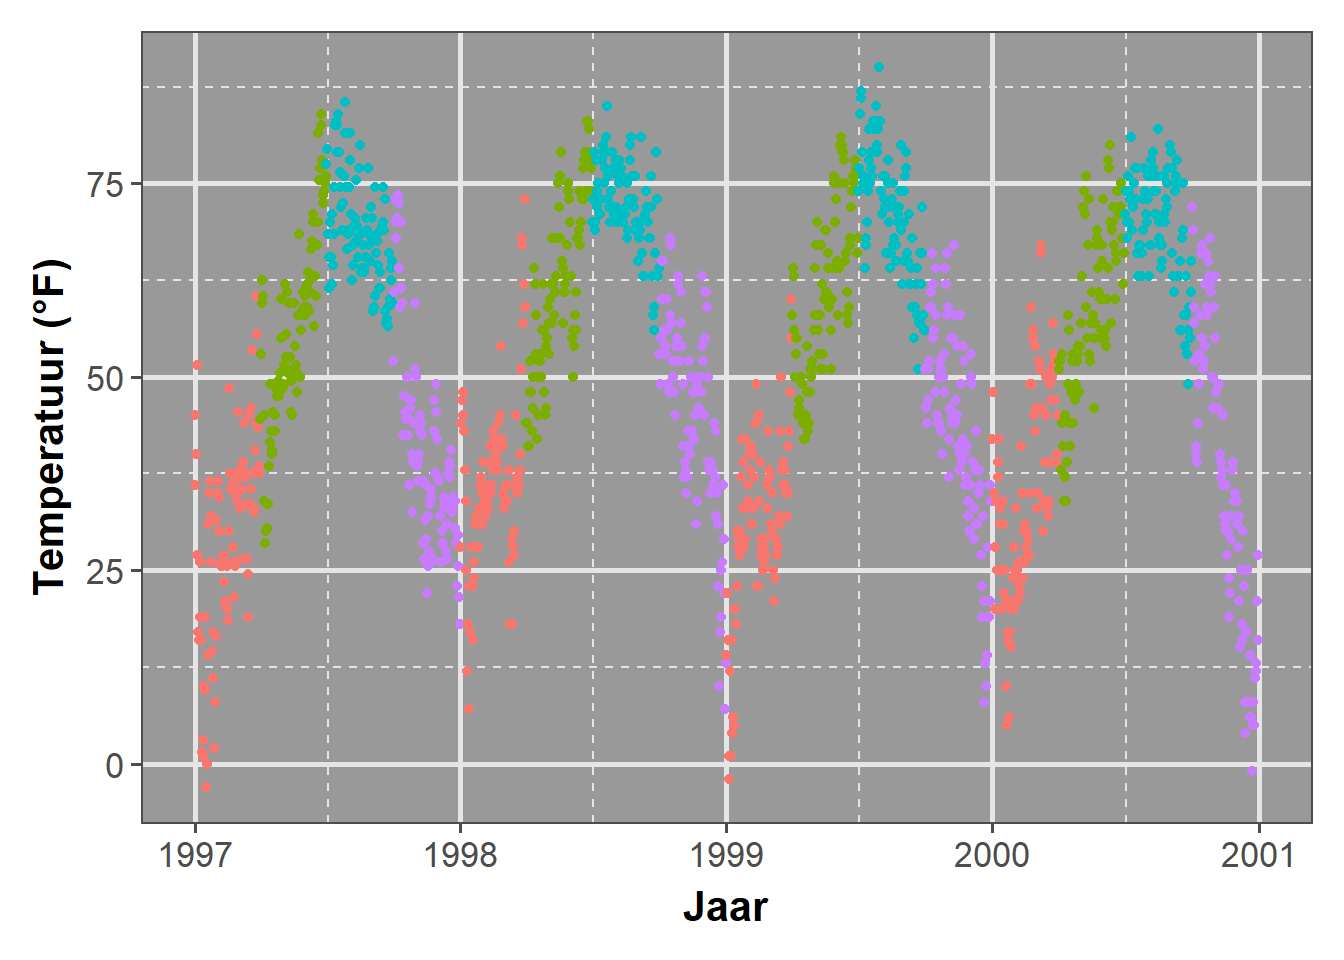
Voor verdere oefeningen gaan we ons eigen thema gebruiken met een witte vulling en zonder de kleine rasterlijnen:
theme_custom <- theme_update(panel.background = element_rect(fill = "white"),
panel.grid.major = element_line(size = .5),
panel.grid.minor = element_blank())Werken met lijnen
Horizontaal of verticaal lijnen toevoegen aan een plot
Het kan zijn dat je een bepaald bereik of een bepaalde drempel wilt markeren, wat je kunt doen door een lijn te plotten op gedefinieerde coördinaten met geom_hline() (voor “horizontale lijnen”) of geom_vline() (voor “verticale lijnen”):
ggplot(chic, aes(x = date, y = temp, color = o3)) +
geom_point() +
geom_hline(yintercept = c(0, 73)) +
labs(x = "Jaar", y = "Temperatuur (°F)")Warning in grid.Call(C_textBounds, as.graphicsAnnot(x$label), x$x, x$y, : font
family not found in Windows font database
Warning in grid.Call(C_textBounds, as.graphicsAnnot(x$label), x$x, x$y, : font
family not found in Windows font database
Warning in grid.Call(C_textBounds, as.graphicsAnnot(x$label), x$x, x$y, : font
family not found in Windows font database
Warning in grid.Call(C_textBounds, as.graphicsAnnot(x$label), x$x, x$y, : font
family not found in Windows font database
Warning in grid.Call(C_textBounds, as.graphicsAnnot(x$label), x$x, x$y, : font
family not found in Windows font database
Warning in grid.Call(C_textBounds, as.graphicsAnnot(x$label), x$x, x$y, : font
family not found in Windows font database
Warning in grid.Call(C_textBounds, as.graphicsAnnot(x$label), x$x, x$y, : font
family not found in Windows font database
Warning in grid.Call(C_textBounds, as.graphicsAnnot(x$label), x$x, x$y, : font
family not found in Windows font database
Warning in grid.Call(C_textBounds, as.graphicsAnnot(x$label), x$x, x$y, : font
family not found in Windows font databaseWarning in grid.Call.graphics(C_text, as.graphicsAnnot(x$label), x$x, x$y, :
font family not found in Windows font databaseWarning in grid.Call(C_textBounds, as.graphicsAnnot(x$label), x$x, x$y, : font
family not found in Windows font database
Warning in grid.Call(C_textBounds, as.graphicsAnnot(x$label), x$x, x$y, : font
family not found in Windows font database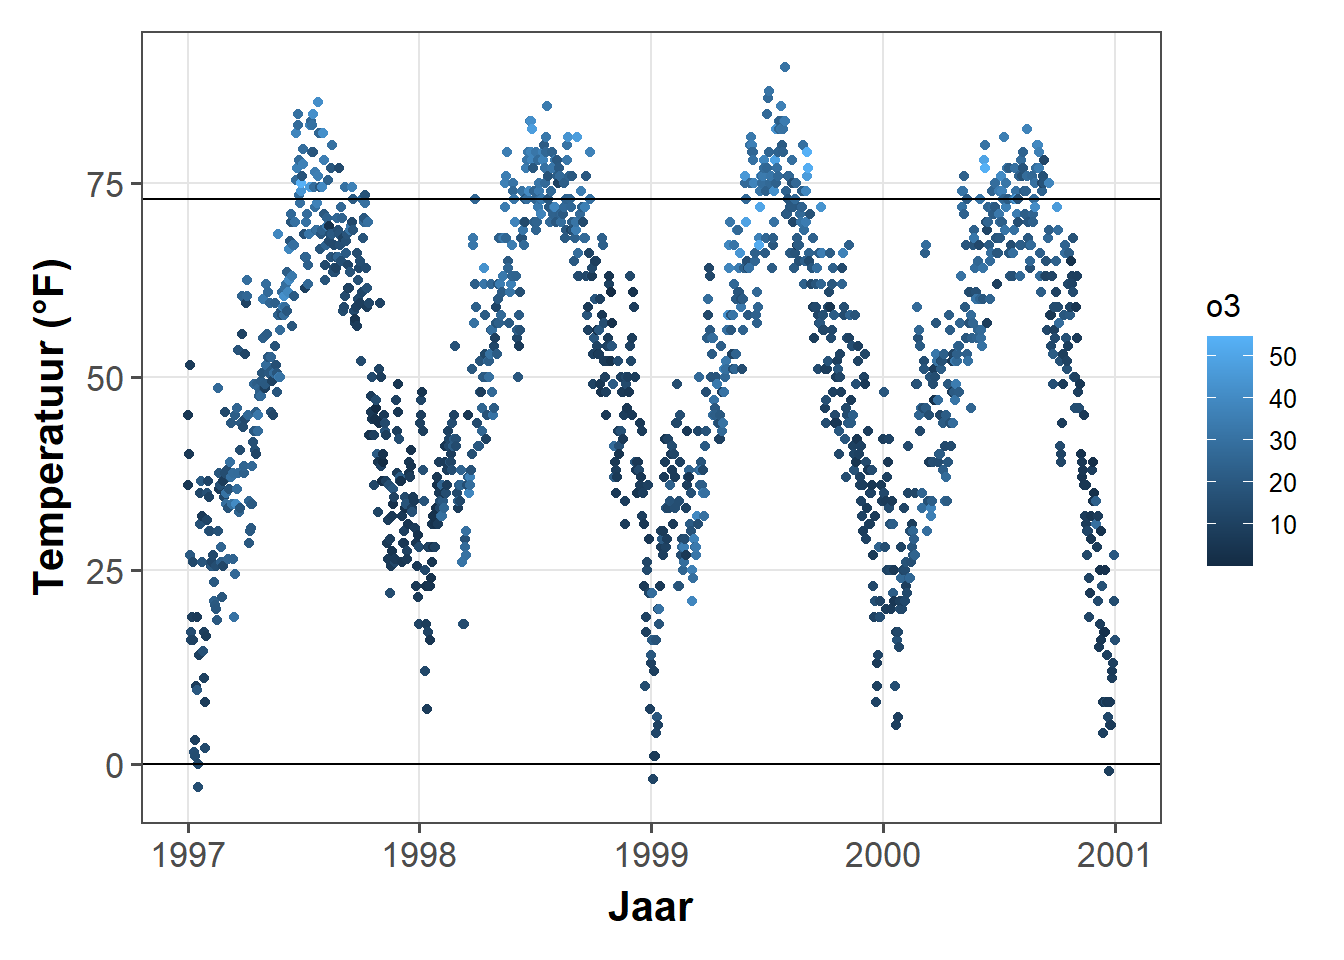
g <- ggplot(chic, aes(x = temp, y = dewpoint)) +
geom_point(color = "dodgerblue", alpha = .5) +
labs(x = "Temperatuur (°F)", y = "Dauwpunt")
g +
geom_vline(aes(xintercept = median(temp)), size = 1.5,
color = "firebrick", linetype = "dashed") +
geom_hline(aes(yintercept = median(dewpoint)), size = 1.5,
color = "firebrick", linetype = "dashed")Warning in grid.Call(C_textBounds, as.graphicsAnnot(x$label), x$x, x$y, : font
family not found in Windows font database
Warning in grid.Call(C_textBounds, as.graphicsAnnot(x$label), x$x, x$y, : font
family not found in Windows font database
Warning in grid.Call(C_textBounds, as.graphicsAnnot(x$label), x$x, x$y, : font
family not found in Windows font database
Warning in grid.Call(C_textBounds, as.graphicsAnnot(x$label), x$x, x$y, : font
family not found in Windows font database
Warning in grid.Call(C_textBounds, as.graphicsAnnot(x$label), x$x, x$y, : font
family not found in Windows font database
Warning in grid.Call(C_textBounds, as.graphicsAnnot(x$label), x$x, x$y, : font
family not found in Windows font database
Warning in grid.Call(C_textBounds, as.graphicsAnnot(x$label), x$x, x$y, : font
family not found in Windows font databaseWarning in grid.Call.graphics(C_text, as.graphicsAnnot(x$label), x$x, x$y, :
font family not found in Windows font database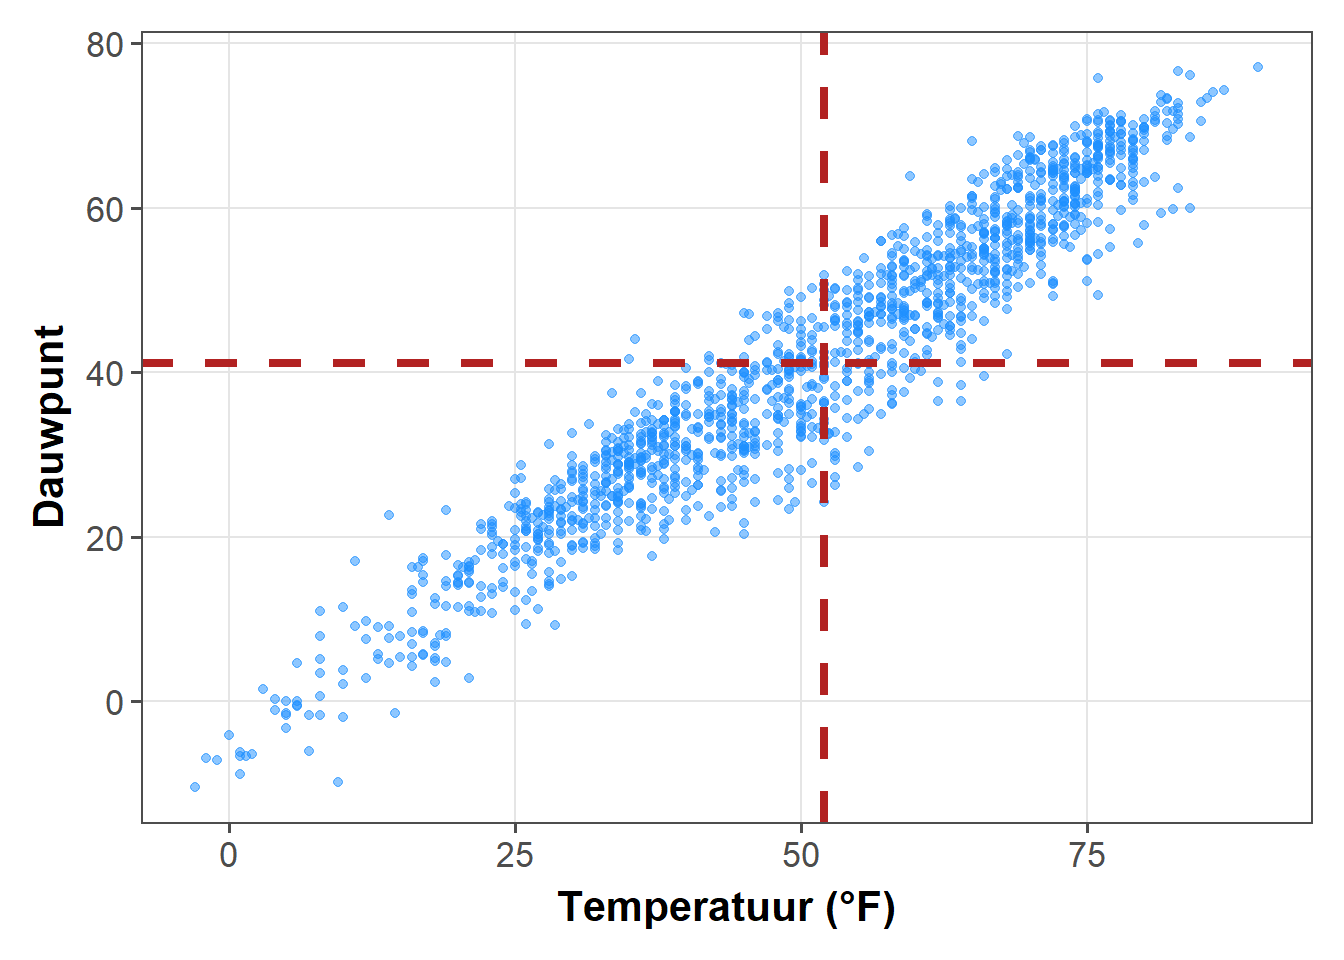
Als je een lijn wilt toevoegen waarvan de helling niet 0 of 1 is, dan moet je geom_abline() gebruiken. Dit is bijvoorbeeld het geval als je een regressielijn wilt toevoegen met de argumenten intercept en helling:
reg <- lm(dewpoint ~ temp, data = chic)
g +
geom_abline(intercept = coefficients(reg)[1],
slope = coefficients(reg)[2],
color = "darkorange2", size = 1.5) +
labs(title = paste0("y = ", round(coefficients(reg)[2], 2),
" * x + ", round(coefficients(reg)[1], 2)))Warning in grid.Call(C_stringMetric, as.graphicsAnnot(x$label)): font family not
found in Windows font databaseWarning in grid.Call(C_textBounds, as.graphicsAnnot(x$label), x$x, x$y, : font
family not found in Windows font database
Warning in grid.Call(C_textBounds, as.graphicsAnnot(x$label), x$x, x$y, : font
family not found in Windows font database
Warning in grid.Call(C_textBounds, as.graphicsAnnot(x$label), x$x, x$y, : font
family not found in Windows font database
Warning in grid.Call(C_textBounds, as.graphicsAnnot(x$label), x$x, x$y, : font
family not found in Windows font database
Warning in grid.Call(C_textBounds, as.graphicsAnnot(x$label), x$x, x$y, : font
family not found in Windows font database
Warning in grid.Call(C_textBounds, as.graphicsAnnot(x$label), x$x, x$y, : font
family not found in Windows font database
Warning in grid.Call(C_textBounds, as.graphicsAnnot(x$label), x$x, x$y, : font
family not found in Windows font database
Warning in grid.Call(C_textBounds, as.graphicsAnnot(x$label), x$x, x$y, : font
family not found in Windows font database
Warning in grid.Call(C_textBounds, as.graphicsAnnot(x$label), x$x, x$y, : font
family not found in Windows font database
Warning in grid.Call(C_textBounds, as.graphicsAnnot(x$label), x$x, x$y, : font
family not found in Windows font databaseWarning in grid.Call.graphics(C_text, as.graphicsAnnot(x$label), x$x, x$y, :
font family not found in Windows font databaseWarning in grid.Call(C_textBounds, as.graphicsAnnot(x$label), x$x, x$y, : font
family not found in Windows font database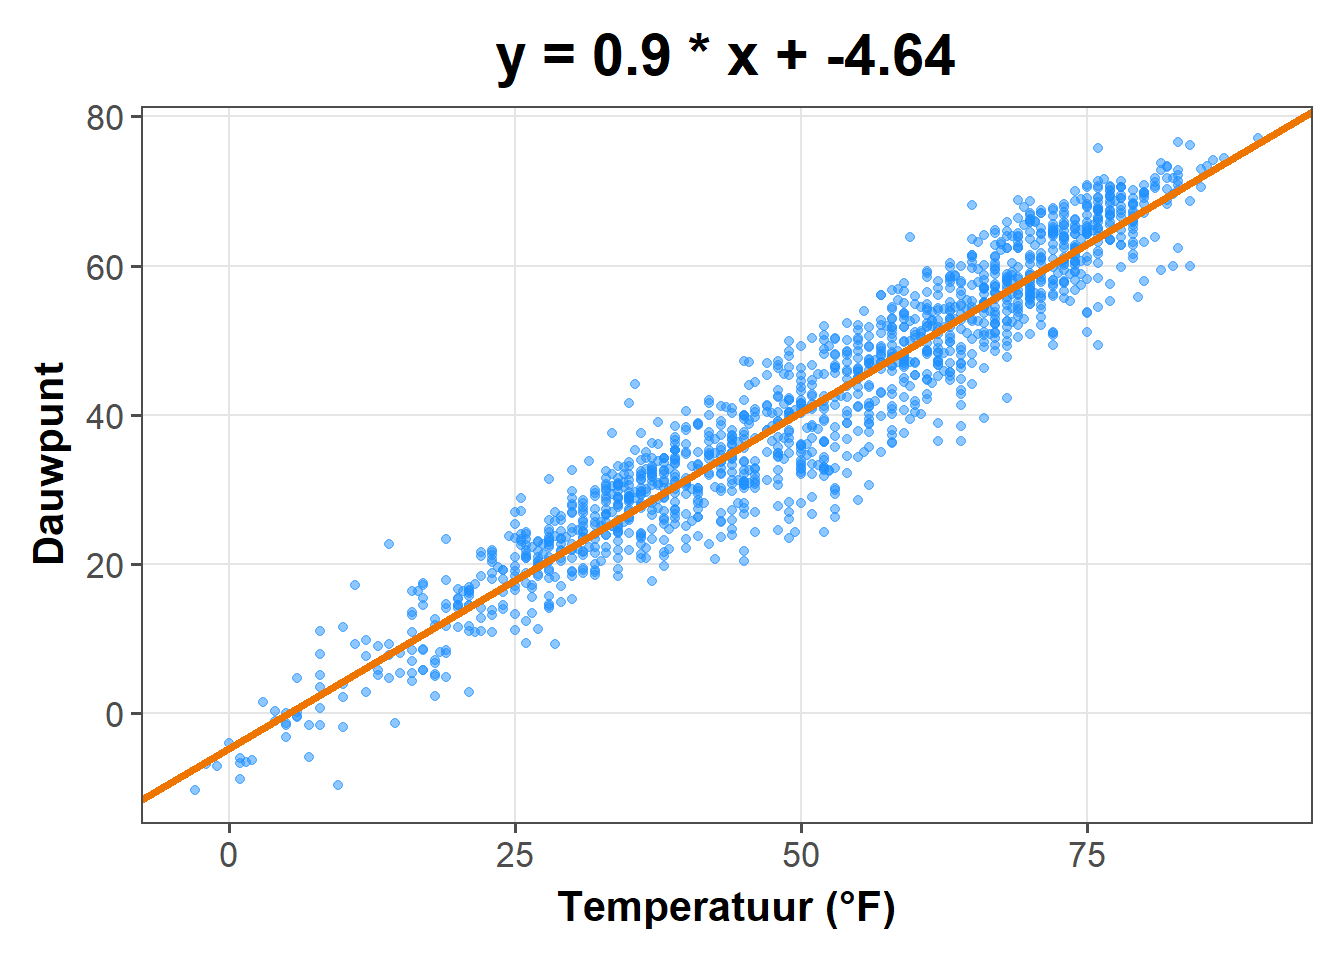
Later zullen we leren hoe we met één commando een lineaire fit kunnen toevoegen met stat_smooth(method = "lm"). Er kunnen echter andere redenen zijn om een lijn met een gegeven helling toe te voegen en dit is hoe men dat doet.
Een lijn toevoegen binnen een Plot
De vorige benaderingen besloegen altijd het hele bereik van het plotpaneel. Soms oms wil je alleen een bepaald gebied markeren of lijnen gebruiken voor annotaties. In dit geval is geom_linerange() er om te helpen:
g +
## vertical line
geom_linerange(aes(x = 50, ymin = 20, ymax = 55),
color = "steelblue", size = 2) +
## horizontal line
geom_linerange(aes(xmin = -Inf, xmax = 25, y = 0),
color = "red", size = 1)Warning in grid.Call(C_textBounds, as.graphicsAnnot(x$label), x$x, x$y, : font
family not found in Windows font database
Warning in grid.Call(C_textBounds, as.graphicsAnnot(x$label), x$x, x$y, : font
family not found in Windows font database
Warning in grid.Call(C_textBounds, as.graphicsAnnot(x$label), x$x, x$y, : font
family not found in Windows font database
Warning in grid.Call(C_textBounds, as.graphicsAnnot(x$label), x$x, x$y, : font
family not found in Windows font database
Warning in grid.Call(C_textBounds, as.graphicsAnnot(x$label), x$x, x$y, : font
family not found in Windows font database
Warning in grid.Call(C_textBounds, as.graphicsAnnot(x$label), x$x, x$y, : font
family not found in Windows font database
Warning in grid.Call(C_textBounds, as.graphicsAnnot(x$label), x$x, x$y, : font
family not found in Windows font databaseWarning in grid.Call.graphics(C_text, as.graphicsAnnot(x$label), x$x, x$y, :
font family not found in Windows font database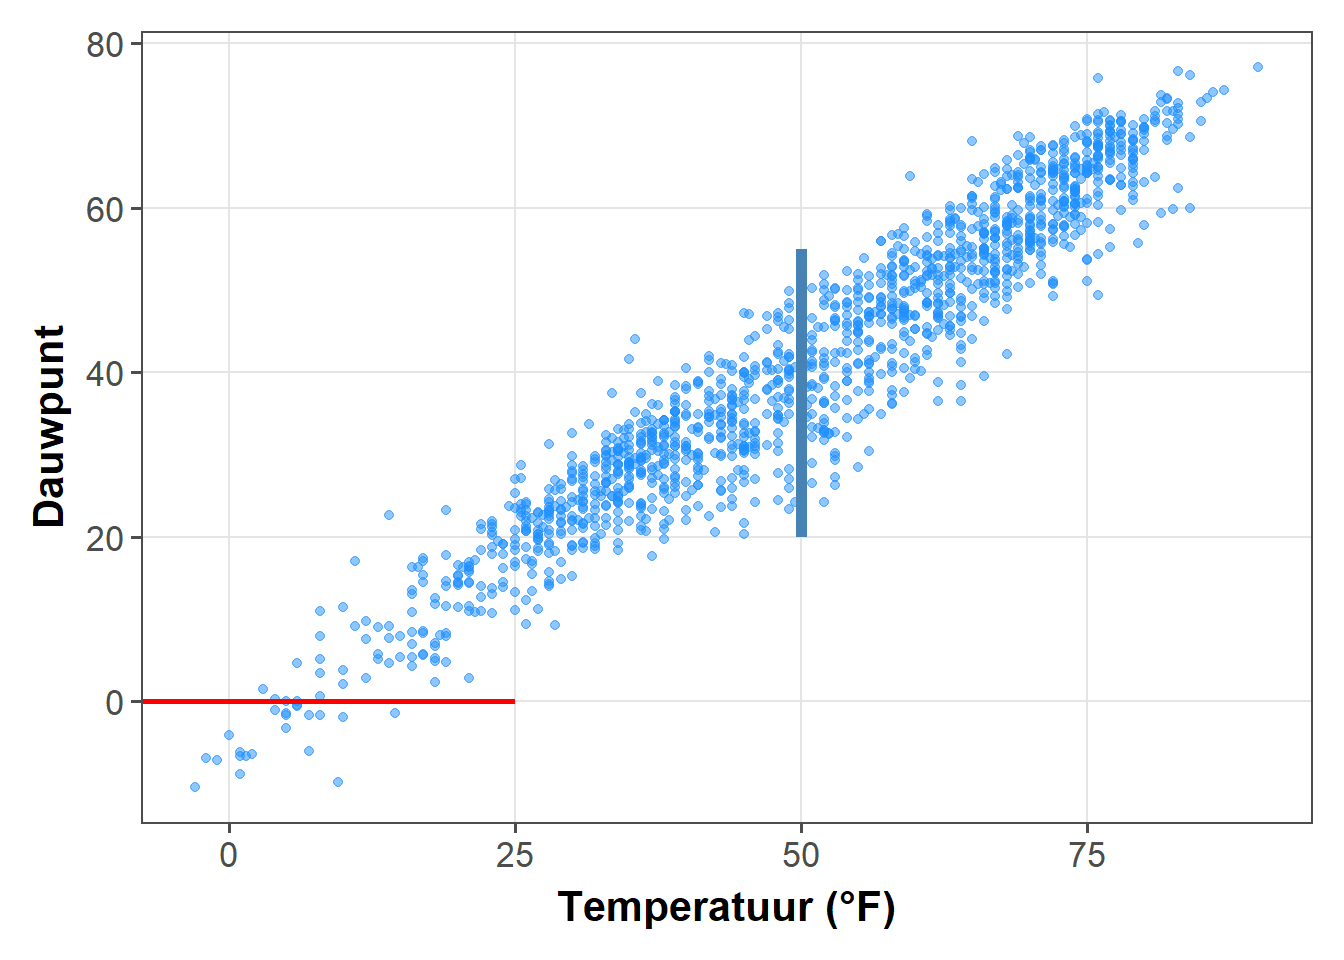
Of je kunt geom_segment() gebruiken om lijnen te tekenen met een helling verschillend van 0 en 1:
g +
geom_segment(aes(x = 50, xend = 75,
y = 20, yend = 45),
color = "purple", size = 2)Warning in grid.Call(C_textBounds, as.graphicsAnnot(x$label), x$x, x$y, : font
family not found in Windows font database
Warning in grid.Call(C_textBounds, as.graphicsAnnot(x$label), x$x, x$y, : font
family not found in Windows font database
Warning in grid.Call(C_textBounds, as.graphicsAnnot(x$label), x$x, x$y, : font
family not found in Windows font database
Warning in grid.Call(C_textBounds, as.graphicsAnnot(x$label), x$x, x$y, : font
family not found in Windows font database
Warning in grid.Call(C_textBounds, as.graphicsAnnot(x$label), x$x, x$y, : font
family not found in Windows font database
Warning in grid.Call(C_textBounds, as.graphicsAnnot(x$label), x$x, x$y, : font
family not found in Windows font database
Warning in grid.Call(C_textBounds, as.graphicsAnnot(x$label), x$x, x$y, : font
family not found in Windows font databaseWarning in grid.Call.graphics(C_text, as.graphicsAnnot(x$label), x$x, x$y, :
font family not found in Windows font database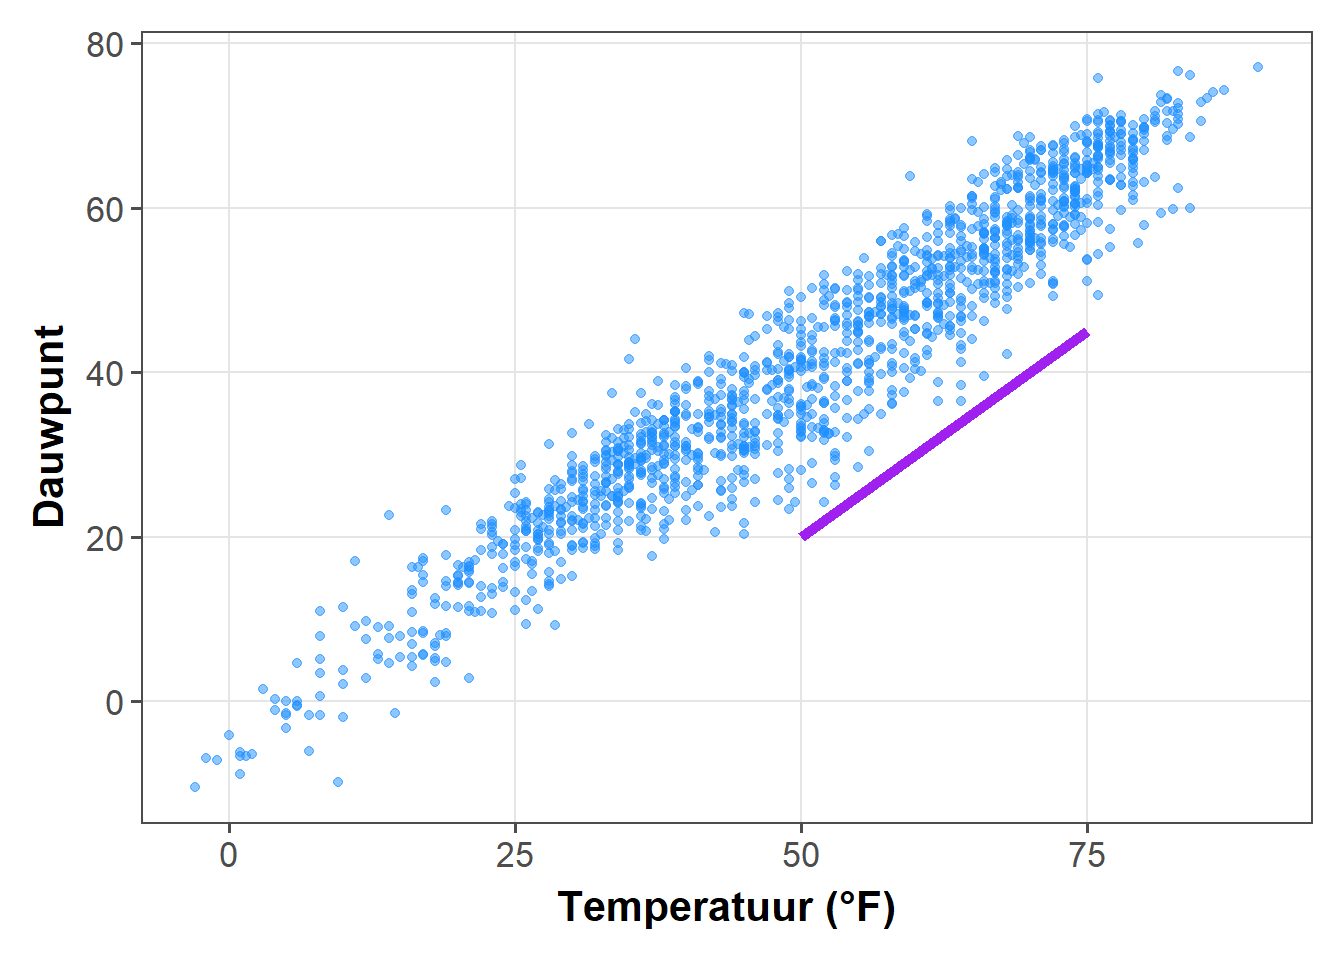
Kromme lijnen en pijlen toevoegen aan een Plot
geom_curve() voegt krommen toe. Nou ja, en rechte lijnen als je wilt:
g +
geom_curve(aes(x = 0, y = 60, xend = 75, yend = 0),
size = 2, color = "tan") +
geom_curve(aes(x = 0, y = 60, xend = 75, yend = 0),
curvature = -0.7, angle = 45,
color = "darkgoldenrod1", size = 1) +
geom_curve(aes(x = 0, y = 60, xend = 75, yend = 0),
curvature = 0, size = 1.5)Warning in grid.Call(C_textBounds, as.graphicsAnnot(x$label), x$x, x$y, : font
family not found in Windows font database
Warning in grid.Call(C_textBounds, as.graphicsAnnot(x$label), x$x, x$y, : font
family not found in Windows font database
Warning in grid.Call(C_textBounds, as.graphicsAnnot(x$label), x$x, x$y, : font
family not found in Windows font database
Warning in grid.Call(C_textBounds, as.graphicsAnnot(x$label), x$x, x$y, : font
family not found in Windows font database
Warning in grid.Call(C_textBounds, as.graphicsAnnot(x$label), x$x, x$y, : font
family not found in Windows font database
Warning in grid.Call(C_textBounds, as.graphicsAnnot(x$label), x$x, x$y, : font
family not found in Windows font database
Warning in grid.Call(C_textBounds, as.graphicsAnnot(x$label), x$x, x$y, : font
family not found in Windows font databaseWarning in grid.Call.graphics(C_text, as.graphicsAnnot(x$label), x$x, x$y, :
font family not found in Windows font database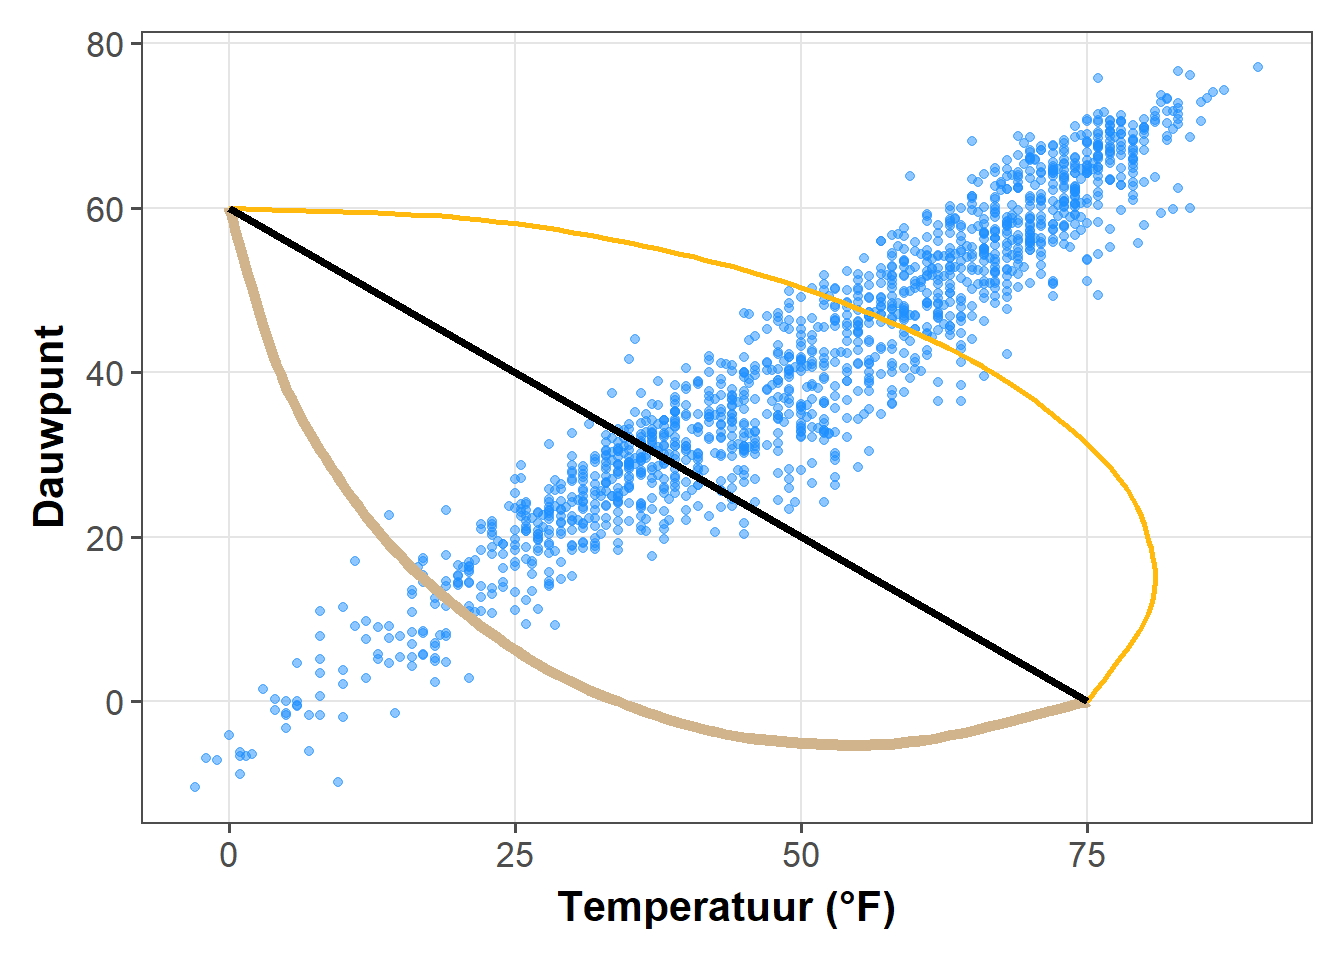
Dezelfde geom kan worden gebruikt om pijlen te tekenen:
g +
geom_curve(aes(x = 0, y = 60, xend = 75, yend = 0),
size = 2, color = "tan",
arrow = arrow(length = unit(0.07, "npc"))) +
geom_curve(aes(x = 5, y = 55, xend = 70, yend = 5),
curvature = -0.7, angle = 45,
color = "darkgoldenrod1", size = 1,
arrow = arrow(length = unit(0.03, "npc"),
type = "closed",
ends = "both"))Warning in grid.Call(C_textBounds, as.graphicsAnnot(x$label), x$x, x$y, : font
family not found in Windows font database
Warning in grid.Call(C_textBounds, as.graphicsAnnot(x$label), x$x, x$y, : font
family not found in Windows font database
Warning in grid.Call(C_textBounds, as.graphicsAnnot(x$label), x$x, x$y, : font
family not found in Windows font database
Warning in grid.Call(C_textBounds, as.graphicsAnnot(x$label), x$x, x$y, : font
family not found in Windows font database
Warning in grid.Call(C_textBounds, as.graphicsAnnot(x$label), x$x, x$y, : font
family not found in Windows font database
Warning in grid.Call(C_textBounds, as.graphicsAnnot(x$label), x$x, x$y, : font
family not found in Windows font database
Warning in grid.Call(C_textBounds, as.graphicsAnnot(x$label), x$x, x$y, : font
family not found in Windows font databaseWarning in grid.Call.graphics(C_text, as.graphicsAnnot(x$label), x$x, x$y, :
font family not found in Windows font database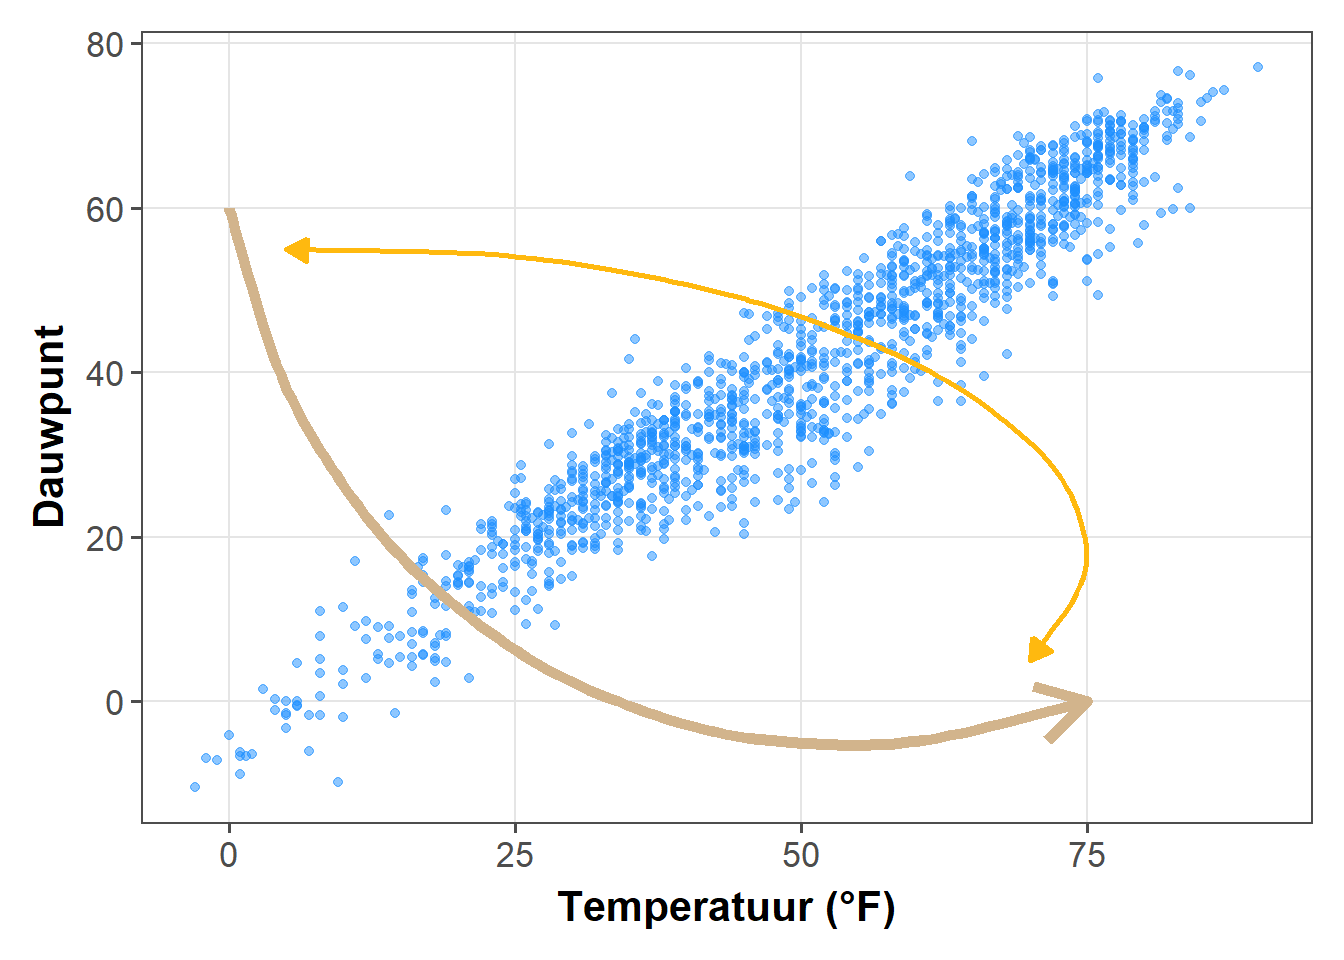
Werken met tekst
Labels toevoegen aan uw gegevens
Soms willen wij onze gegevenspunten labelen. Om overlapping en verdringing door tekstlabels te voorkomen, gebruiken we een 1% steekproef van de originele data, die gelijkelijk de vier seizoenen vertegenwoordigt. We gebruiken geom_label() dat een nieuwe esthetiek bevat, genaamd label:
set.seed(2020)
library(dplyr)
sample <- chic %>%
dplyr::group_by(season) %>%
dplyr::sample_frac(0.01)
## code without pipes:
## sample <- sample_frac(group_by(chic, season), .01)
ggplot(sample, aes(x = date, y = temp, color = season)) +
geom_point() +
geom_label(aes(label = season), hjust = .5, vjust = -.5) +
labs(x = "Jaar", y = "Temperatuur (°F)") +
xlim(as.Date(c('1997-01-01', '2000-12-31'))) +
ylim(c(0, 90)) +
theme(legend.position = "none")Warning in grid.Call(C_textBounds, as.graphicsAnnot(x$label), x$x, x$y, : font
family not found in Windows font database
Warning in grid.Call(C_textBounds, as.graphicsAnnot(x$label), x$x, x$y, : font
family not found in Windows font database
Warning in grid.Call(C_textBounds, as.graphicsAnnot(x$label), x$x, x$y, : font
family not found in Windows font database
Warning in grid.Call(C_textBounds, as.graphicsAnnot(x$label), x$x, x$y, : font
family not found in Windows font database
Warning in grid.Call(C_textBounds, as.graphicsAnnot(x$label), x$x, x$y, : font
family not found in Windows font database
Warning in grid.Call(C_textBounds, as.graphicsAnnot(x$label), x$x, x$y, : font
family not found in Windows font database
Warning in grid.Call(C_textBounds, as.graphicsAnnot(x$label), x$x, x$y, : font
family not found in Windows font databaseWarning in grid.Call.graphics(C_text, as.graphicsAnnot(x$label), x$x, x$y, :
font family not found in Windows font database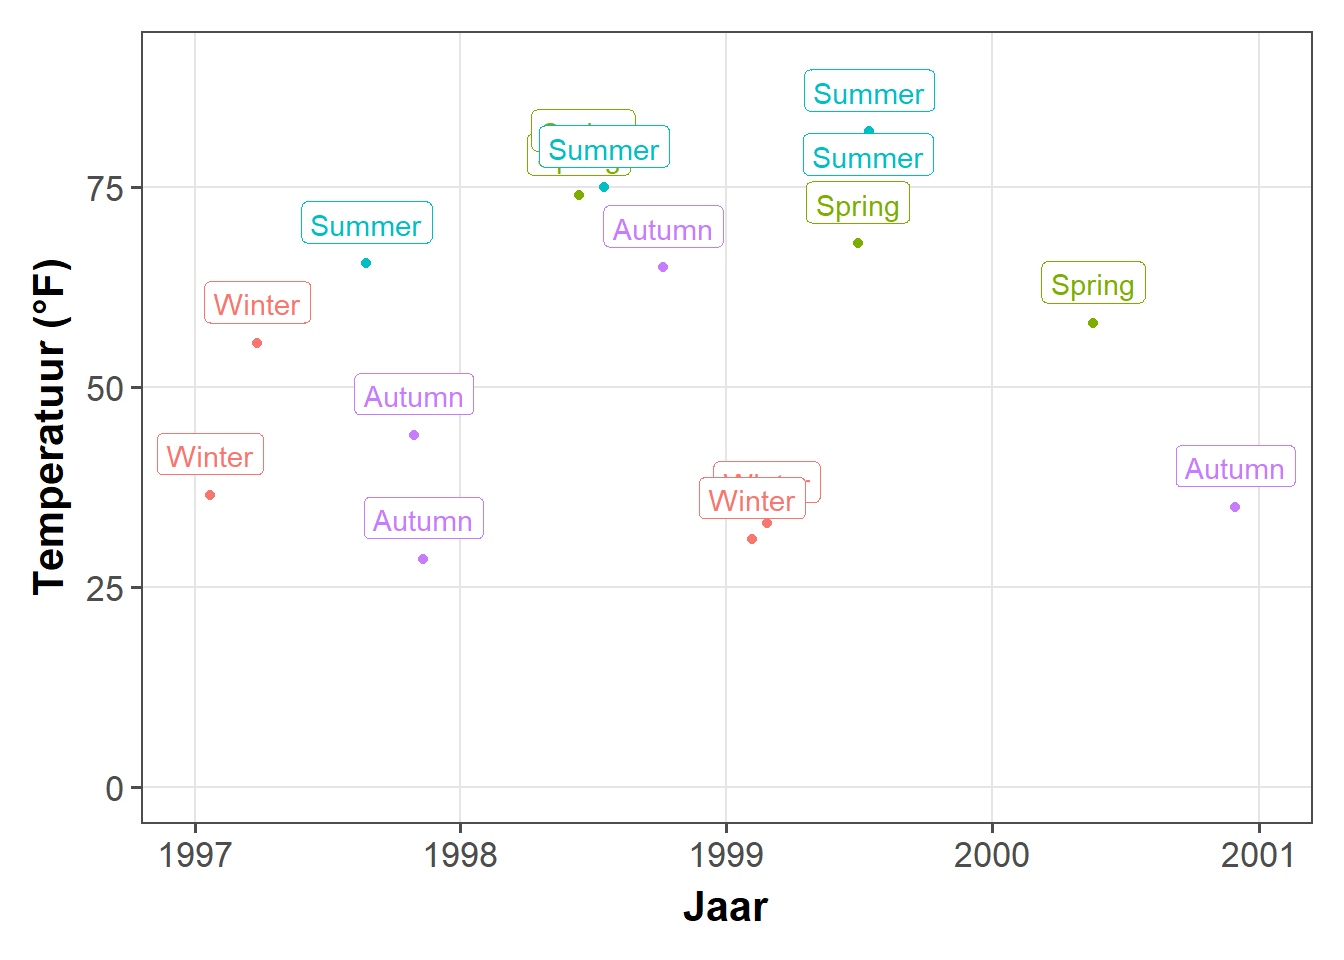
Oké, het vermijden van overlappende labels is niet gelukt. Maar maak je geen zorgen, we gaan het in een minuutje oplossen!
Je kunt ook
geom_text()gebruiken als je niet van kaders rond je labels houdt.
ggplot(sample, aes(x = date, y = temp, color = season)) +
geom_point() +
geom_text(aes(label = season), fontface = "bold",
hjust = .5, vjust = -.25) +
labs(x = "Jaar", y = "Temperatuur (°F)") +
xlim(as.Date(c('1997-01-01', '2000-12-31'))) +
ylim(c(0, 90)) +
theme(legend.position = "none")Warning in grid.Call(C_textBounds, as.graphicsAnnot(x$label), x$x, x$y, : font
family not found in Windows font database
Warning in grid.Call(C_textBounds, as.graphicsAnnot(x$label), x$x, x$y, : font
family not found in Windows font database
Warning in grid.Call(C_textBounds, as.graphicsAnnot(x$label), x$x, x$y, : font
family not found in Windows font database
Warning in grid.Call(C_textBounds, as.graphicsAnnot(x$label), x$x, x$y, : font
family not found in Windows font database
Warning in grid.Call(C_textBounds, as.graphicsAnnot(x$label), x$x, x$y, : font
family not found in Windows font database
Warning in grid.Call(C_textBounds, as.graphicsAnnot(x$label), x$x, x$y, : font
family not found in Windows font database
Warning in grid.Call(C_textBounds, as.graphicsAnnot(x$label), x$x, x$y, : font
family not found in Windows font databaseWarning in grid.Call.graphics(C_text, as.graphicsAnnot(x$label), x$x, x$y, :
font family not found in Windows font database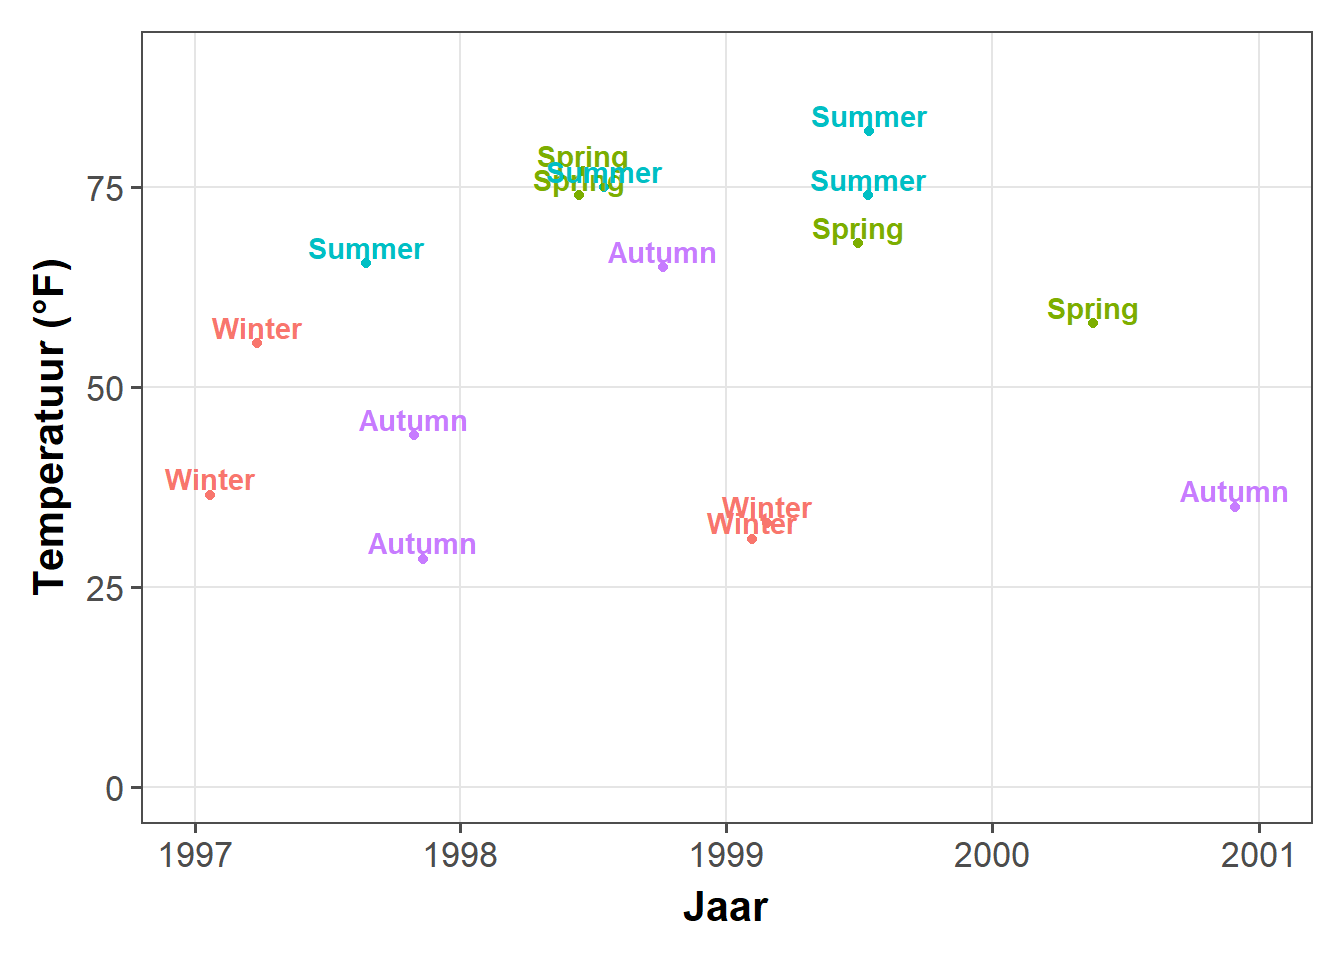
Een cool ding is het ggrepel pakket dat geoms levert voor ggplot2 om overlappende tekst af te stoten zoals in onze voorbeelden hierboven. We vervangen gewoon geom_text() door geom_text_repel() en geom_label() door geom_label_repel():
library(ggrepel)
ggplot(sample, aes(x = date, y = temp, color = season)) +
geom_point() +
geom_label_repel(aes(label = season), fontface = "bold") +
labs(x = "Jaar", y = "Temperatuur (°F)") +
theme(legend.position = "none")Warning in grid.Call(C_textBounds, as.graphicsAnnot(x$label), x$x, x$y, : font
family not found in Windows font database
Warning in grid.Call(C_textBounds, as.graphicsAnnot(x$label), x$x, x$y, : font
family not found in Windows font database
Warning in grid.Call(C_textBounds, as.graphicsAnnot(x$label), x$x, x$y, : font
family not found in Windows font database
Warning in grid.Call(C_textBounds, as.graphicsAnnot(x$label), x$x, x$y, : font
family not found in Windows font database
Warning in grid.Call(C_textBounds, as.graphicsAnnot(x$label), x$x, x$y, : font
family not found in Windows font database
Warning in grid.Call(C_textBounds, as.graphicsAnnot(x$label), x$x, x$y, : font
family not found in Windows font database
Warning in grid.Call(C_textBounds, as.graphicsAnnot(x$label), x$x, x$y, : font
family not found in Windows font databaseWarning in grid.Call.graphics(C_text, as.graphicsAnnot(x$label), x$x, x$y, :
font family not found in Windows font database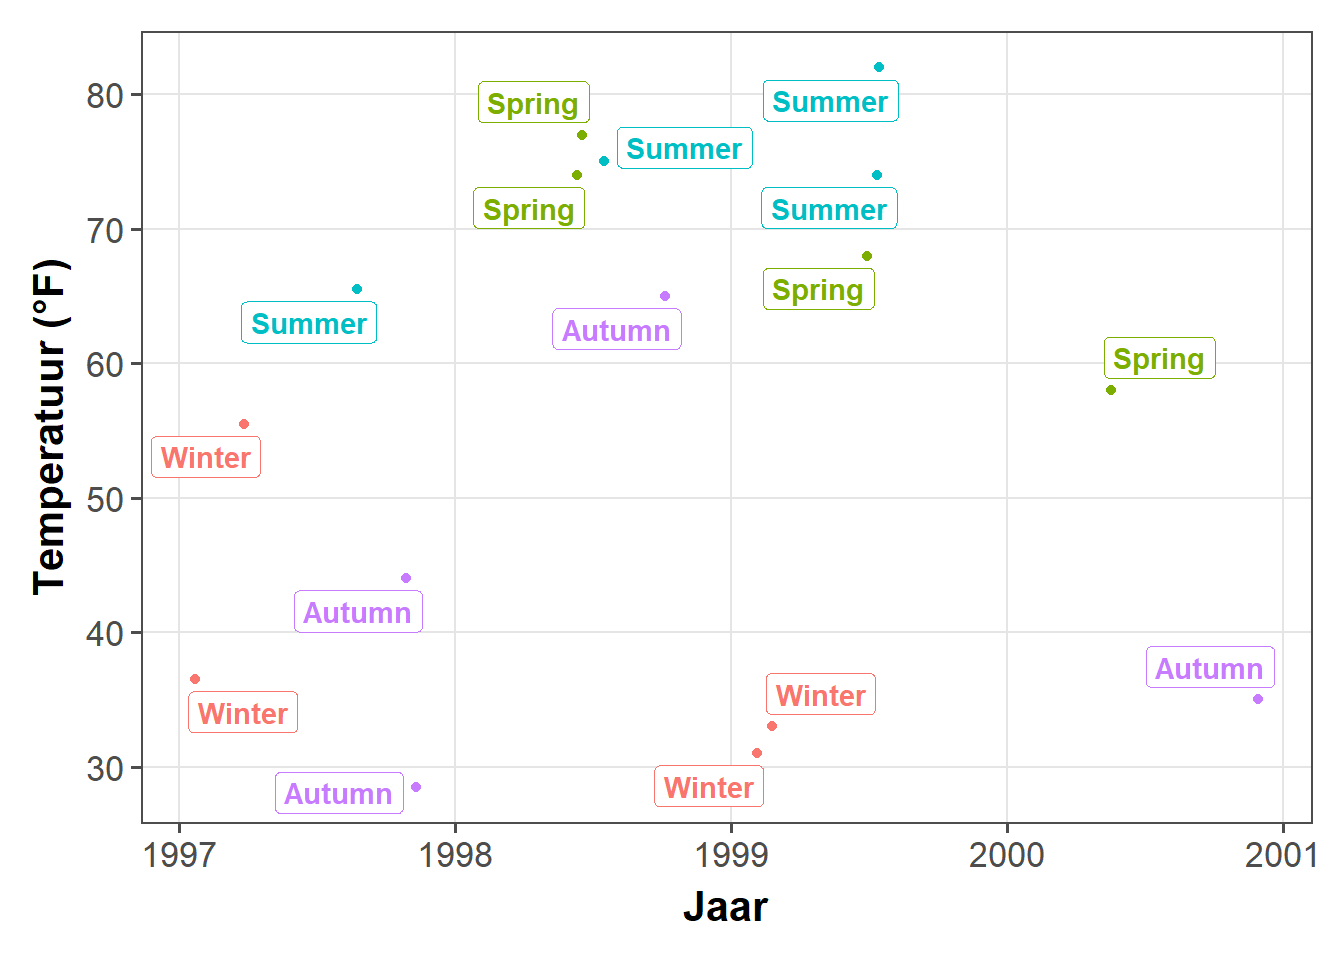
Het ziet er misschien mooier uit met gevulde vakjes, dus we mappen season naar fill in plaats van naar color en stellen een witte kleur in voor de tekst:
ggplot(sample, aes(x = date, y = temp)) +
geom_point(data = chic, size = .5) +
geom_point(aes(color = season), size = 1.5) +
geom_label_repel(aes(label = season, fill = season),
color = "white", fontface = "bold",
segment.color = "grey30") +
labs(x = "Jaar", y = "Temperatuur (°F)") +
theme(legend.position = "none")Warning in grid.Call(C_textBounds, as.graphicsAnnot(x$label), x$x, x$y, : font
family not found in Windows font database
Warning in grid.Call(C_textBounds, as.graphicsAnnot(x$label), x$x, x$y, : font
family not found in Windows font database
Warning in grid.Call(C_textBounds, as.graphicsAnnot(x$label), x$x, x$y, : font
family not found in Windows font database
Warning in grid.Call(C_textBounds, as.graphicsAnnot(x$label), x$x, x$y, : font
family not found in Windows font database
Warning in grid.Call(C_textBounds, as.graphicsAnnot(x$label), x$x, x$y, : font
family not found in Windows font database
Warning in grid.Call(C_textBounds, as.graphicsAnnot(x$label), x$x, x$y, : font
family not found in Windows font database
Warning in grid.Call(C_textBounds, as.graphicsAnnot(x$label), x$x, x$y, : font
family not found in Windows font databaseWarning in grid.Call.graphics(C_text, as.graphicsAnnot(x$label), x$x, x$y, :
font family not found in Windows font database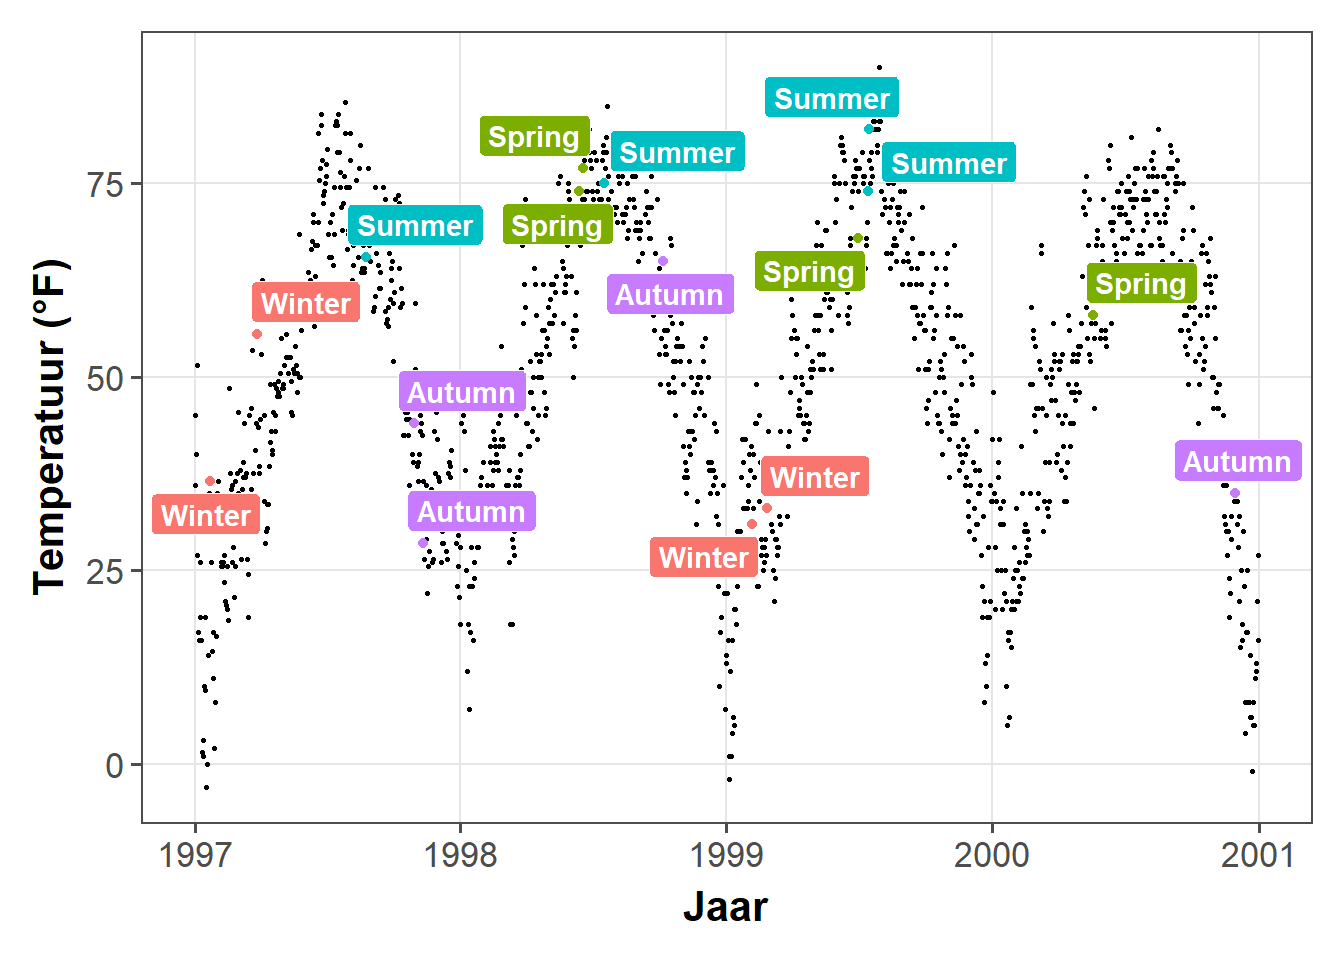
Dit werkt ook voor de pure tekst labels door gebruik te maken van geom_text_repel(). Kijk eens naar alle gebruiksvoorbeelden.
Tekst annotaties toevoegen
Er zijn verschillende manieren waarop je annotaties kunt toevoegen aan een ggplot. We kunnen weer geom_text() of geom_label() gebruiken:
g <-
ggplot(chic, aes(x = temp, y = dewpoint)) +
geom_point(alpha = .5) +
labs(x = "Temperatuur (°F)", y = "Dauwpunt")
g +
geom_text(aes(x = 25, y = 60,
label = "Dit is een bruikbare annotatie"))Warning in grid.Call(C_textBounds, as.graphicsAnnot(x$label), x$x, x$y, : font
family not found in Windows font database
Warning in grid.Call(C_textBounds, as.graphicsAnnot(x$label), x$x, x$y, : font
family not found in Windows font database
Warning in grid.Call(C_textBounds, as.graphicsAnnot(x$label), x$x, x$y, : font
family not found in Windows font database
Warning in grid.Call(C_textBounds, as.graphicsAnnot(x$label), x$x, x$y, : font
family not found in Windows font database
Warning in grid.Call(C_textBounds, as.graphicsAnnot(x$label), x$x, x$y, : font
family not found in Windows font database
Warning in grid.Call(C_textBounds, as.graphicsAnnot(x$label), x$x, x$y, : font
family not found in Windows font database
Warning in grid.Call(C_textBounds, as.graphicsAnnot(x$label), x$x, x$y, : font
family not found in Windows font databaseWarning in grid.Call.graphics(C_text, as.graphicsAnnot(x$label), x$x, x$y, :
font family not found in Windows font database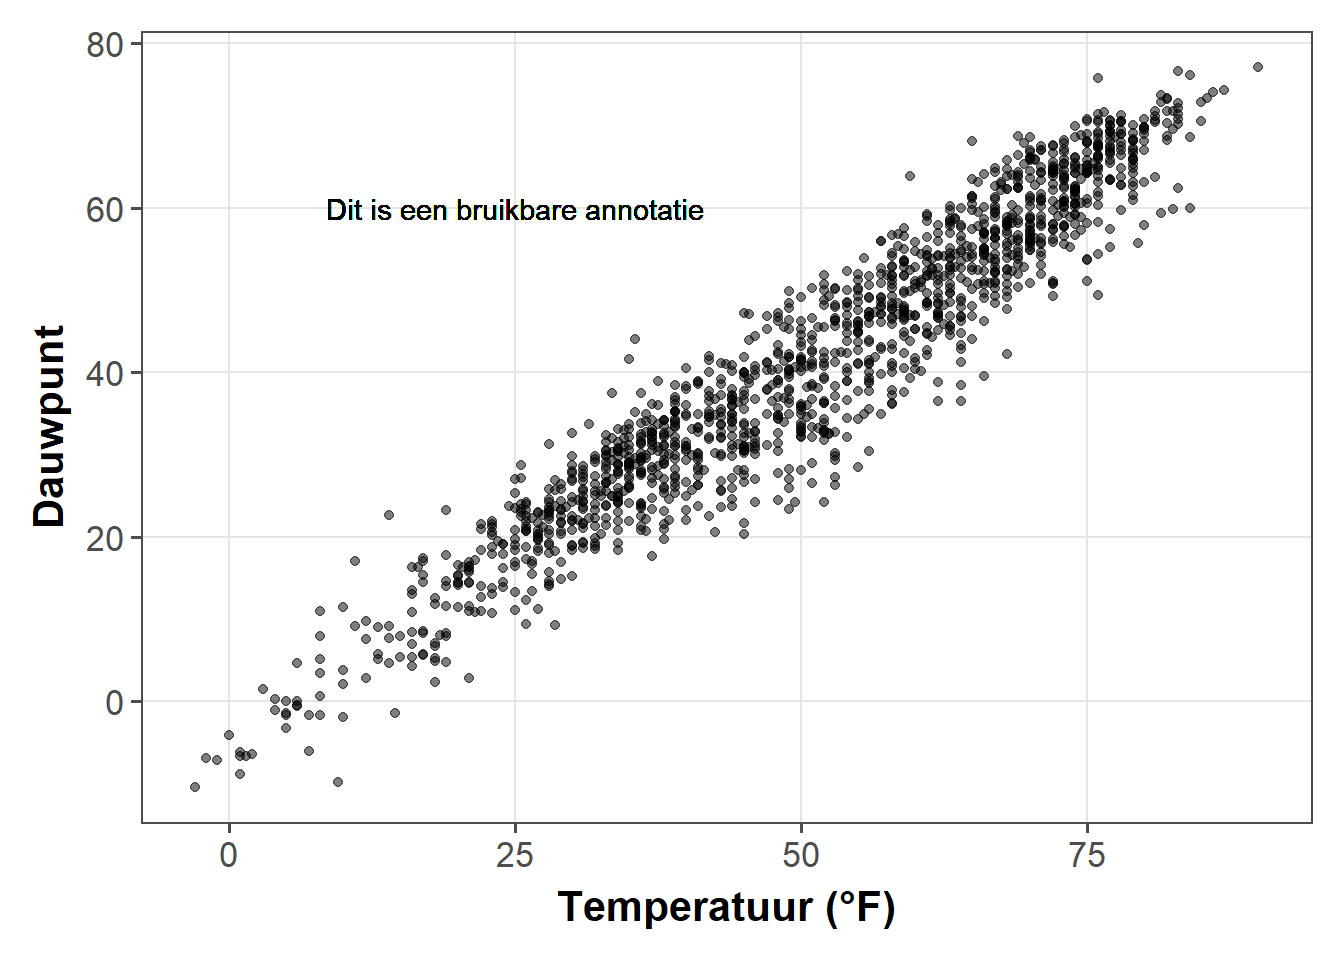
Echter, nu heeft ggplot één tekstlabel getekend per datapunt - dat zijn 1.461 labels en je ziet er maar één! Je kunt dit oplossen door het stat argument op "unique" te zetten:
g +
geom_text(aes(x = 25, y = 60,
label = "Dit is een bruikbare annotatie"),
stat = "unique")Warning in grid.Call(C_textBounds, as.graphicsAnnot(x$label), x$x, x$y, : font
family not found in Windows font database
Warning in grid.Call(C_textBounds, as.graphicsAnnot(x$label), x$x, x$y, : font
family not found in Windows font database
Warning in grid.Call(C_textBounds, as.graphicsAnnot(x$label), x$x, x$y, : font
family not found in Windows font database
Warning in grid.Call(C_textBounds, as.graphicsAnnot(x$label), x$x, x$y, : font
family not found in Windows font database
Warning in grid.Call(C_textBounds, as.graphicsAnnot(x$label), x$x, x$y, : font
family not found in Windows font database
Warning in grid.Call(C_textBounds, as.graphicsAnnot(x$label), x$x, x$y, : font
family not found in Windows font database
Warning in grid.Call(C_textBounds, as.graphicsAnnot(x$label), x$x, x$y, : font
family not found in Windows font databaseWarning in grid.Call.graphics(C_text, as.graphicsAnnot(x$label), x$x, x$y, :
font family not found in Windows font database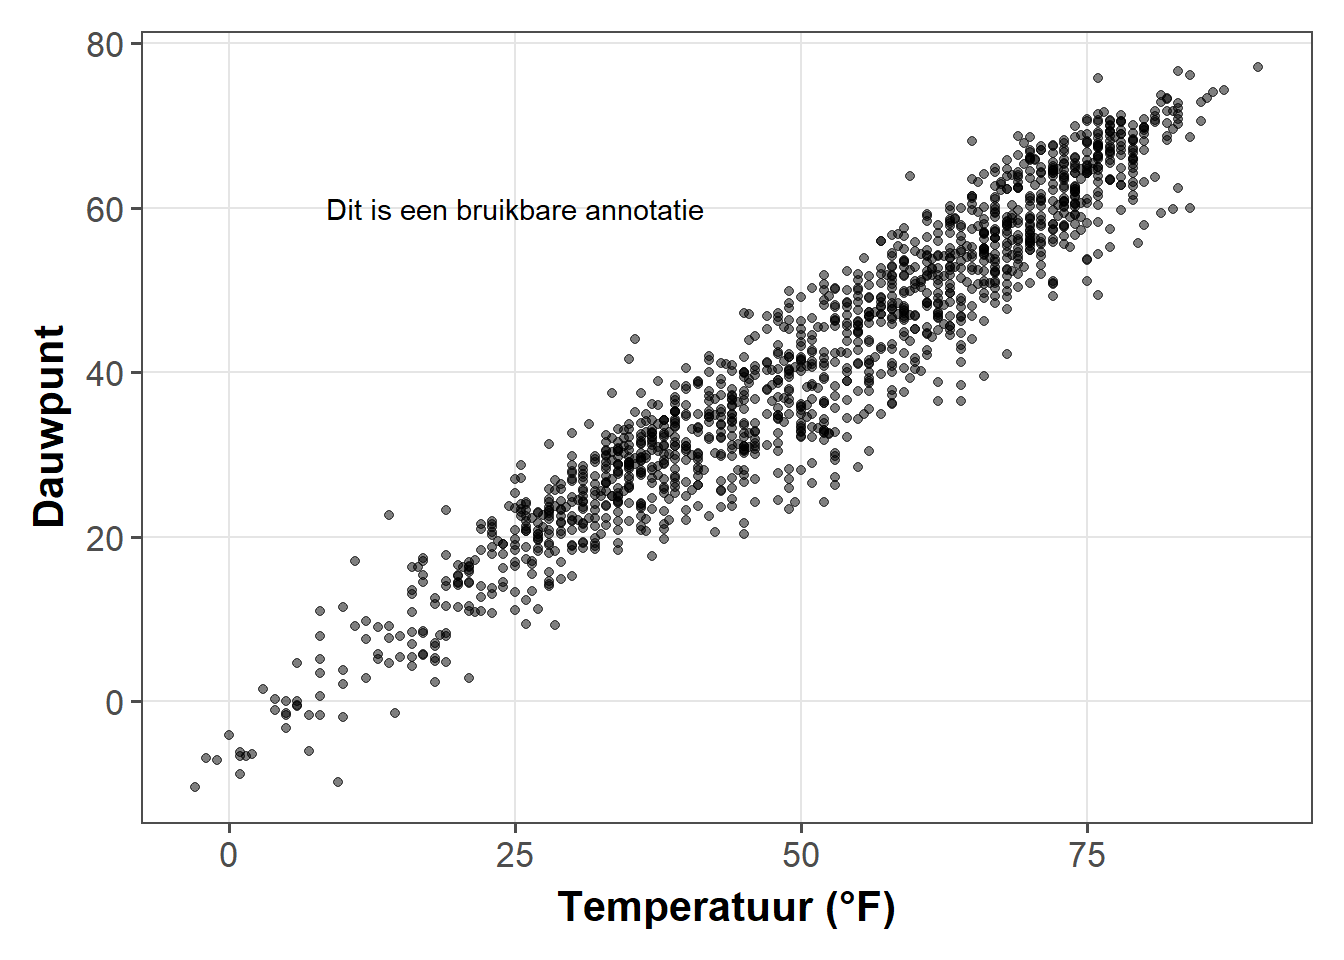
Tussen haakjes, natuurlijk kun je de eigenschappen van de weergegeven tekst veranderen:
g +
geom_text(aes(x = 25, y = 60,
label = "Dit is een bruikbare annotatie"),
stat = "unique", family = "Bangers",
size = 7, color = "darkcyan")Warning in grid.Call(C_textBounds, as.graphicsAnnot(x$label), x$x, x$y, : font
family not found in Windows font database
Warning in grid.Call(C_textBounds, as.graphicsAnnot(x$label), x$x, x$y, : font
family not found in Windows font database
Warning in grid.Call(C_textBounds, as.graphicsAnnot(x$label), x$x, x$y, : font
family not found in Windows font database
Warning in grid.Call(C_textBounds, as.graphicsAnnot(x$label), x$x, x$y, : font
family not found in Windows font database
Warning in grid.Call(C_textBounds, as.graphicsAnnot(x$label), x$x, x$y, : font
family not found in Windows font databaseWarning in grid.Call.graphics(C_text, as.graphicsAnnot(x$label), x$x, x$y, :
font family not found in Windows font databaseWarning in grid.Call(C_textBounds, as.graphicsAnnot(x$label), x$x, x$y, : font
family not found in Windows font database
Warning in grid.Call(C_textBounds, as.graphicsAnnot(x$label), x$x, x$y, : font
family not found in Windows font databaseWarning in grid.Call.graphics(C_text, as.graphicsAnnot(x$label), x$x, x$y, :
font family not found in Windows font database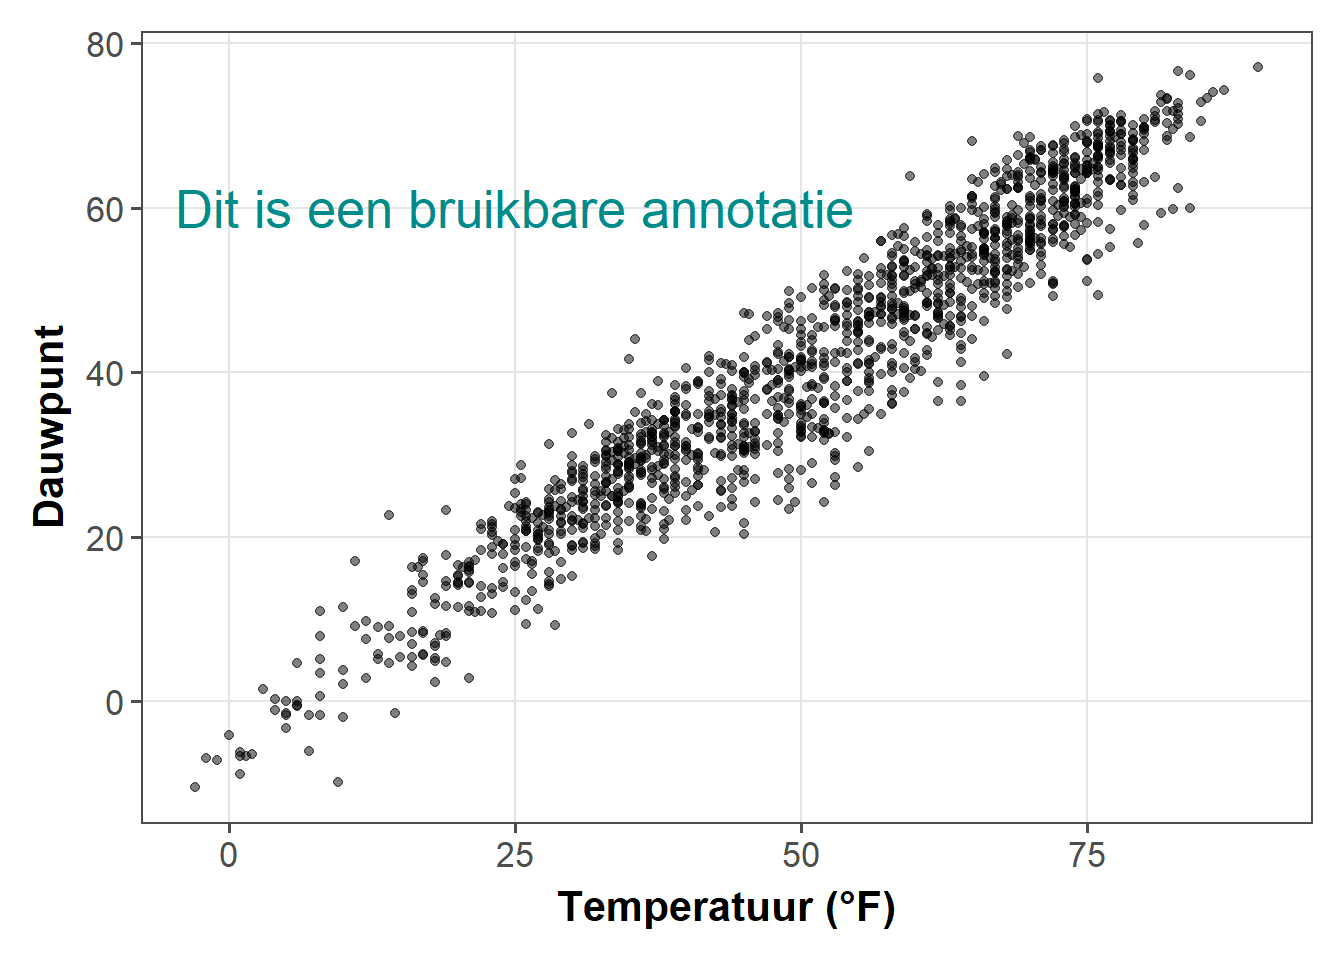
Als je een van de facetfuncties gebruikt om uw gegevens te visualiseren, kunt je in de problemen komen. Eén ding is dat je de annotatie misschien maar één keer wilt opnemen:
ann <- data.frame(
o3 = 30,
temp = 20,
season = factor("Summer", levels = levels(chic$season)),
label = "Hier is genoeg ruimte \nvoor wat annotaties."
)
g <-
ggplot(chic, aes(x = o3, y = temp)) +
geom_point() +
labs(x = "Ozon", y = "Temperatuur (°F)")
g +
geom_text(data = ann, aes(label = label),
size = 7, fontface = "bold",
family = "Roboto Condensed") +
facet_wrap(~season)Warning in grid.Call(C_textBounds, as.graphicsAnnot(x$label), x$x, x$y, : font
family not found in Windows font database
Warning in grid.Call(C_textBounds, as.graphicsAnnot(x$label), x$x, x$y, : font
family not found in Windows font database
Warning in grid.Call(C_textBounds, as.graphicsAnnot(x$label), x$x, x$y, : font
family not found in Windows font databaseWarning in grid.Call.graphics(C_text, as.graphicsAnnot(x$label), x$x, x$y, :
font family not found in Windows font database
Warning in grid.Call.graphics(C_text, as.graphicsAnnot(x$label), x$x, x$y, :
font family not found in Windows font database
Warning in grid.Call(C_textBounds, as.graphicsAnnot(x$label), x$x, x$y, : font
family not found in Windows font database
Warning in grid.Call(C_textBounds, as.graphicsAnnot(x$label), x$x, x$y, : font
family not found in Windows font databaseWarning in grid.Call.graphics(C_text, as.graphicsAnnot(x$label), x$x, x$y, :
font family not found in Windows font database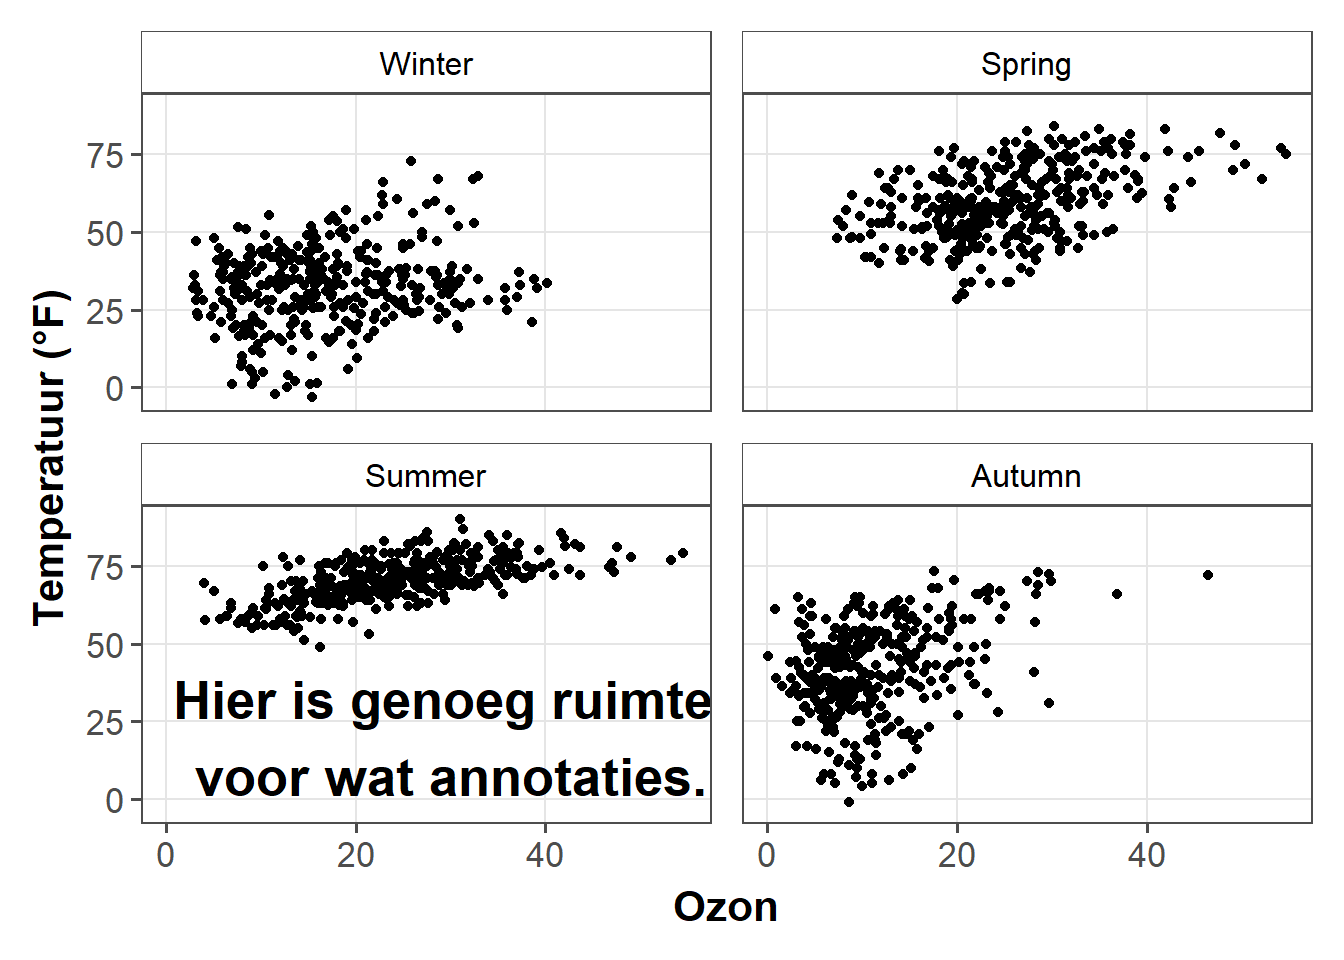
Een andere uitdaging zijn facetten in combinatie met vrije schalen die in uw tekst kunnen snijden:
g +
geom_text(aes(x = 23, y = 97,
label = "Dit is geen bruikbare annotatie"),
size = 5, fontface = "bold") +
scale_y_continuous(limits = c(NA, 100)) +
facet_wrap(~season, scales = "free_x")Warning in grid.Call(C_textBounds, as.graphicsAnnot(x$label), x$x, x$y, : font
family not found in Windows font database
Warning in grid.Call(C_textBounds, as.graphicsAnnot(x$label), x$x, x$y, : font
family not found in Windows font database

Warning in grid.Call(C_textBounds, as.graphicsAnnot(x$label), x$x, x$y, : font
family not found in Windows font databaseWarning in grid.Call.graphics(C_text, as.graphicsAnnot(x$label), x$x, x$y, :
font family not found in Windows font databaseWarning in grid.Call(C_textBounds, as.graphicsAnnot(x$label), x$x, x$y, : font
family not found in Windows font database
Warning in grid.Call(C_textBounds, as.graphicsAnnot(x$label), x$x, x$y, : font
family not found in Windows font databaseWarning in grid.Call.graphics(C_text, as.graphicsAnnot(x$label), x$x, x$y, :
font family not found in Windows font database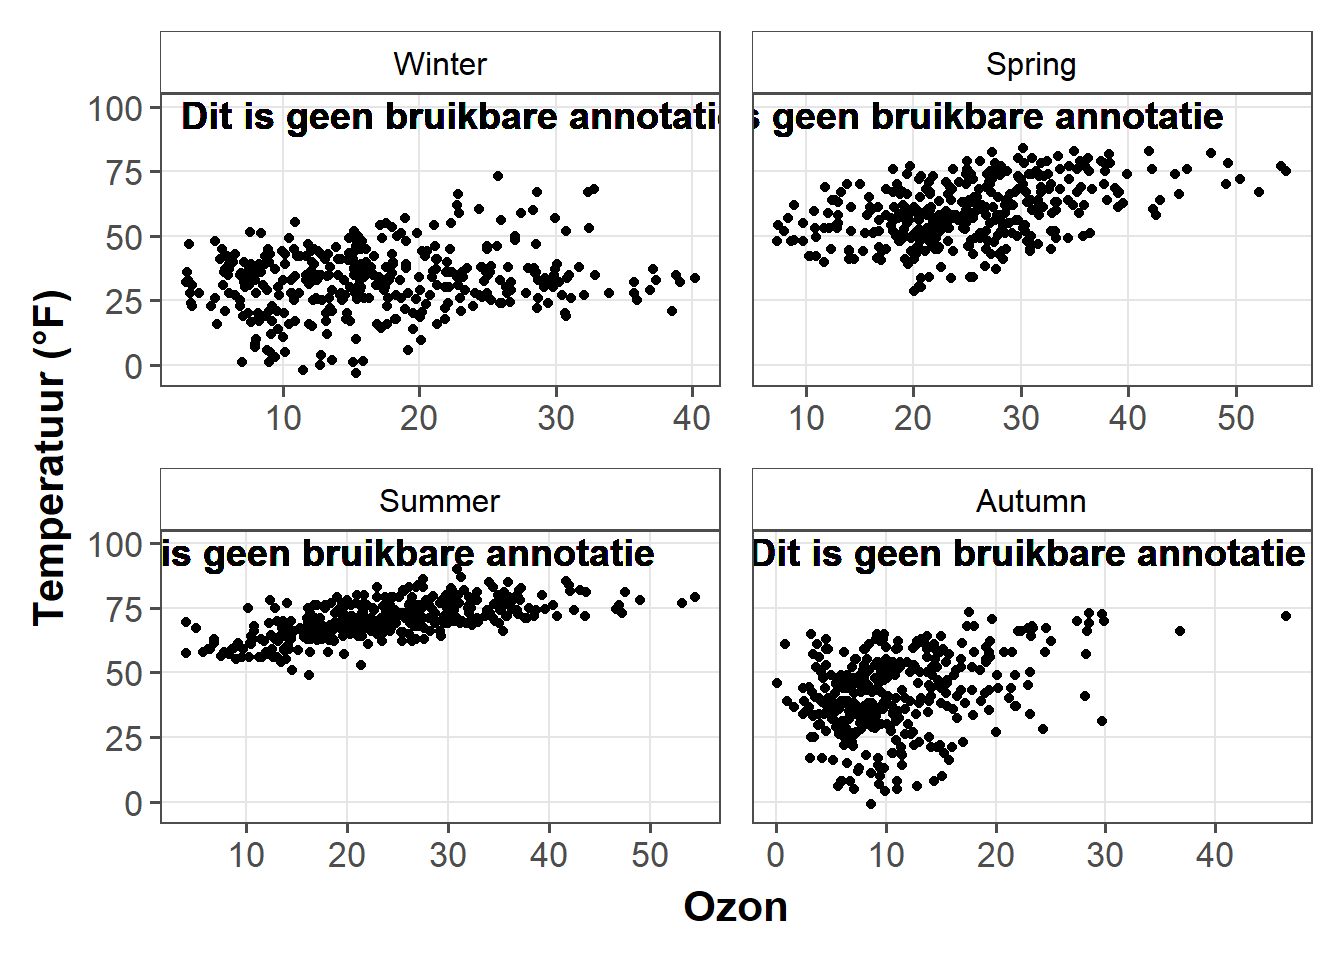
Een oplossing is om vooraf het middelpunt van de as, hier x, te berekenen:
library(tidyverse)
(ann <-
chic %>%
group_by(season) %>%
summarize(o3 = min(o3, na.rm = TRUE) +
(max(o3, na.rm = TRUE) - min(o3, na.rm = TRUE)) / 2))# A tibble: 4 x 2
season o3
<fct> <dbl>
1 Winter 21.5
2 Spring 31.0
3 Summer 29.2
4 Autumn 23.3… en gebruik de geaggregeerde gegevens om de plaatsing van de annotatie te specificeren:
g +
geom_text(data = ann,
aes(x = o3, y = 97,
label = "Dit is een bruikbare annotatie"),
size = 5, fontface = "bold") +
scale_y_continuous(limits = c(NA, 100)) +
facet_wrap(~season, scales = "free_x")Warning in grid.Call(C_textBounds, as.graphicsAnnot(x$label), x$x, x$y, : font
family not found in Windows font database
Warning in grid.Call(C_textBounds, as.graphicsAnnot(x$label), x$x, x$y, : font
family not found in Windows font database
Warning in grid.Call(C_textBounds, as.graphicsAnnot(x$label), x$x, x$y, : font
family not found in Windows font databaseWarning in grid.Call.graphics(C_text, as.graphicsAnnot(x$label), x$x, x$y, :
font family not found in Windows font databaseWarning in grid.Call(C_textBounds, as.graphicsAnnot(x$label), x$x, x$y, : font
family not found in Windows font database
Warning in grid.Call(C_textBounds, as.graphicsAnnot(x$label), x$x, x$y, : font
family not found in Windows font databaseWarning in grid.Call.graphics(C_text, as.graphicsAnnot(x$label), x$x, x$y, :
font family not found in Windows font database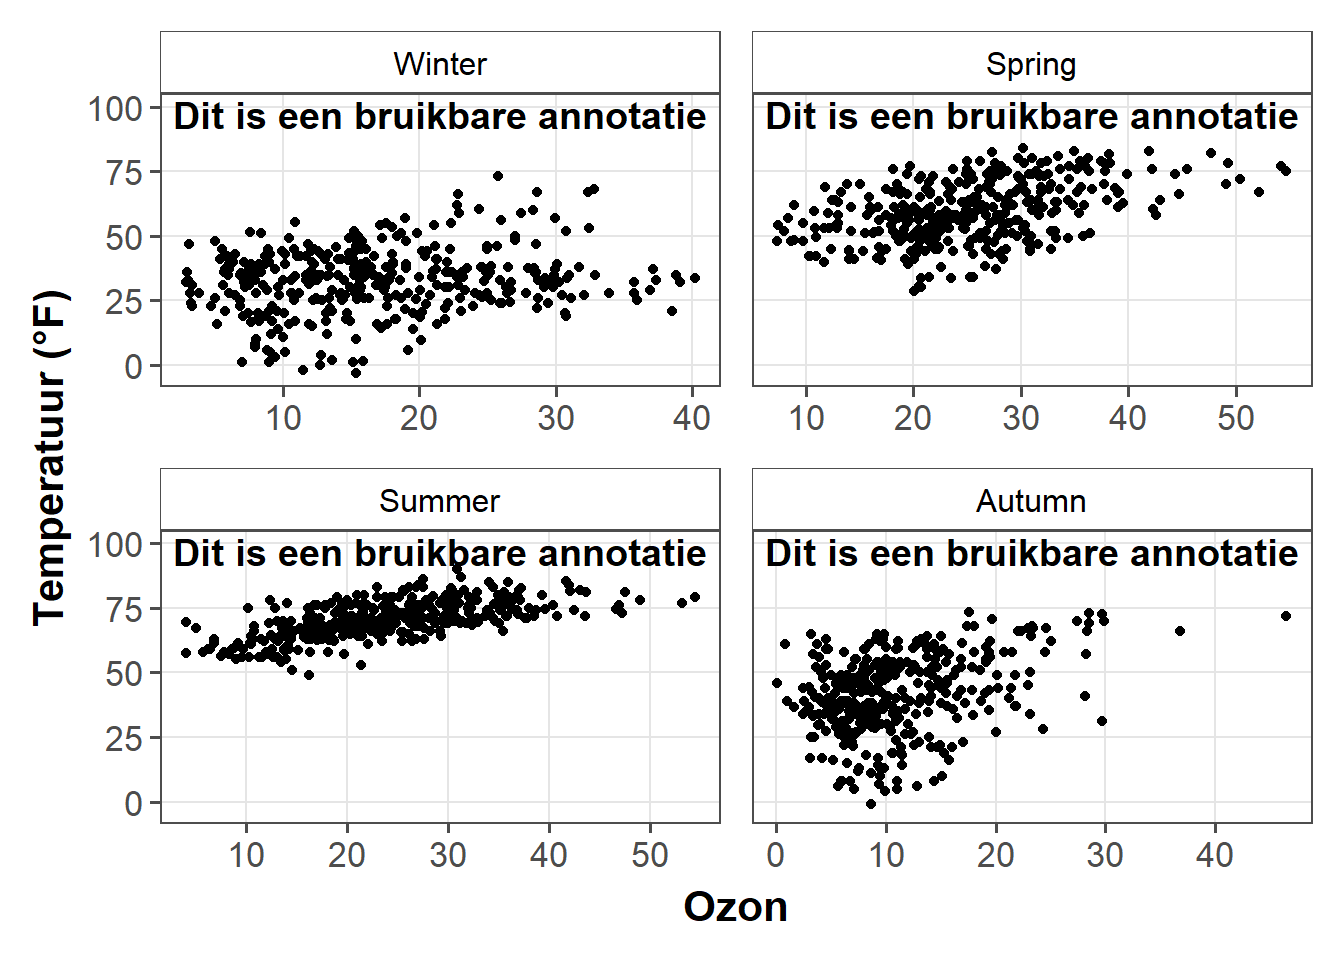
Er is echter een eenvoudiger aanpak (wat betreft het vastleggen van de coordinaten)-maar het duurt ook even om de code uit het hoofd te kennen. Het grid pakket in combinatie met ggplot2’s annotation_custom() stelt je in staat om de locatie te specificeren op basis van geschaalde coördinaten waarbij 0 laag is en 1 hoog. grobTree() creëert een raster grafisch object en textGrob creëert het tekst grafisch object. De waarde hiervan is vooral duidelijk wanneer je meerdere plots hebt met verschillende schalen.
library(grid)
my_grob <- grobTree(textGrob("Deze tekst blijft op de plaats staan!",
x = .1, y = .9, hjust = 0,
gp = gpar(col = "black",
fontsize = 15,
fontface = "bold")))
g +
annotation_custom(my_grob) +
facet_wrap(~season, scales = "free_x") +
scale_y_continuous(limits = c(NA, 100))Warning in grid.Call(C_textBounds, as.graphicsAnnot(x$label), x$x, x$y, : font
family not found in Windows font database
Warning in grid.Call(C_textBounds, as.graphicsAnnot(x$label), x$x, x$y, : font
family not found in Windows font database
Warning in grid.Call(C_textBounds, as.graphicsAnnot(x$label), x$x, x$y, : font
family not found in Windows font databaseWarning in grid.Call.graphics(C_text, as.graphicsAnnot(x$label), x$x, x$y, :
font family not found in Windows font databaseWarning in grid.Call(C_textBounds, as.graphicsAnnot(x$label), x$x, x$y, : font
family not found in Windows font database
Warning in grid.Call(C_textBounds, as.graphicsAnnot(x$label), x$x, x$y, : font
family not found in Windows font databaseWarning in grid.Call.graphics(C_text, as.graphicsAnnot(x$label), x$x, x$y, :
font family not found in Windows font database
Markdown en HTML rendering gebruiken voor annotaties
We gebruiken opnieuw Claus Wilke’s ggtext package dat is ontworpen voor verbeterde tekst renderingondersteuning voor ggplot2. Het ggtext pakket definieert twee nieuwe themaelementen, element_markdown() en element_textbox(). Het pakket biedt ook extra geoms. geom_richtext() is een vervanging voor geom_text() en geom_label() en rendert tekst als markdown…
library(ggtext)
lab_md <- "De **temperatuur** in *°F* versus **ozonniveau** in *ppm*"
g +
geom_richtext(aes(x = 35, y = 3, label = lab_md),
stat = "unique")Warning in grid.Call(C_textBounds, as.graphicsAnnot(x$label), x$x, x$y, : font
family not found in Windows font database
Warning in grid.Call(C_textBounds, as.graphicsAnnot(x$label), x$x, x$y, : font
family not found in Windows font database
Warning in grid.Call(C_textBounds, as.graphicsAnnot(x$label), x$x, x$y, : font
family not found in Windows font database
Warning in grid.Call(C_textBounds, as.graphicsAnnot(x$label), x$x, x$y, : font
family not found in Windows font database
Warning in grid.Call(C_textBounds, as.graphicsAnnot(x$label), x$x, x$y, : font
family not found in Windows font database
Warning in grid.Call(C_textBounds, as.graphicsAnnot(x$label), x$x, x$y, : font
family not found in Windows font database
Warning in grid.Call(C_textBounds, as.graphicsAnnot(x$label), x$x, x$y, : font
family not found in Windows font databaseWarning in grid.Call.graphics(C_text, as.graphicsAnnot(x$label), x$x, x$y, :
font family not found in Windows font database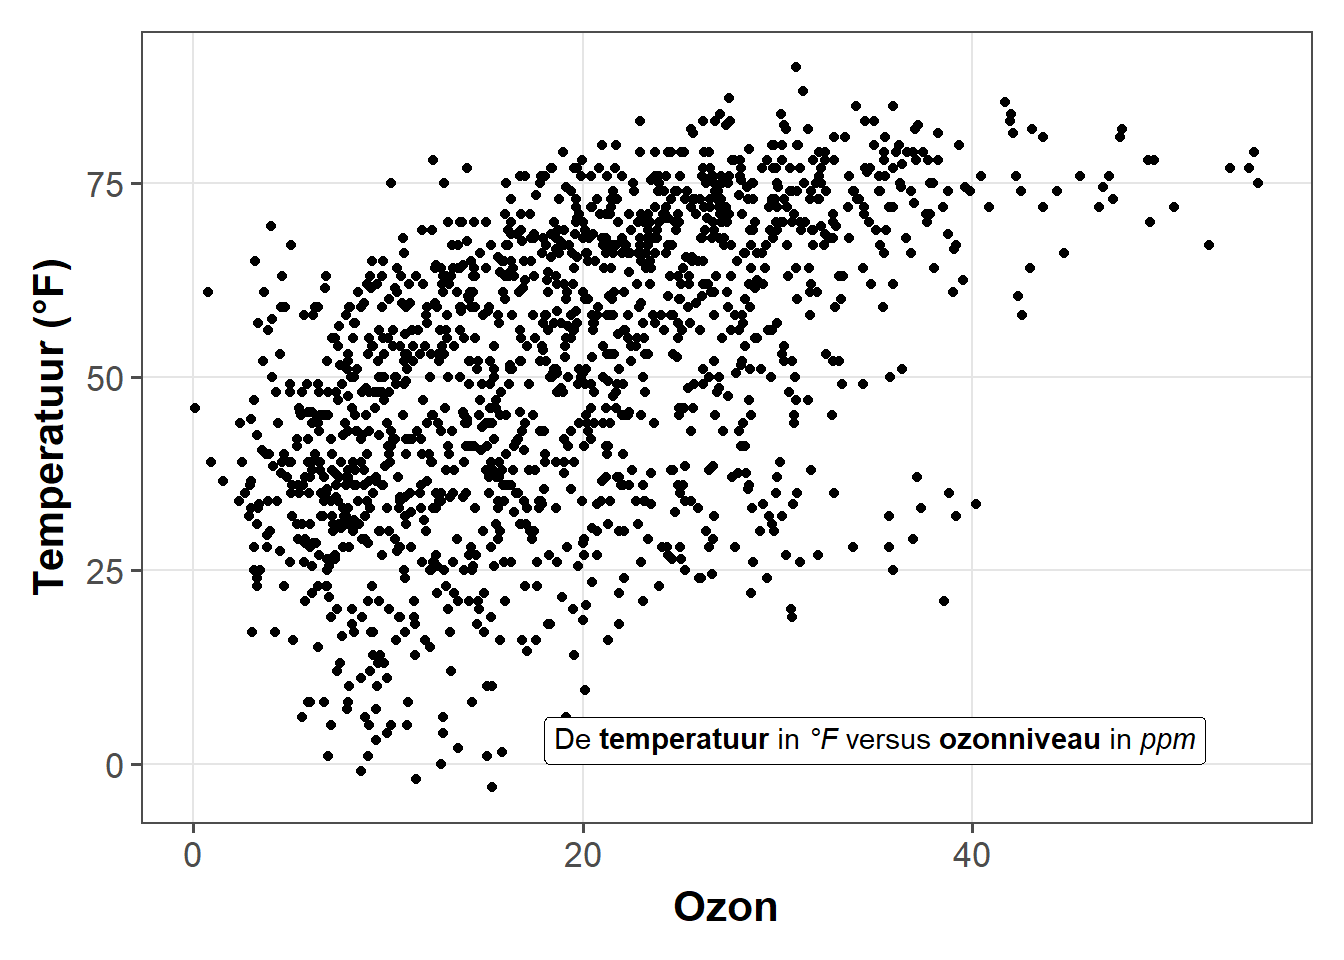
… of html:
lab_html <- "★ De <b style='color:red;'>temperatuur</b> in <i>°F</i> versus <b style='color:blue;'>ozonniveau</b>in <i>ppm</i> ★"
g +
geom_richtext(aes(x = 33, y = 3, label = lab_html),
stat = "unique")Warning in text_info(label, fontkey, fontfamily, fontface, fontsize, cache):
unable to translate '<U+2605>png111.0396692913386' to native encodingWarning in text_info_cache[[key]] <- info: unable to translate
'<U+2605>png111.0396692913386' to native encodingWarning in text_info(label, fontkey, fontfamily, fontface, fontsize, cache):
unable to translate '<U+2605>png111.0396692913386' to native encodingWarning in grid.Call(C_textBounds, as.graphicsAnnot(x$label), x$x, x$y, : font
family not found in Windows font database
Warning in grid.Call(C_textBounds, as.graphicsAnnot(x$label), x$x, x$y, : font
family not found in Windows font database
Warning in grid.Call(C_textBounds, as.graphicsAnnot(x$label), x$x, x$y, : font
family not found in Windows font database
Warning in grid.Call(C_textBounds, as.graphicsAnnot(x$label), x$x, x$y, : font
family not found in Windows font database
Warning in grid.Call(C_textBounds, as.graphicsAnnot(x$label), x$x, x$y, : font
family not found in Windows font database
Warning in grid.Call(C_textBounds, as.graphicsAnnot(x$label), x$x, x$y, : font
family not found in Windows font database
Warning in grid.Call(C_textBounds, as.graphicsAnnot(x$label), x$x, x$y, : font
family not found in Windows font databaseWarning in grid.Call.graphics(C_text, as.graphicsAnnot(x$label), x$x, x$y, :
font family not found in Windows font database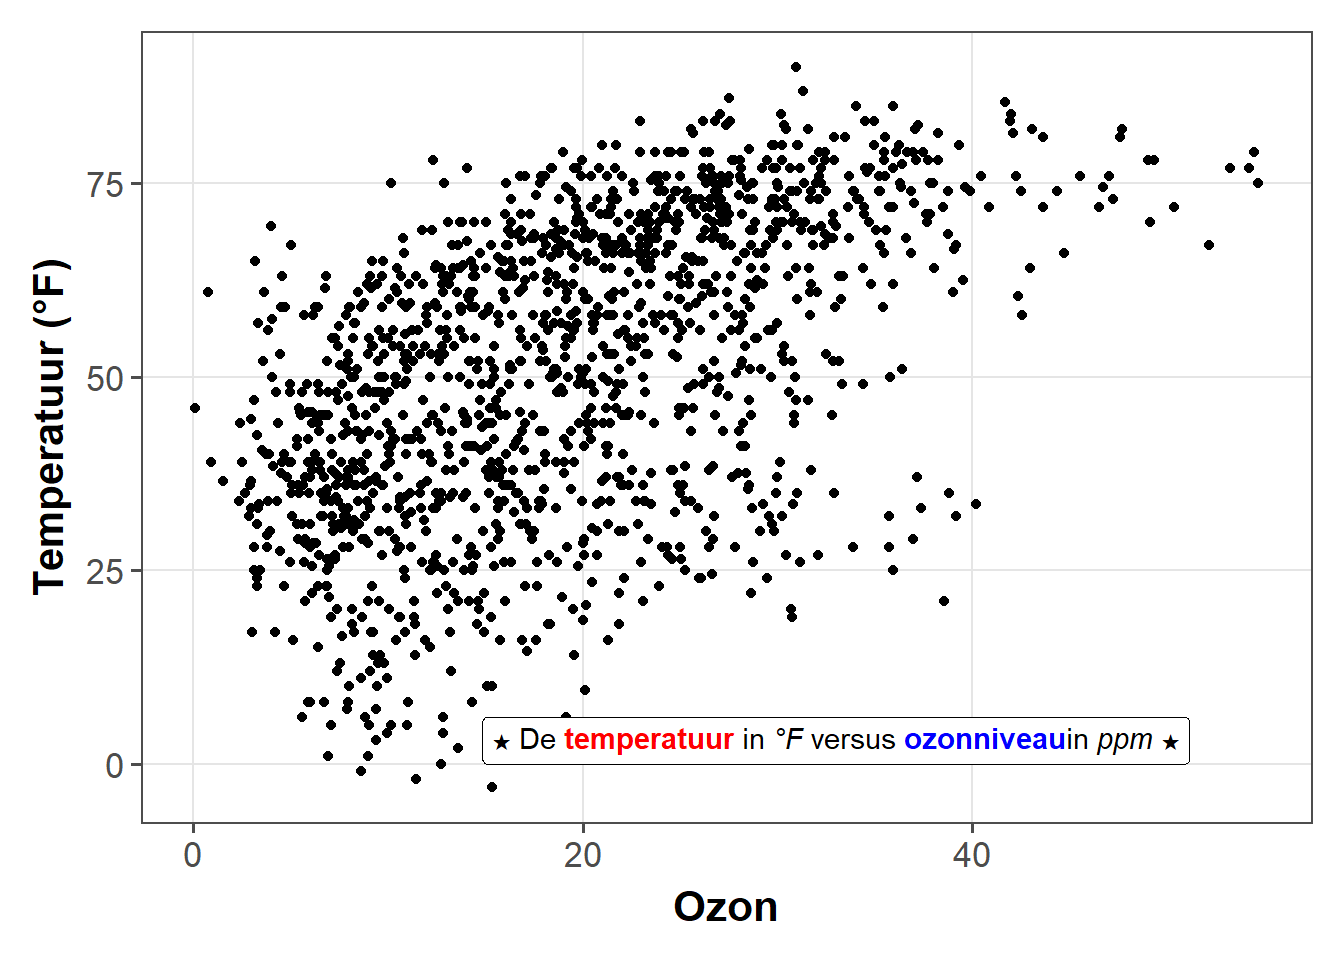
De geom komt met een heleboel details die je kunt aanpassen, zoals de hoek (wat niet mogelijk is in de standaard geom_text() en geom_label()), eigenschappen van het vak en eigenschappen van de tekst.
g +
geom_richtext(aes(x = 10, y = 25, label = lab_md),
stat = "unique", angle = 30,
color = "white", fill = "steelblue",
label.color = NA, hjust = 0, vjust = 0,
family = "Playfair Display")Warning in grid.Call(C_textBounds, as.graphicsAnnot(x$label), x$x, x$y, : font
family not found in Windows font database
Warning in grid.Call(C_textBounds, as.graphicsAnnot(x$label), x$x, x$y, : font
family not found in Windows font database

Warning in grid.Call(C_textBounds, as.graphicsAnnot(x$label), x$x, x$y, : font
family not found in Windows font database

Warning in grid.Call(C_textBounds, as.graphicsAnnot(x$label), x$x, x$y, : font
family not found in Windows font database

Warning in grid.Call(C_textBounds, as.graphicsAnnot(x$label), x$x, x$y, : font
family not found in Windows font database

Warning in grid.Call(C_textBounds, as.graphicsAnnot(x$label), x$x, x$y, : font
family not found in Windows font database

Warning in grid.Call(C_textBounds, as.graphicsAnnot(x$label), x$x, x$y, : font
family not found in Windows font database

Warning in grid.Call(C_textBounds, as.graphicsAnnot(x$label), x$x, x$y, : font
family not found in Windows font database
Warning in grid.Call(C_textBounds, as.graphicsAnnot(x$label), x$x, x$y, : font
family not found in Windows font database
Warning in grid.Call(C_textBounds, as.graphicsAnnot(x$label), x$x, x$y, : font
family not found in Windows font database
Warning in grid.Call(C_textBounds, as.graphicsAnnot(x$label), x$x, x$y, : font
family not found in Windows font database
Warning in grid.Call(C_textBounds, as.graphicsAnnot(x$label), x$x, x$y, : font
family not found in Windows font database
Warning in grid.Call(C_textBounds, as.graphicsAnnot(x$label), x$x, x$y, : font
family not found in Windows font database
Warning in grid.Call(C_textBounds, as.graphicsAnnot(x$label), x$x, x$y, : font
family not found in Windows font database
Warning in grid.Call(C_textBounds, as.graphicsAnnot(x$label), x$x, x$y, : font
family not found in Windows font databaseWarning in grid.Call.graphics(C_text, as.graphicsAnnot(x$label), x$x, x$y, :
font family not found in Windows font database
Warning in grid.Call.graphics(C_text, as.graphicsAnnot(x$label), x$x, x$y, :
font family not found in Windows font database
Warning in grid.Call.graphics(C_text, as.graphicsAnnot(x$label), x$x, x$y, :
font family not found in Windows font database
Warning in grid.Call.graphics(C_text, as.graphicsAnnot(x$label), x$x, x$y, :
font family not found in Windows font database
Warning in grid.Call.graphics(C_text, as.graphicsAnnot(x$label), x$x, x$y, :
font family not found in Windows font database
Warning in grid.Call.graphics(C_text, as.graphicsAnnot(x$label), x$x, x$y, :
font family not found in Windows font database
Warning in grid.Call.graphics(C_text, as.graphicsAnnot(x$label), x$x, x$y, :
font family not found in Windows font database
Warning in grid.Call.graphics(C_text, as.graphicsAnnot(x$label), x$x, x$y, :
font family not found in Windows font database
Warning in grid.Call.graphics(C_text, as.graphicsAnnot(x$label), x$x, x$y, :
font family not found in Windows font database
Warning in grid.Call.graphics(C_text, as.graphicsAnnot(x$label), x$x, x$y, :
font family not found in Windows font database
Warning in grid.Call.graphics(C_text, as.graphicsAnnot(x$label), x$x, x$y, :
font family not found in Windows font database
Warning in grid.Call.graphics(C_text, as.graphicsAnnot(x$label), x$x, x$y, :
font family not found in Windows font database
Warning in grid.Call.graphics(C_text, as.graphicsAnnot(x$label), x$x, x$y, :
font family not found in Windows font database
Warning in grid.Call.graphics(C_text, as.graphicsAnnot(x$label), x$x, x$y, :
font family not found in Windows font database
Warning in grid.Call.graphics(C_text, as.graphicsAnnot(x$label), x$x, x$y, :
font family not found in Windows font database
Warning in grid.Call.graphics(C_text, as.graphicsAnnot(x$label), x$x, x$y, :
font family not found in Windows font databaseWarning in grid.Call(C_textBounds, as.graphicsAnnot(x$label), x$x, x$y, : font
family not found in Windows font database
Warning in grid.Call(C_textBounds, as.graphicsAnnot(x$label), x$x, x$y, : font
family not found in Windows font databaseWarning in grid.Call.graphics(C_text, as.graphicsAnnot(x$label), x$x, x$y, :
font family not found in Windows font database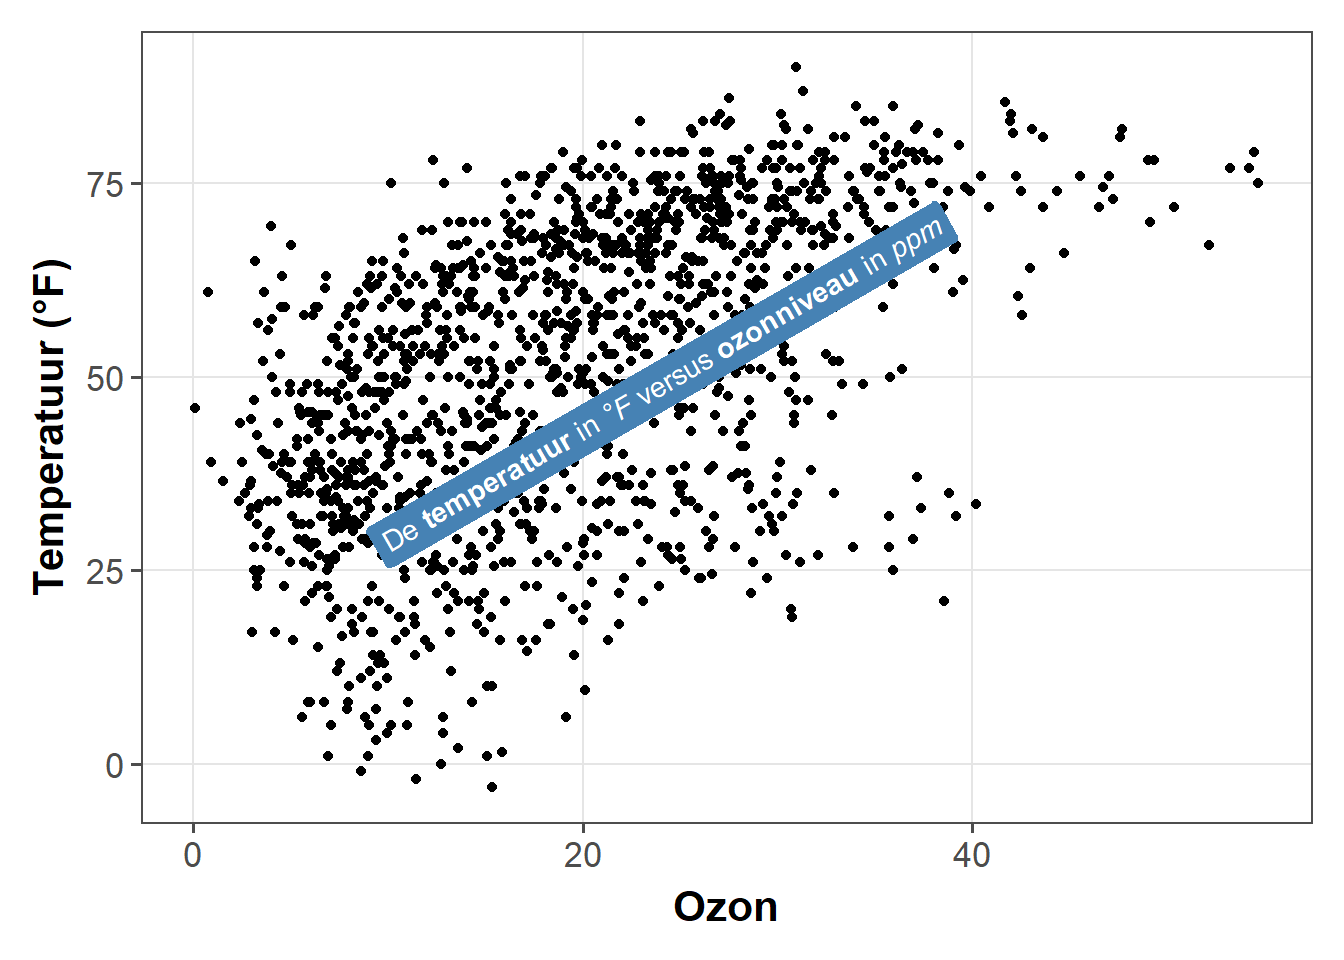
De andere geom uit het ggtext pakket is geom_textbox(). Deze geom maakt het mogelijk om strings dynamisch te verpakken, wat erg handig is voor langere annotaties, zoals infoboxen en ondertitels.
lab_long <- "**Lorem ipsum dolor**<br><i style='font-size:8pt;color:red;'>Lorem ipsum dolor sit amet, consectetur adipiscing elit, sed do eiusmod tempor incididunt ut labore et dolore magna aliqua.<br>Ut enim ad minim veniam, quis nostrud exercitation ullamco laboris nisi ut aliquip ex ea commodo consequat.</i>"
g +
geom_textbox(aes(x = 40, y = 10, label = lab_long),
width = unit(15, "lines"), stat = "unique")Warning in grid.Call(C_textBounds, as.graphicsAnnot(x$label), x$x, x$y, : font
family not found in Windows font database
Warning in grid.Call(C_textBounds, as.graphicsAnnot(x$label), x$x, x$y, : font
family not found in Windows font database
Warning in grid.Call(C_textBounds, as.graphicsAnnot(x$label), x$x, x$y, : font
family not found in Windows font database
Warning in grid.Call(C_textBounds, as.graphicsAnnot(x$label), x$x, x$y, : font
family not found in Windows font database
Warning in grid.Call(C_textBounds, as.graphicsAnnot(x$label), x$x, x$y, : font
family not found in Windows font database
Warning in grid.Call(C_textBounds, as.graphicsAnnot(x$label), x$x, x$y, : font
family not found in Windows font database
Warning in grid.Call(C_textBounds, as.graphicsAnnot(x$label), x$x, x$y, : font
family not found in Windows font databaseWarning in grid.Call.graphics(C_text, as.graphicsAnnot(x$label), x$x, x$y, :
font family not found in Windows font database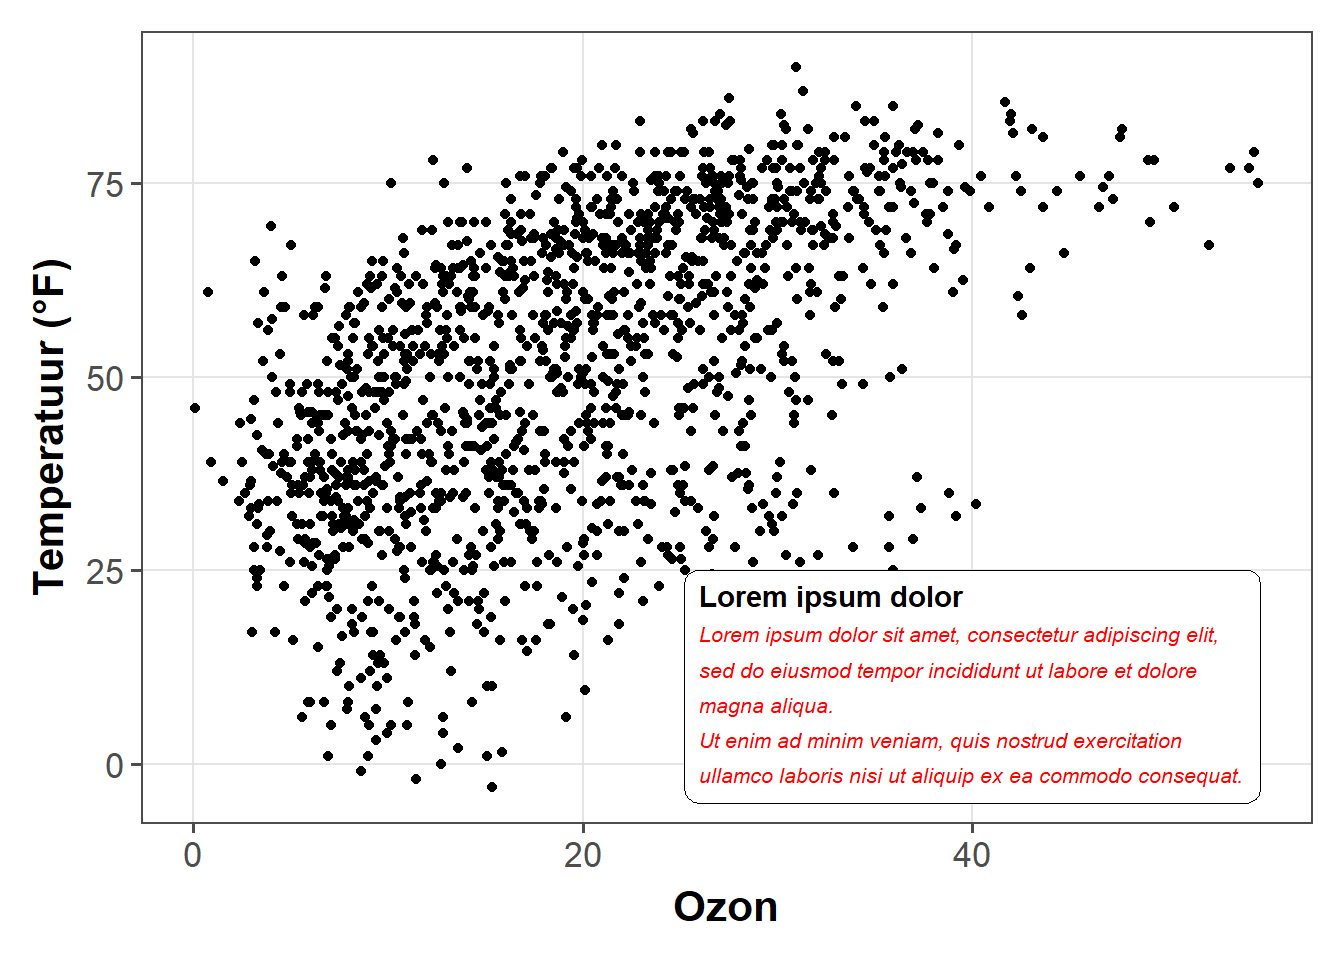
Merk op dat het niet mogelijk is om het tekstvak te draaien (altijd horizontaal) of om de uitlijning van de tekst te veranderen (altijd links uitgelijnd).
Werken met Coördinaten
Een plot omdraaien
Het is ongelooflijk eenvoudig om een plot om te draaien. Hier heb ik de coord_flip() toegevoegd, alles is wat je nodig hebt om de plot om te draaien. Dit is vooral zinvol wanneer je geom’s gebruikt om categorische data weer te geven, bijvoorbeeld staafdiagrammen of, zoals in het volgende voorbeeld, box and whiskers plots:
ggplot(chic, aes(x = season, y = o3)) +
geom_boxplot(fill = "indianred") +
labs(x = "Seizoen", y = "Ozon") +
coord_flip()Warning in grid.Call(C_textBounds, as.graphicsAnnot(x$label), x$x, x$y, : font
family not found in Windows font database
Warning in grid.Call(C_textBounds, as.graphicsAnnot(x$label), x$x, x$y, : font
family not found in Windows font database
Warning in grid.Call(C_textBounds, as.graphicsAnnot(x$label), x$x, x$y, : font
family not found in Windows font database
Warning in grid.Call(C_textBounds, as.graphicsAnnot(x$label), x$x, x$y, : font
family not found in Windows font database
Warning in grid.Call(C_textBounds, as.graphicsAnnot(x$label), x$x, x$y, : font
family not found in Windows font database
Warning in grid.Call(C_textBounds, as.graphicsAnnot(x$label), x$x, x$y, : font
family not found in Windows font database
Warning in grid.Call(C_textBounds, as.graphicsAnnot(x$label), x$x, x$y, : font
family not found in Windows font databaseWarning in grid.Call.graphics(C_text, as.graphicsAnnot(x$label), x$x, x$y, :
font family not found in Windows font database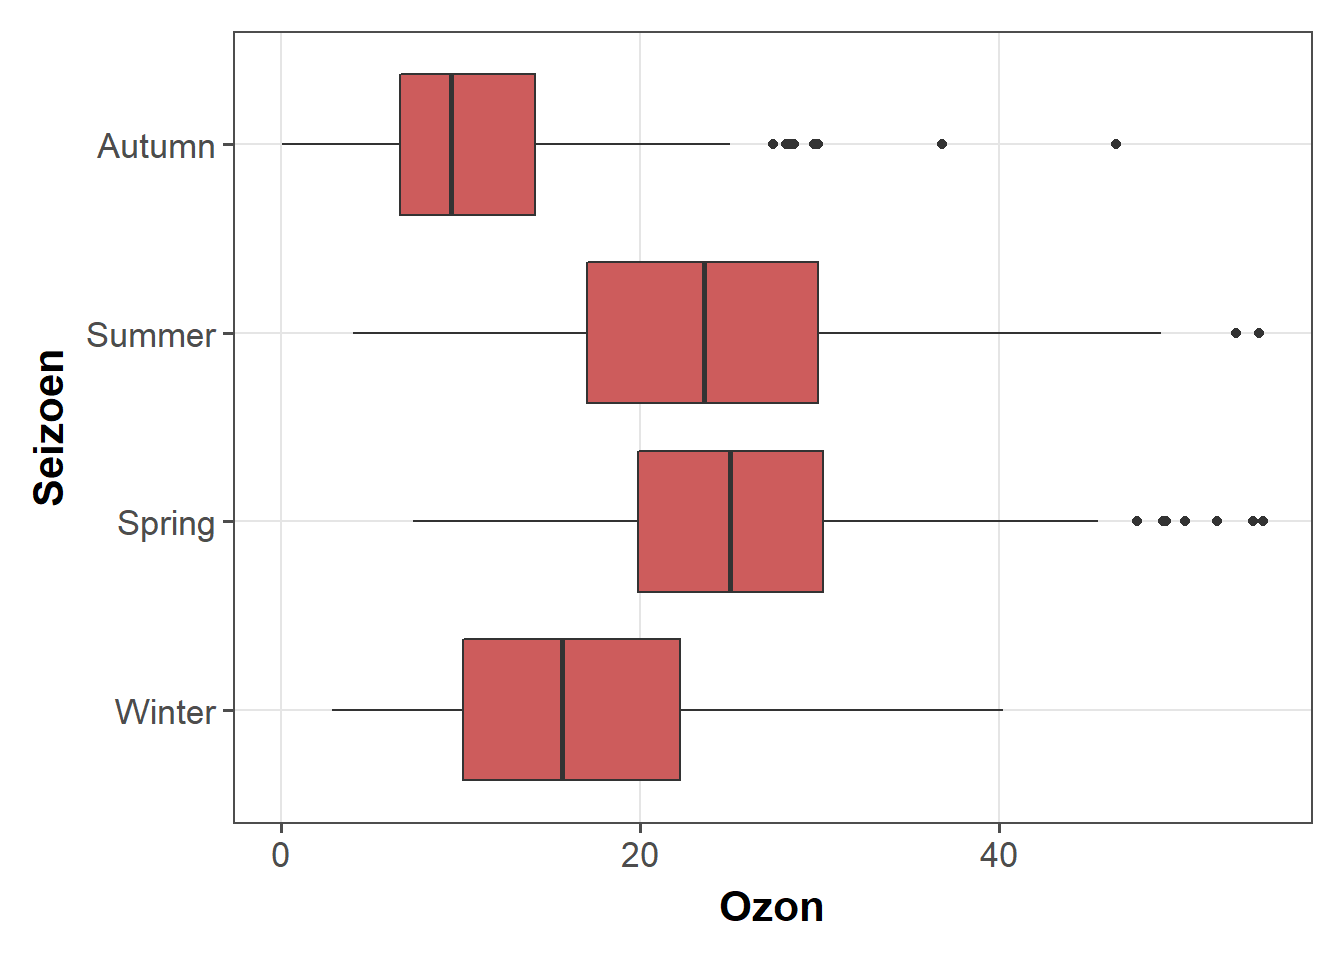
Sinds
ggplot2versie 3.0.0 is het ook mogelijk om geom’s horizontaal te tekenen via het argumentorientation = "y". Uitklappen om voorbeeld te zien.
Fixeer een As
Je kunt de hoogte-breedte verhouding van het Cartesisch coördinatenstelsel vastzetten en letterlijk een fysieke weergave van de eenheden langs de x- en y-assen afdwingen:
ggplot(chic, aes(x = temp, y = o3)) +
geom_point() +
labs(x = "Temperatuur (°F)", y = "Ozonniveau") +
scale_x_continuous(breaks = seq(0, 80, by = 20)) +
coord_fixed(ratio = 1)Warning in grid.Call(C_textBounds, as.graphicsAnnot(x$label), x$x, x$y, : font
family not found in Windows font database
Warning in grid.Call(C_textBounds, as.graphicsAnnot(x$label), x$x, x$y, : font
family not found in Windows font database
Warning in grid.Call(C_textBounds, as.graphicsAnnot(x$label), x$x, x$y, : font
family not found in Windows font database
Warning in grid.Call(C_textBounds, as.graphicsAnnot(x$label), x$x, x$y, : font
family not found in Windows font database
Warning in grid.Call(C_textBounds, as.graphicsAnnot(x$label), x$x, x$y, : font
family not found in Windows font database
Warning in grid.Call(C_textBounds, as.graphicsAnnot(x$label), x$x, x$y, : font
family not found in Windows font database
Warning in grid.Call(C_textBounds, as.graphicsAnnot(x$label), x$x, x$y, : font
family not found in Windows font databaseWarning in grid.Call.graphics(C_text, as.graphicsAnnot(x$label), x$x, x$y, :
font family not found in Windows font database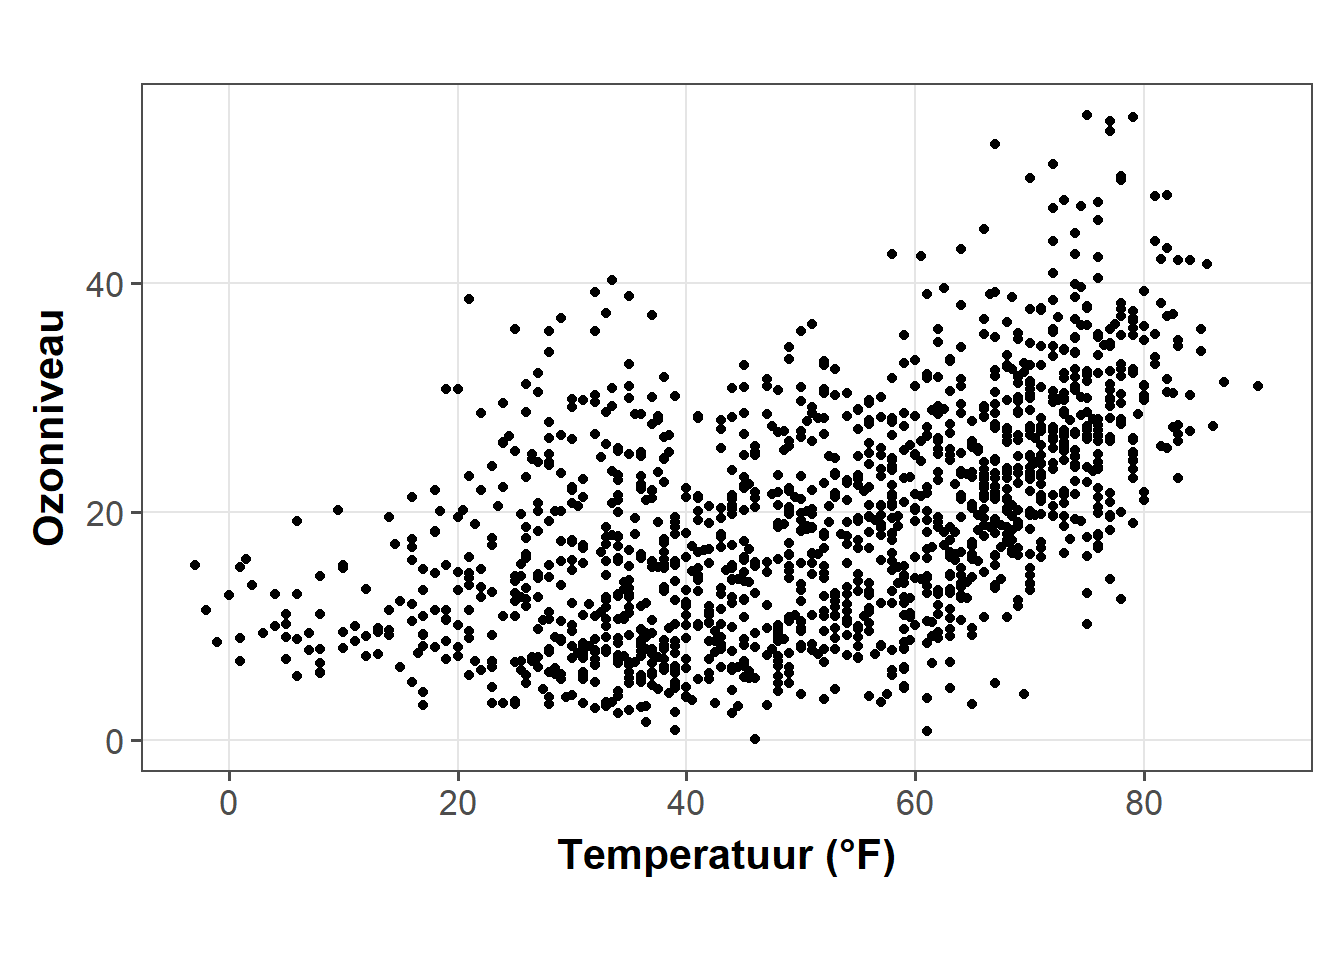
This way one can ensure not only a fixed step length on the axes but also that the exported plot looks as expected. However, your saved plot likely contains a lot of white space in case you do not use a suitable aspect ratio:
ggplot(chic, aes(x = temp, y = o3)) +
geom_point() +
labs(x = "Temperatuur (°F)", y = "Ozon\nniveau") +
scale_x_continuous(breaks = seq(0, 80, by = 20)) +
coord_fixed(ratio = 1/3) +
theme(plot.background = element_rect(fill = "grey80"))Warning in grid.Call(C_textBounds, as.graphicsAnnot(x$label), x$x, x$y, : font
family not found in Windows font database
Warning in grid.Call(C_textBounds, as.graphicsAnnot(x$label), x$x, x$y, : font
family not found in Windows font database
Warning in grid.Call(C_textBounds, as.graphicsAnnot(x$label), x$x, x$y, : font
family not found in Windows font database
Warning in grid.Call(C_textBounds, as.graphicsAnnot(x$label), x$x, x$y, : font
family not found in Windows font database
Warning in grid.Call(C_textBounds, as.graphicsAnnot(x$label), x$x, x$y, : font
family not found in Windows font database
Warning in grid.Call(C_textBounds, as.graphicsAnnot(x$label), x$x, x$y, : font
family not found in Windows font database
Warning in grid.Call(C_textBounds, as.graphicsAnnot(x$label), x$x, x$y, : font
family not found in Windows font databaseWarning in grid.Call.graphics(C_text, as.graphicsAnnot(x$label), x$x, x$y, :
font family not found in Windows font database
Warning in grid.Call.graphics(C_text, as.graphicsAnnot(x$label), x$x, x$y, :
font family not found in Windows font database
Warning in grid.Call.graphics(C_text, as.graphicsAnnot(x$label), x$x, x$y, :
font family not found in Windows font database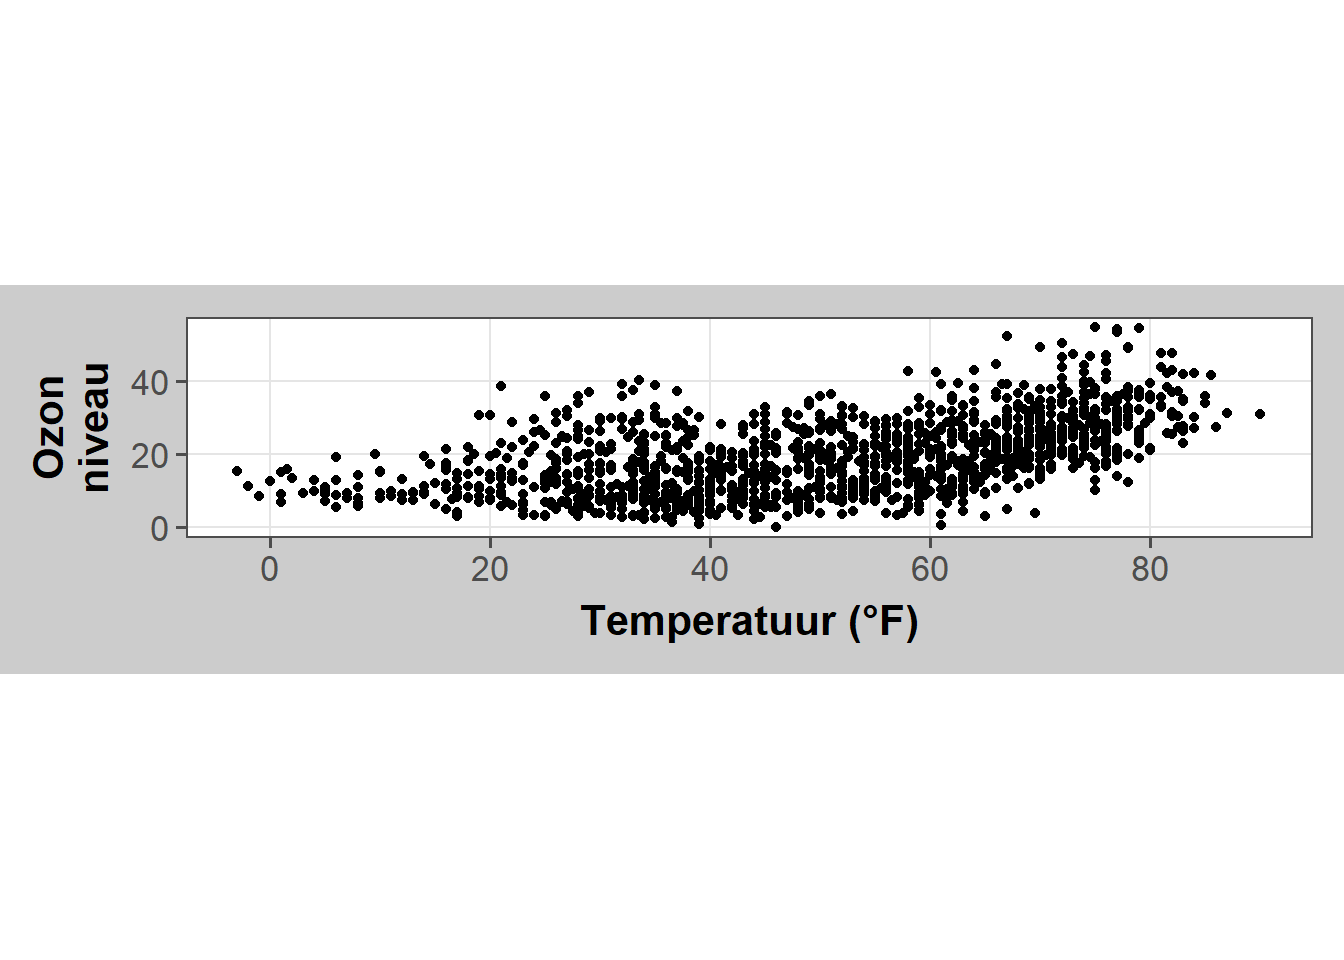
Een as omkeren
Je kunt een as ook eenvoudig omkeren met scale_x_reverse() of scale_y_reverse(), respectievelijk:
ggplot(chic, aes(x = date, y = temp, color = o3)) +
geom_point() +
labs(x = "Year", y = "Temperature (°F)") +
scale_y_reverse()Warning in grid.Call(C_textBounds, as.graphicsAnnot(x$label), x$x, x$y, : font
family not found in Windows font database
Warning in grid.Call(C_textBounds, as.graphicsAnnot(x$label), x$x, x$y, : font
family not found in Windows font database
Warning in grid.Call(C_textBounds, as.graphicsAnnot(x$label), x$x, x$y, : font
family not found in Windows font database
Warning in grid.Call(C_textBounds, as.graphicsAnnot(x$label), x$x, x$y, : font
family not found in Windows font database
Warning in grid.Call(C_textBounds, as.graphicsAnnot(x$label), x$x, x$y, : font
family not found in Windows font database
Warning in grid.Call(C_textBounds, as.graphicsAnnot(x$label), x$x, x$y, : font
family not found in Windows font database
Warning in grid.Call(C_textBounds, as.graphicsAnnot(x$label), x$x, x$y, : font
family not found in Windows font database
Warning in grid.Call(C_textBounds, as.graphicsAnnot(x$label), x$x, x$y, : font
family not found in Windows font database
Warning in grid.Call(C_textBounds, as.graphicsAnnot(x$label), x$x, x$y, : font
family not found in Windows font databaseWarning in grid.Call.graphics(C_text, as.graphicsAnnot(x$label), x$x, x$y, :
font family not found in Windows font databaseWarning in grid.Call(C_textBounds, as.graphicsAnnot(x$label), x$x, x$y, : font
family not found in Windows font database
Warning in grid.Call(C_textBounds, as.graphicsAnnot(x$label), x$x, x$y, : font
family not found in Windows font database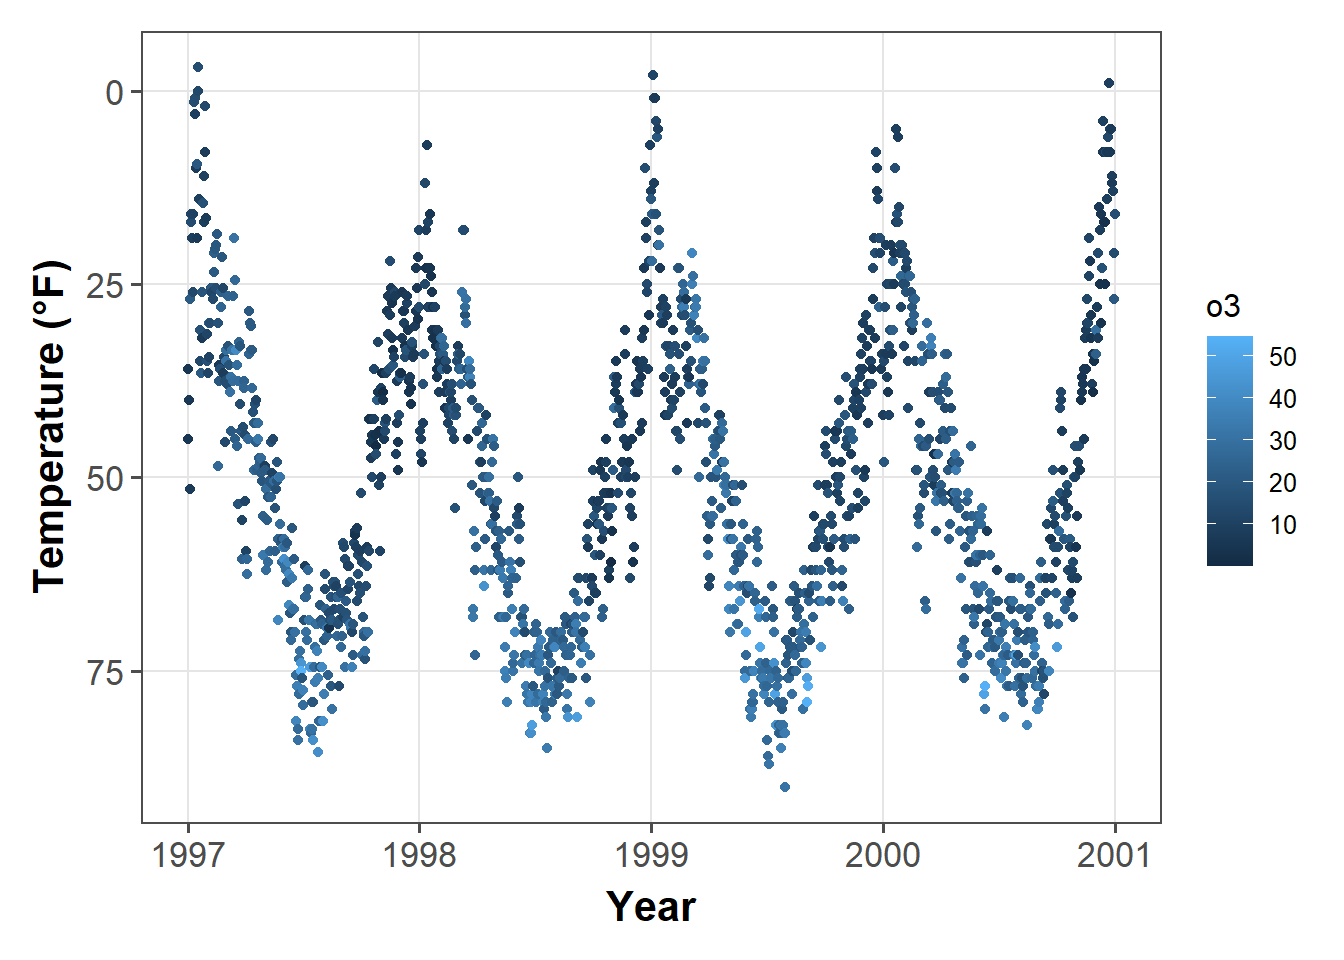
Merk op dat dit alleen werkt voor continue data. Als je discrete data wilt omdraaien, gebruik dan de
fct_rev()functie uit hetforcatspakket.
Transformeer een As
… of transformeer de standaard lineaire afbeelding door scale_y_log10() of scale_y_sqrt() te gebruiken. Als voorbeeld, hier is een log10-getransformeerde as (die NA’s introduceert in dit geval, dus wees voorzichtig):
ggplot(chic, aes(x = date, y = temp, color = o3)) +
geom_point() +
labs(x = "Jaar", y = "Temperatuur (°F)") +
scale_y_log10(lim = c(0.1, 100))Warning in self$trans$transform(x): NaNs producedWarning: Transformation introduced infinite values in continuous y-axisWarning: Removed 3 rows containing missing values (geom_point).Warning in grid.Call(C_textBounds, as.graphicsAnnot(x$label), x$x, x$y, : font
family not found in Windows font database
Warning in grid.Call(C_textBounds, as.graphicsAnnot(x$label), x$x, x$y, : font
family not found in Windows font database
Warning in grid.Call(C_textBounds, as.graphicsAnnot(x$label), x$x, x$y, : font
family not found in Windows font database
Warning in grid.Call(C_textBounds, as.graphicsAnnot(x$label), x$x, x$y, : font
family not found in Windows font database
Warning in grid.Call(C_textBounds, as.graphicsAnnot(x$label), x$x, x$y, : font
family not found in Windows font database
Warning in grid.Call(C_textBounds, as.graphicsAnnot(x$label), x$x, x$y, : font
family not found in Windows font database
Warning in grid.Call(C_textBounds, as.graphicsAnnot(x$label), x$x, x$y, : font
family not found in Windows font database
Warning in grid.Call(C_textBounds, as.graphicsAnnot(x$label), x$x, x$y, : font
family not found in Windows font database
Warning in grid.Call(C_textBounds, as.graphicsAnnot(x$label), x$x, x$y, : font
family not found in Windows font databaseWarning in grid.Call.graphics(C_text, as.graphicsAnnot(x$label), x$x, x$y, :
font family not found in Windows font databaseWarning in grid.Call(C_textBounds, as.graphicsAnnot(x$label), x$x, x$y, : font
family not found in Windows font database
Warning in grid.Call(C_textBounds, as.graphicsAnnot(x$label), x$x, x$y, : font
family not found in Windows font database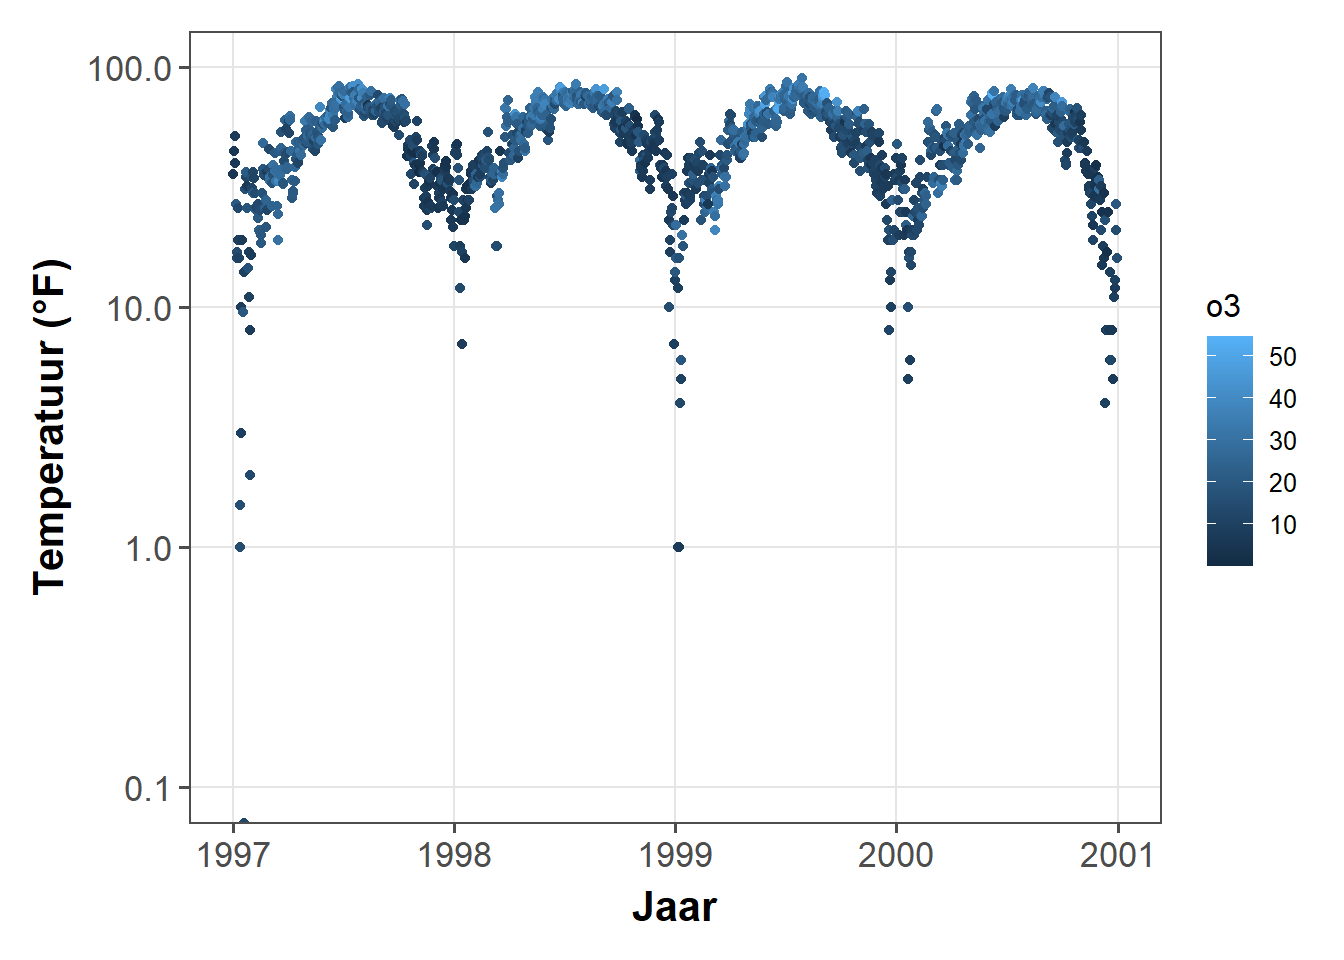
Een Plot Circulariseren
Het is ook mogelijk om het coördinatenstelsel te circulariseren (polariseren?) door coord_polar() op te roepen.
library(tidyverse)
chic %>%
dplyr::group_by(season) %>%
dplyr::summarize(o3 = median(o3)) %>%
ggplot(aes(x = season, y = o3)) +
geom_col(aes(fill = season), color = NA) +
labs(x = "", y = "Mediaan Ozonniveau") +
coord_polar() +
guides(fill = FALSE)Warning: `guides(<scale> = FALSE)` is deprecated. Please use `guides(<scale> =
"none")` instead.Warning in grid.Call(C_textBounds, as.graphicsAnnot(x$label), x$x, x$y, : font
family not found in Windows font database
Warning in grid.Call(C_textBounds, as.graphicsAnnot(x$label), x$x, x$y, : font
family not found in Windows font database
Warning in grid.Call(C_textBounds, as.graphicsAnnot(x$label), x$x, x$y, : font
family not found in Windows font database
Warning in grid.Call(C_textBounds, as.graphicsAnnot(x$label), x$x, x$y, : font
family not found in Windows font database
Warning in grid.Call(C_textBounds, as.graphicsAnnot(x$label), x$x, x$y, : font
family not found in Windows font databaseWarning in grid.Call.graphics(C_text, as.graphicsAnnot(x$label), x$x, x$y, :
font family not found in Windows font databaseWarning in grid.Call(C_textBounds, as.graphicsAnnot(x$label), x$x, x$y, : font
family not found in Windows font databaseWarning in grid.Call.graphics(C_text, as.graphicsAnnot(x$label), x$x, x$y, :
font family not found in Windows font database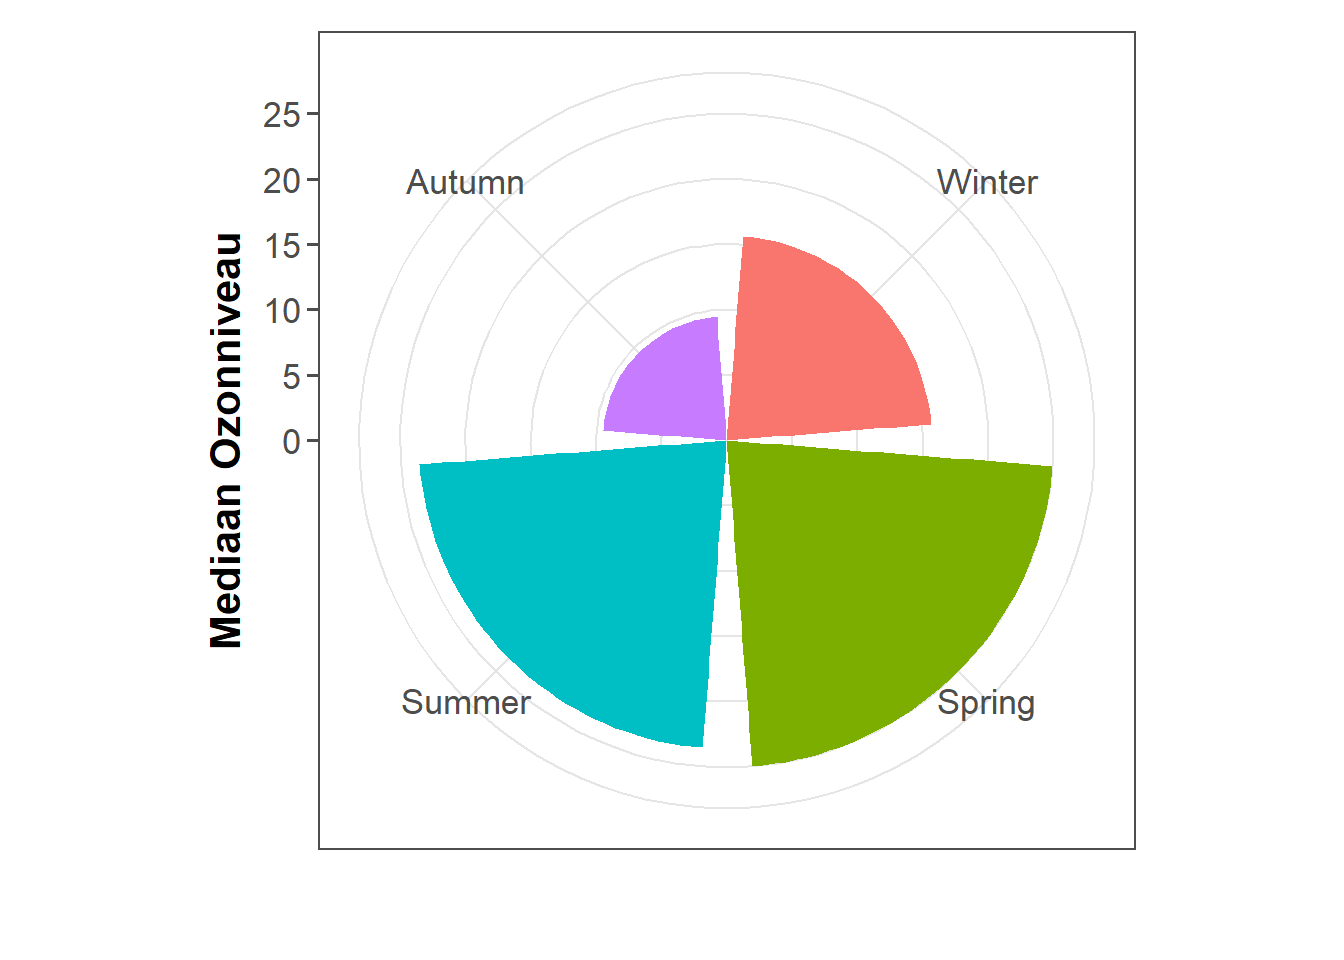
Met dit coördinatenstelsel kunnen ook cirkeldiagrammen worden getekend:
chic_sum <-
chic %>%
dplyr::mutate(o3_avg = median(o3)) %>%
dplyr::filter(o3 > o3_avg) %>%
dplyr::mutate(n_all = n()) %>%
dplyr::group_by(season) %>%
dplyr::summarize(rel = n() / unique(n_all))
ggplot(chic_sum, aes(x = "", y = rel)) +
geom_col(aes(fill = season), width = 1, color = NA) +
labs(x = "", y = "Proportie dagen boven\nhet mediaan Ozonniveau") +
coord_polar(theta = "y") +
scale_fill_brewer(palette = "Set1", name = "Season:") +
theme(axis.ticks = element_blank(),
panel.grid = element_blank())Warning in grid.Call(C_textBounds, as.graphicsAnnot(x$label), x$x, x$y, : font
family not found in Windows font database
Warning in grid.Call(C_textBounds, as.graphicsAnnot(x$label), x$x, x$y, : font
family not found in Windows font database
Warning in grid.Call(C_textBounds, as.graphicsAnnot(x$label), x$x, x$y, : font
family not found in Windows font database
Warning in grid.Call(C_textBounds, as.graphicsAnnot(x$label), x$x, x$y, : font
family not found in Windows font database
Warning in grid.Call(C_textBounds, as.graphicsAnnot(x$label), x$x, x$y, : font
family not found in Windows font database
Warning in grid.Call(C_textBounds, as.graphicsAnnot(x$label), x$x, x$y, : font
family not found in Windows font database
Warning in grid.Call(C_textBounds, as.graphicsAnnot(x$label), x$x, x$y, : font
family not found in Windows font databaseWarning in grid.Call.graphics(C_text, as.graphicsAnnot(x$label), x$x, x$y, :
font family not found in Windows font databaseWarning in grid.Call(C_textBounds, as.graphicsAnnot(x$label), x$x, x$y, : font
family not found in Windows font database
Warning in grid.Call(C_textBounds, as.graphicsAnnot(x$label), x$x, x$y, : font
family not found in Windows font database
Warning in grid.Call(C_textBounds, as.graphicsAnnot(x$label), x$x, x$y, : font
family not found in Windows font database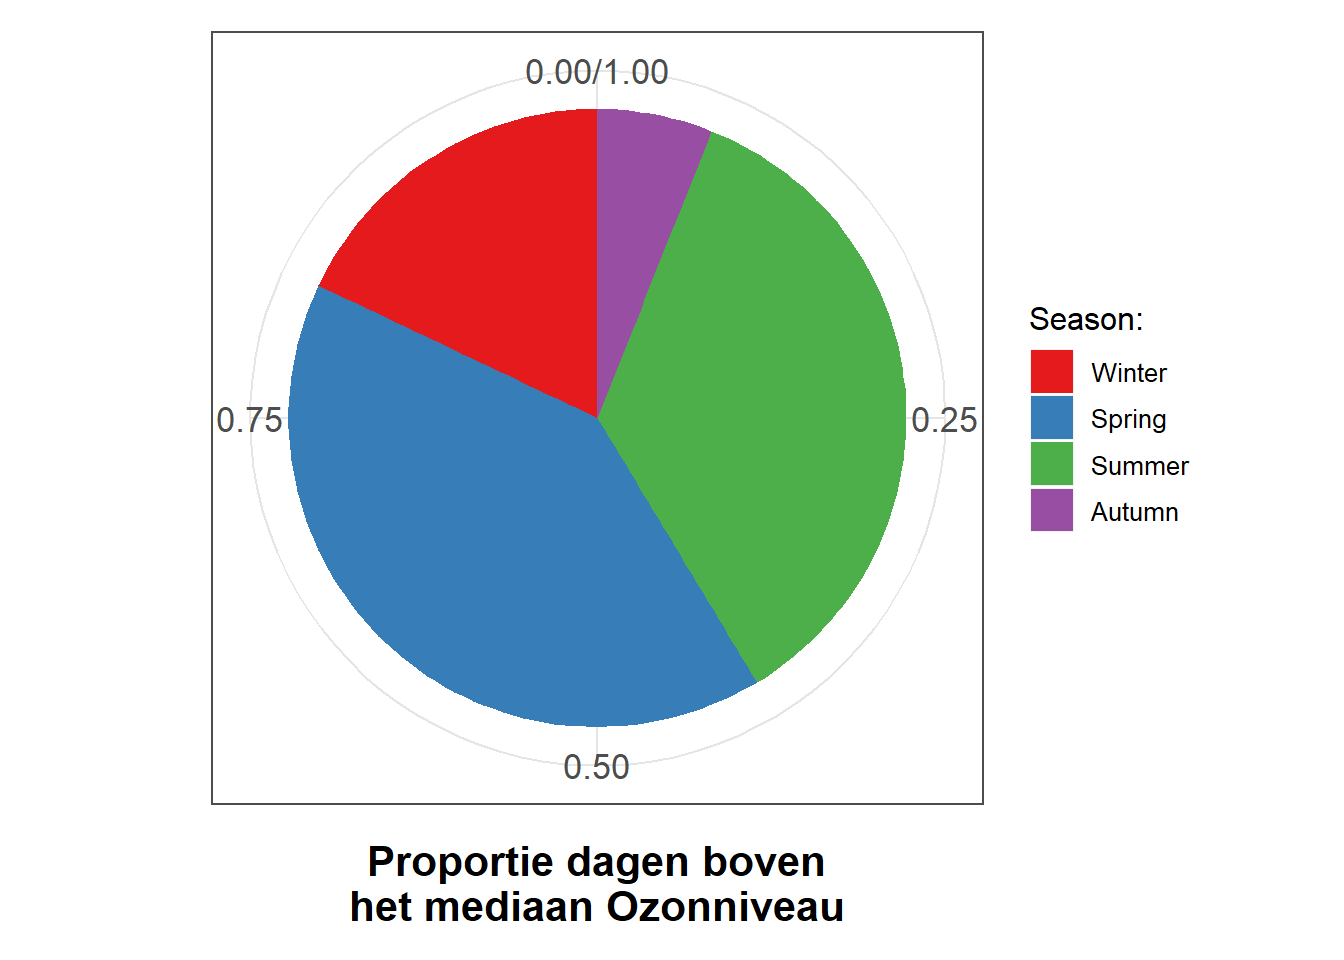
Ik stel voor om altijd ook te kijken naar het resultaat van dezelfde code in een Cartesisch coördinatensysteem, wat de standaard is, om de logica achter coord_polar() en theta te begrijpen:
ggplot(chic_sum, aes(x = "", y = rel)) +
geom_col(aes(fill = season), width = 1, color = NA) +
labs(x = "", y = "Proportie dagen boven \nhet mediaan Ozonniveau") +
#coord_polar(theta = "y") +
scale_fill_brewer(palette = "Set1", name = "Season:") +
theme(axis.ticks = element_blank(),
panel.grid = element_blank())Warning in grid.Call(C_textBounds, as.graphicsAnnot(x$label), x$x, x$y, : font
family not found in Windows font database
Warning in grid.Call(C_textBounds, as.graphicsAnnot(x$label), x$x, x$y, : font
family not found in Windows font database
Warning in grid.Call(C_textBounds, as.graphicsAnnot(x$label), x$x, x$y, : font
family not found in Windows font database
Warning in grid.Call(C_textBounds, as.graphicsAnnot(x$label), x$x, x$y, : font
family not found in Windows font database
Warning in grid.Call(C_textBounds, as.graphicsAnnot(x$label), x$x, x$y, : font
family not found in Windows font database
Warning in grid.Call(C_textBounds, as.graphicsAnnot(x$label), x$x, x$y, : font
family not found in Windows font database
Warning in grid.Call(C_textBounds, as.graphicsAnnot(x$label), x$x, x$y, : font
family not found in Windows font database
Warning in grid.Call(C_textBounds, as.graphicsAnnot(x$label), x$x, x$y, : font
family not found in Windows font database
Warning in grid.Call(C_textBounds, as.graphicsAnnot(x$label), x$x, x$y, : font
family not found in Windows font databaseWarning in grid.Call.graphics(C_text, as.graphicsAnnot(x$label), x$x, x$y, :
font family not found in Windows font database
Warning in grid.Call.graphics(C_text, as.graphicsAnnot(x$label), x$x, x$y, :
font family not found in Windows font database
Warning in grid.Call.graphics(C_text, as.graphicsAnnot(x$label), x$x, x$y, :
font family not found in Windows font databaseWarning in grid.Call(C_textBounds, as.graphicsAnnot(x$label), x$x, x$y, : font
family not found in Windows font database
Warning in grid.Call(C_textBounds, as.graphicsAnnot(x$label), x$x, x$y, : font
family not found in Windows font database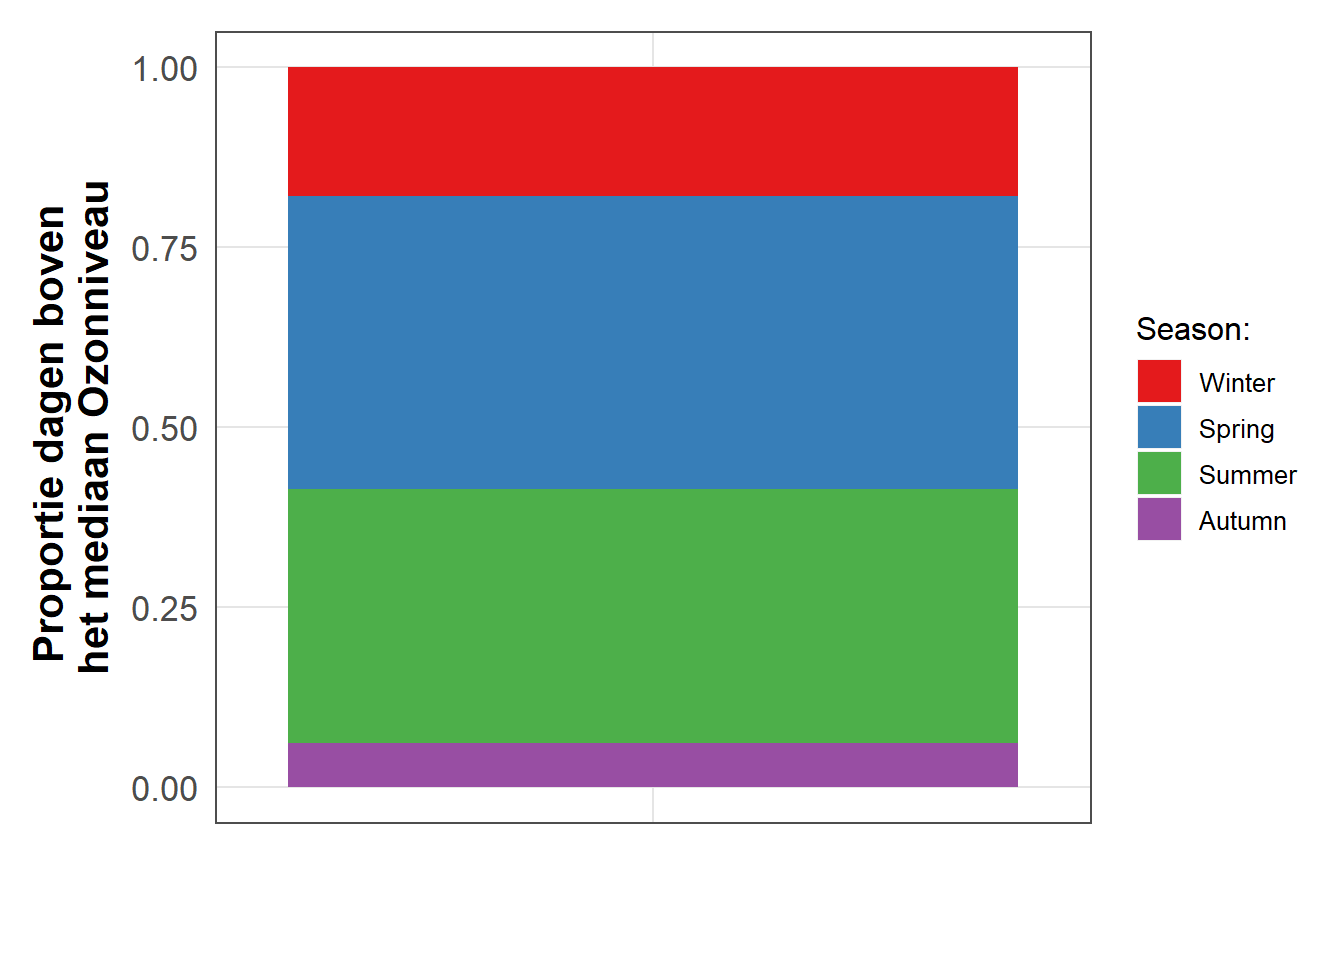
Werken met Grafiek Typen
Alternatieven voor een Box Plot
Box plots zijn geweldig, maar ze kunnen zo ontzettend saai zijn. En zelfs als je gewend bent om naar box plots te kijken, bedenk dan dat er veel mensen naar uw plot kunnen kijken die nog nooit een box and whisker plot hebben gezien. pand for a short recap on box and whiskers plots.
Er zijn alternatieven, maar eerst plotten we een gewone boxplot:
g <-
ggplot(chic, aes(x = season, y = o3,
color = season)) +
labs(x = "Seizoen", y = "Ozon") +
scale_color_brewer(palette = "Dark2", guide = "none")
g + geom_boxplot()Warning in grid.Call(C_textBounds, as.graphicsAnnot(x$label), x$x, x$y, : font
family not found in Windows font database
Warning in grid.Call(C_textBounds, as.graphicsAnnot(x$label), x$x, x$y, : font
family not found in Windows font database
Warning in grid.Call(C_textBounds, as.graphicsAnnot(x$label), x$x, x$y, : font
family not found in Windows font database
Warning in grid.Call(C_textBounds, as.graphicsAnnot(x$label), x$x, x$y, : font
family not found in Windows font database
Warning in grid.Call(C_textBounds, as.graphicsAnnot(x$label), x$x, x$y, : font
family not found in Windows font database
Warning in grid.Call(C_textBounds, as.graphicsAnnot(x$label), x$x, x$y, : font
family not found in Windows font database
Warning in grid.Call(C_textBounds, as.graphicsAnnot(x$label), x$x, x$y, : font
family not found in Windows font databaseWarning in grid.Call.graphics(C_text, as.graphicsAnnot(x$label), x$x, x$y, :
font family not found in Windows font database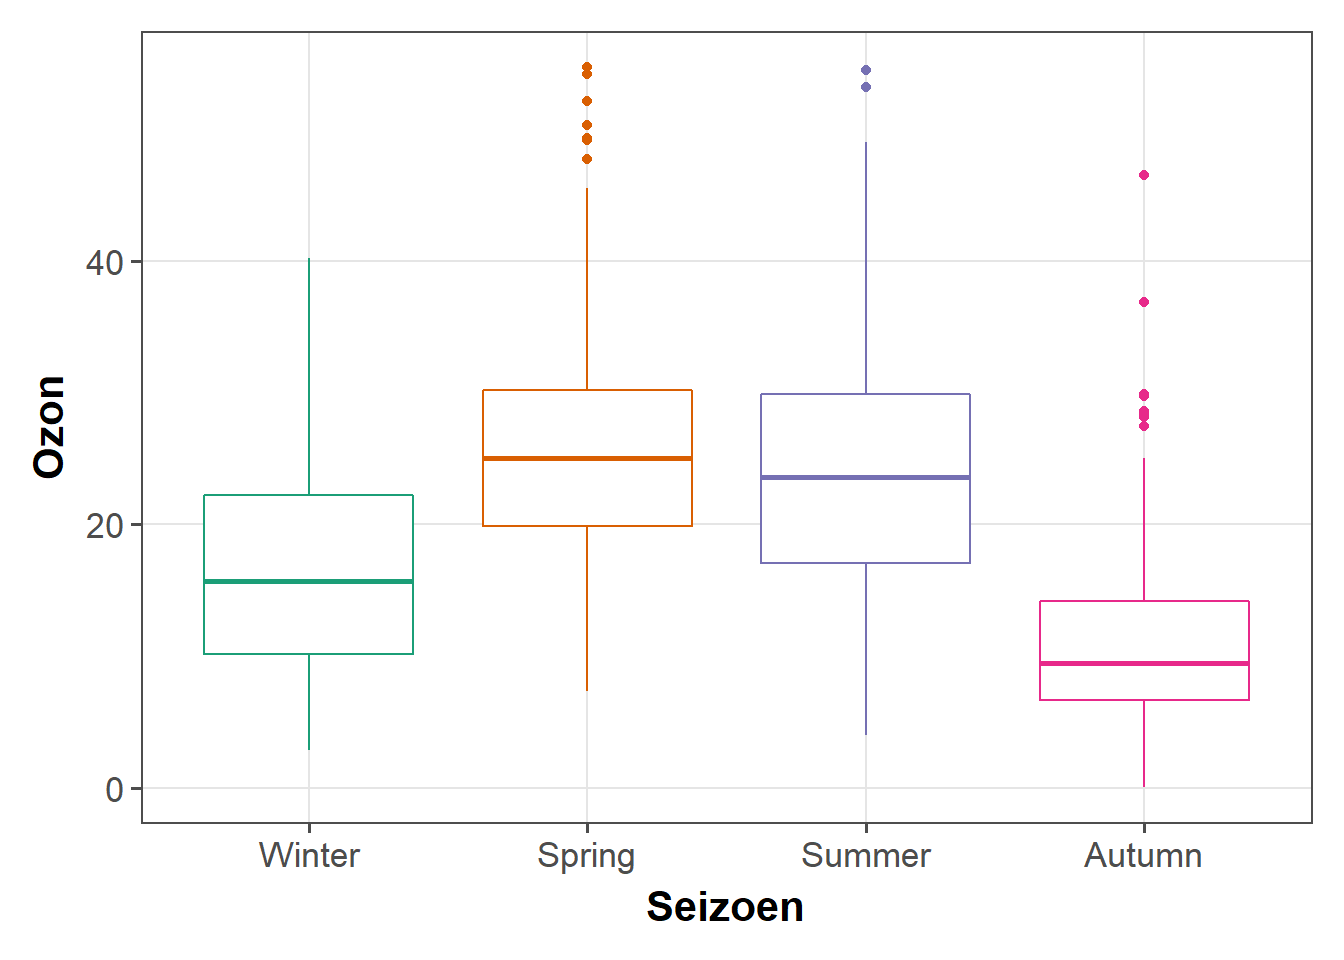
1. Alternatief: Uitzetten van punten
Laten we gewoon elk gegevenspunt van de ruwe gegevens uitzetten:
g + geom_point()Warning in grid.Call(C_textBounds, as.graphicsAnnot(x$label), x$x, x$y, : font
family not found in Windows font database
Warning in grid.Call(C_textBounds, as.graphicsAnnot(x$label), x$x, x$y, : font
family not found in Windows font database
Warning in grid.Call(C_textBounds, as.graphicsAnnot(x$label), x$x, x$y, : font
family not found in Windows font database
Warning in grid.Call(C_textBounds, as.graphicsAnnot(x$label), x$x, x$y, : font
family not found in Windows font database
Warning in grid.Call(C_textBounds, as.graphicsAnnot(x$label), x$x, x$y, : font
family not found in Windows font database
Warning in grid.Call(C_textBounds, as.graphicsAnnot(x$label), x$x, x$y, : font
family not found in Windows font database
Warning in grid.Call(C_textBounds, as.graphicsAnnot(x$label), x$x, x$y, : font
family not found in Windows font databaseWarning in grid.Call.graphics(C_text, as.graphicsAnnot(x$label), x$x, x$y, :
font family not found in Windows font database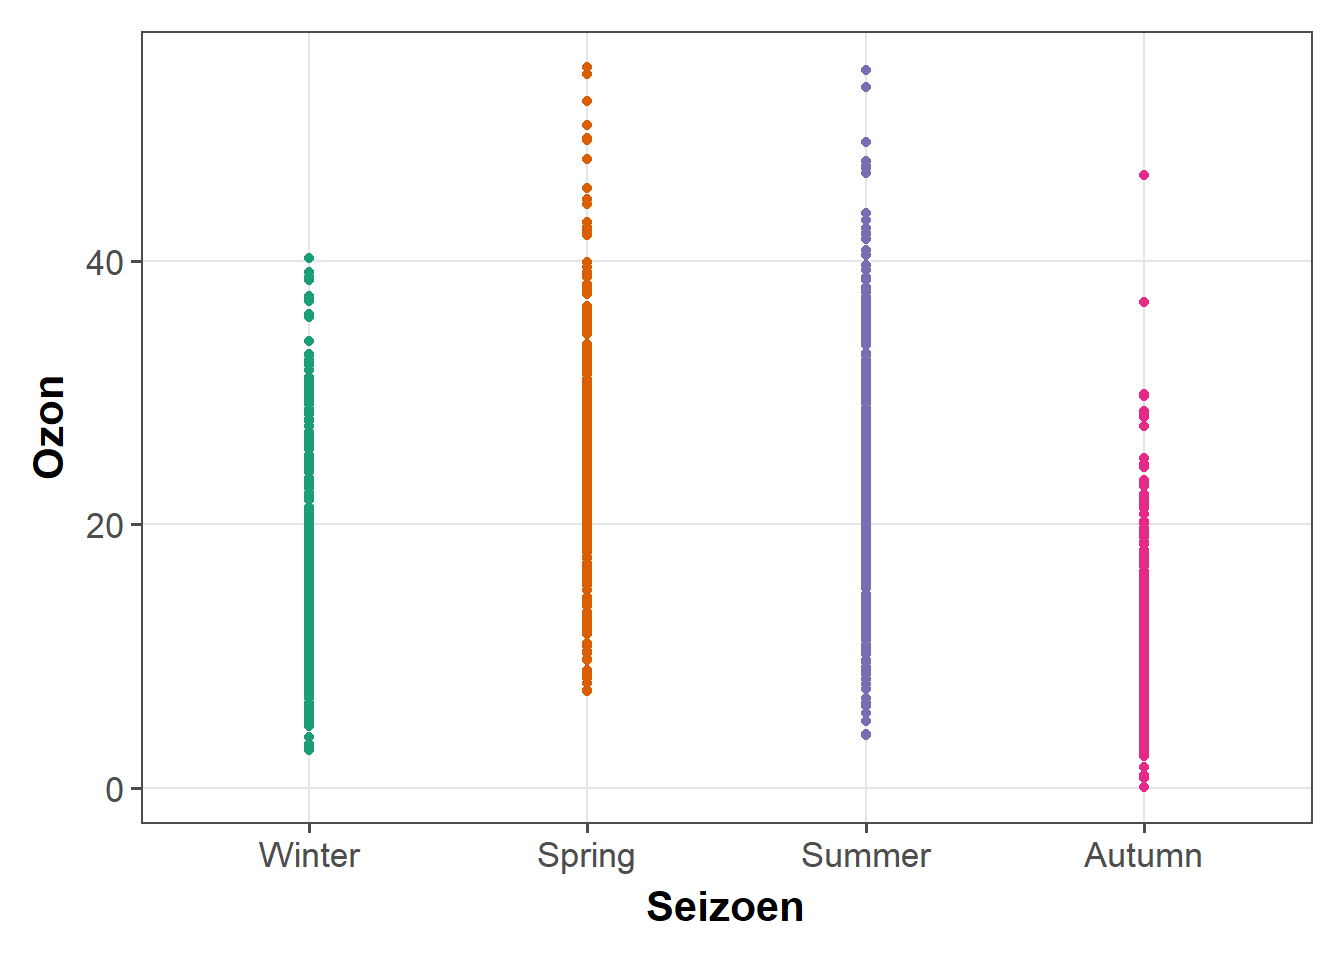
Niet alleen saai, maar ook niet informatief. Om de plot te verbeteren, zou men transparantie kunnen toevoegen om overplotting tegen te gaan:
g + geom_point(alpha = .1)Warning in grid.Call(C_textBounds, as.graphicsAnnot(x$label), x$x, x$y, : font
family not found in Windows font database
Warning in grid.Call(C_textBounds, as.graphicsAnnot(x$label), x$x, x$y, : font
family not found in Windows font database
Warning in grid.Call(C_textBounds, as.graphicsAnnot(x$label), x$x, x$y, : font
family not found in Windows font database
Warning in grid.Call(C_textBounds, as.graphicsAnnot(x$label), x$x, x$y, : font
family not found in Windows font database
Warning in grid.Call(C_textBounds, as.graphicsAnnot(x$label), x$x, x$y, : font
family not found in Windows font database
Warning in grid.Call(C_textBounds, as.graphicsAnnot(x$label), x$x, x$y, : font
family not found in Windows font database
Warning in grid.Call(C_textBounds, as.graphicsAnnot(x$label), x$x, x$y, : font
family not found in Windows font databaseWarning in grid.Call.graphics(C_text, as.graphicsAnnot(x$label), x$x, x$y, :
font family not found in Windows font database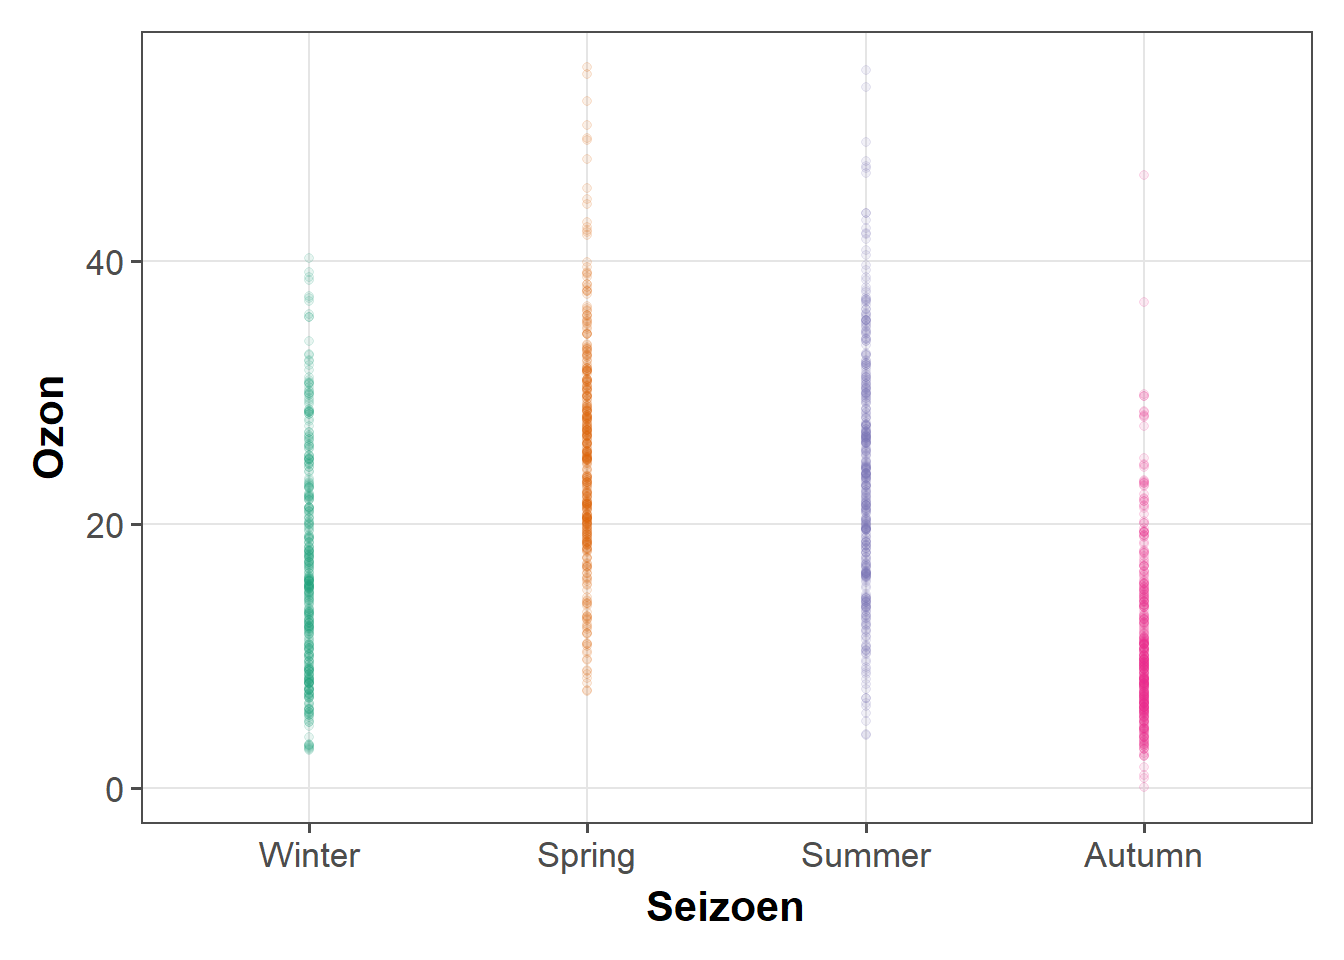
Transparantie instellen is hier echter moeilijk, omdat ofwel de overlapping nog te groot is, ofwel de extreme waarden niet zichtbaar zijn. Slecht, dus laten we iets anders proberen.
2. Alternatief: Jitter de punten
Probeer een beetje jitter toe te voegen aan de data. Ik hou hiervan voor interne visualisatie, maar wees voorzichtig met jittering omdat je opzettelijk ruis toevoegt aan je data en dit kan resulteren in een verkeerde interpretatie van je data.
g + geom_jitter(width = .3, alpha = .5)Warning in grid.Call(C_textBounds, as.graphicsAnnot(x$label), x$x, x$y, : font
family not found in Windows font database
Warning in grid.Call(C_textBounds, as.graphicsAnnot(x$label), x$x, x$y, : font
family not found in Windows font database
Warning in grid.Call(C_textBounds, as.graphicsAnnot(x$label), x$x, x$y, : font
family not found in Windows font database
Warning in grid.Call(C_textBounds, as.graphicsAnnot(x$label), x$x, x$y, : font
family not found in Windows font database
Warning in grid.Call(C_textBounds, as.graphicsAnnot(x$label), x$x, x$y, : font
family not found in Windows font database
Warning in grid.Call(C_textBounds, as.graphicsAnnot(x$label), x$x, x$y, : font
family not found in Windows font database
Warning in grid.Call(C_textBounds, as.graphicsAnnot(x$label), x$x, x$y, : font
family not found in Windows font databaseWarning in grid.Call.graphics(C_text, as.graphicsAnnot(x$label), x$x, x$y, :
font family not found in Windows font database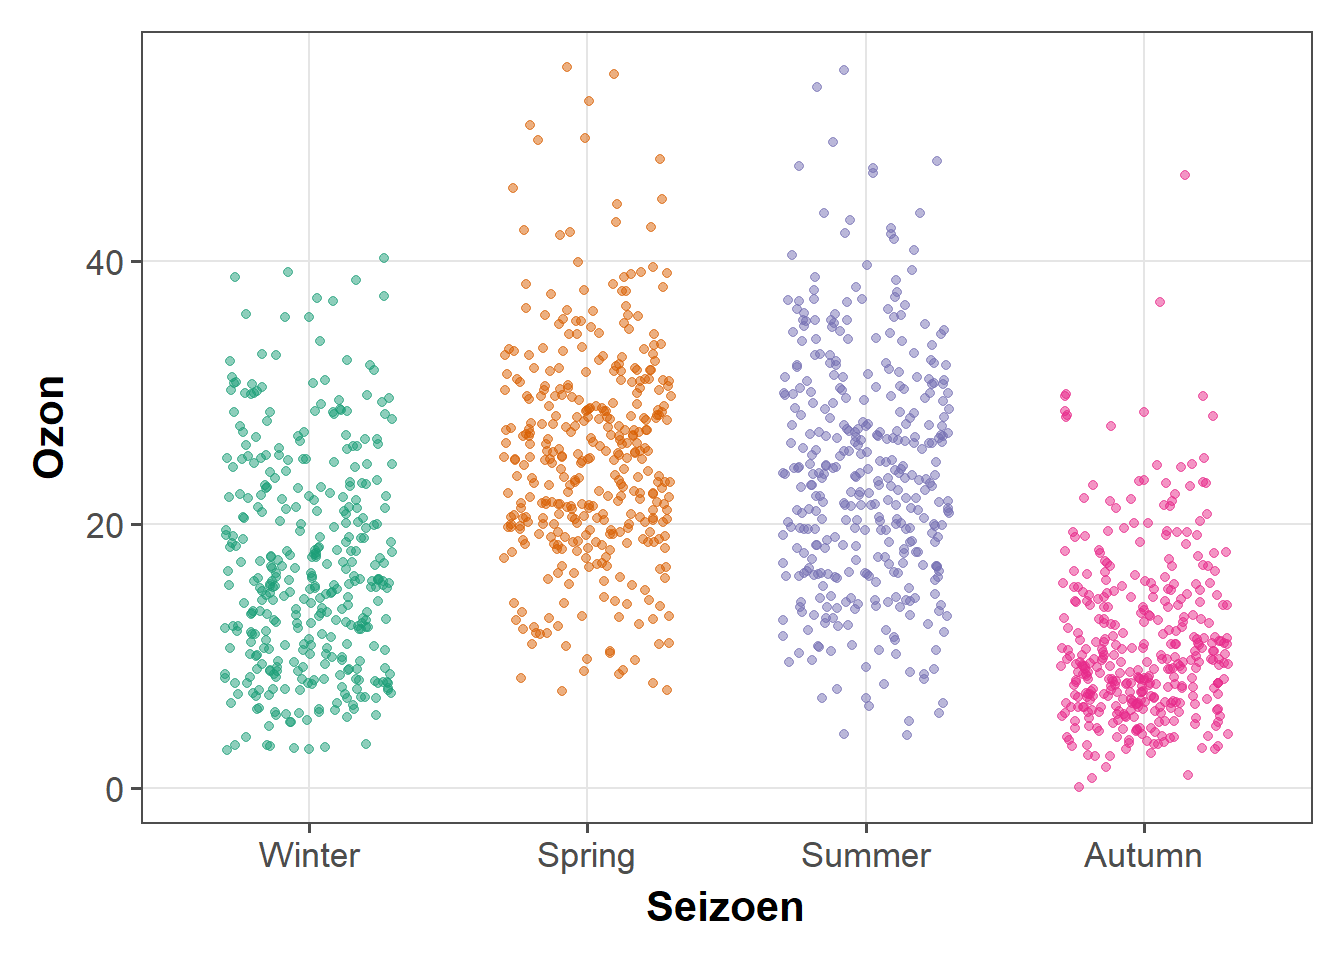
3. Alternatief: Vioolplots
Vioolplots, vergelijkbaar met boxplots behalve dat u een kerneldichtheid gebruikt om te tonen waar u de meeste gegevens hebt, zijn een nuttige visualisatie.
g + geom_violin(fill = "gray80", size = 1, alpha = .5)Warning in grid.Call(C_textBounds, as.graphicsAnnot(x$label), x$x, x$y, : font
family not found in Windows font database
Warning in grid.Call(C_textBounds, as.graphicsAnnot(x$label), x$x, x$y, : font
family not found in Windows font database
Warning in grid.Call(C_textBounds, as.graphicsAnnot(x$label), x$x, x$y, : font
family not found in Windows font database
Warning in grid.Call(C_textBounds, as.graphicsAnnot(x$label), x$x, x$y, : font
family not found in Windows font database
Warning in grid.Call(C_textBounds, as.graphicsAnnot(x$label), x$x, x$y, : font
family not found in Windows font database
Warning in grid.Call(C_textBounds, as.graphicsAnnot(x$label), x$x, x$y, : font
family not found in Windows font database
Warning in grid.Call(C_textBounds, as.graphicsAnnot(x$label), x$x, x$y, : font
family not found in Windows font databaseWarning in grid.Call.graphics(C_text, as.graphicsAnnot(x$label), x$x, x$y, :
font family not found in Windows font database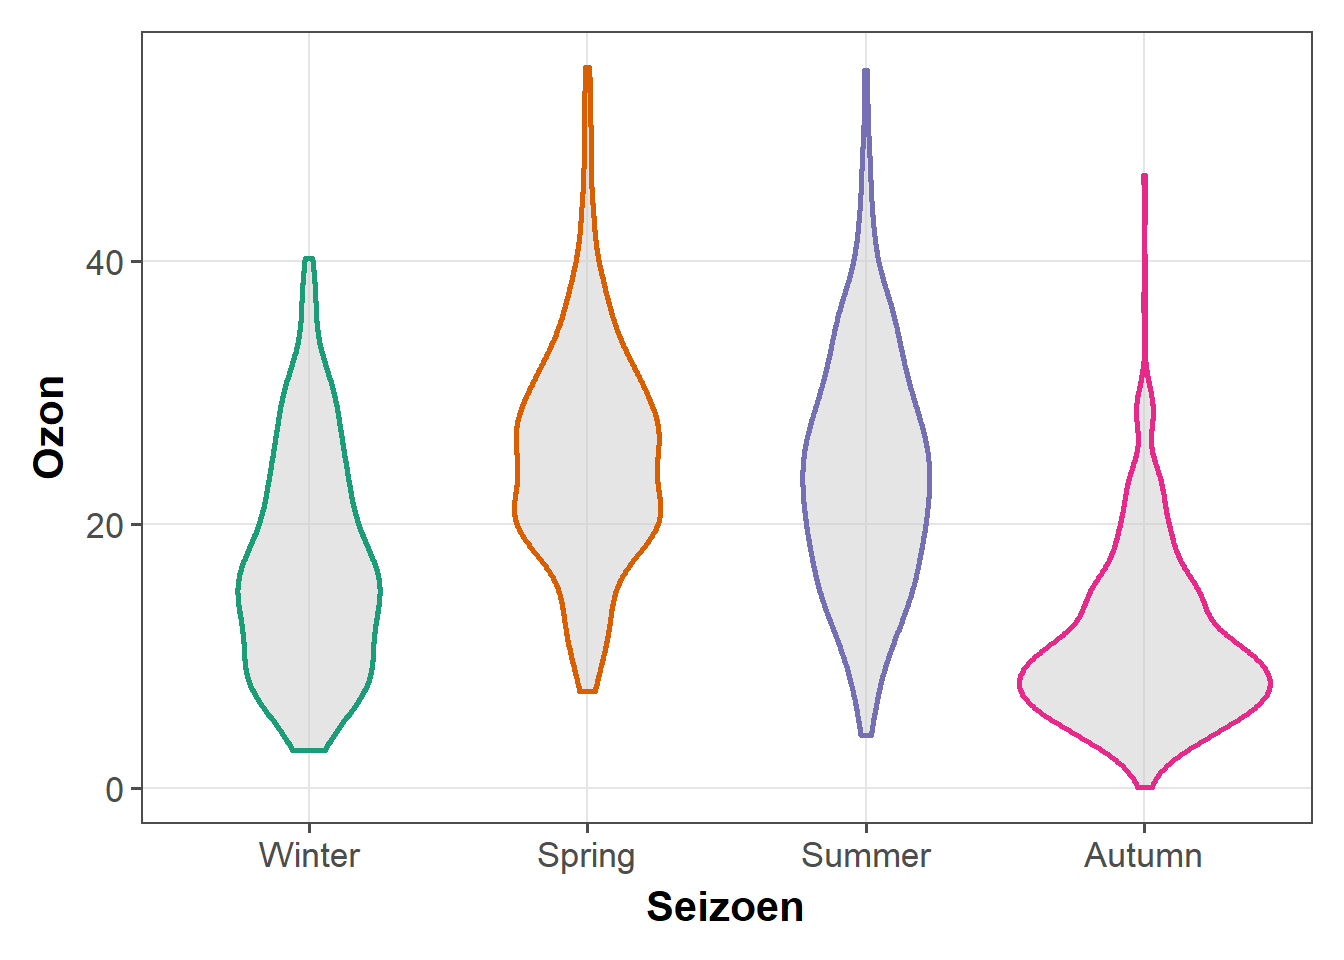
4. Alternatief: Vioolplots combineren met Jitter
We kunnen natuurlijk beide combineren, geschatte dichtheden en de ruwe datapunten:
g + geom_violin(fill = "gray80", size = 1, alpha = .5) +
geom_jitter(alpha = .25, width = .3) +
coord_flip()Warning in grid.Call(C_textBounds, as.graphicsAnnot(x$label), x$x, x$y, : font
family not found in Windows font database
Warning in grid.Call(C_textBounds, as.graphicsAnnot(x$label), x$x, x$y, : font
family not found in Windows font database
Warning in grid.Call(C_textBounds, as.graphicsAnnot(x$label), x$x, x$y, : font
family not found in Windows font database
Warning in grid.Call(C_textBounds, as.graphicsAnnot(x$label), x$x, x$y, : font
family not found in Windows font database
Warning in grid.Call(C_textBounds, as.graphicsAnnot(x$label), x$x, x$y, : font
family not found in Windows font database
Warning in grid.Call(C_textBounds, as.graphicsAnnot(x$label), x$x, x$y, : font
family not found in Windows font database
Warning in grid.Call(C_textBounds, as.graphicsAnnot(x$label), x$x, x$y, : font
family not found in Windows font databaseWarning in grid.Call.graphics(C_text, as.graphicsAnnot(x$label), x$x, x$y, :
font family not found in Windows font database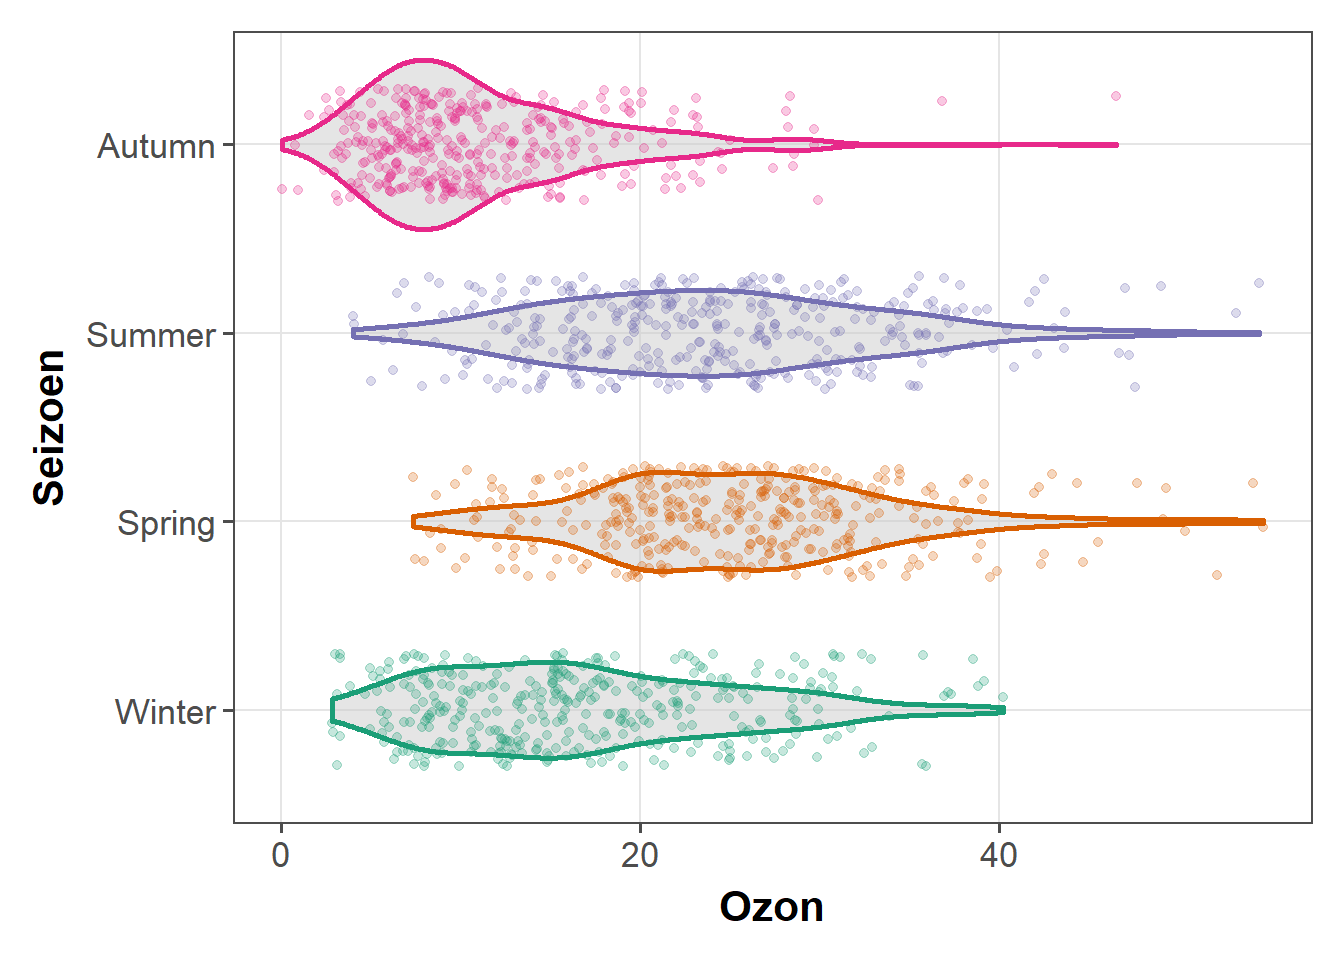
Het ggforce pakket biedt zogenaamde sina functies waarbij de breedte van de jitter wordt geregeld door de dichtheidsverdeling van de gegevens-dat maakt de jittering een beetje visueel aantrekkelijker:
library(ggforce)
g + geom_violin(fill = "gray80", size = 1, alpha = .5) +
geom_sina(alpha = .25) +
coord_flip()Warning in grid.Call(C_textBounds, as.graphicsAnnot(x$label), x$x, x$y, : font
family not found in Windows font database
Warning in grid.Call(C_textBounds, as.graphicsAnnot(x$label), x$x, x$y, : font
family not found in Windows font database
Warning in grid.Call(C_textBounds, as.graphicsAnnot(x$label), x$x, x$y, : font
family not found in Windows font database
Warning in grid.Call(C_textBounds, as.graphicsAnnot(x$label), x$x, x$y, : font
family not found in Windows font database
Warning in grid.Call(C_textBounds, as.graphicsAnnot(x$label), x$x, x$y, : font
family not found in Windows font database
Warning in grid.Call(C_textBounds, as.graphicsAnnot(x$label), x$x, x$y, : font
family not found in Windows font database
Warning in grid.Call(C_textBounds, as.graphicsAnnot(x$label), x$x, x$y, : font
family not found in Windows font databaseWarning in grid.Call.graphics(C_text, as.graphicsAnnot(x$label), x$x, x$y, :
font family not found in Windows font database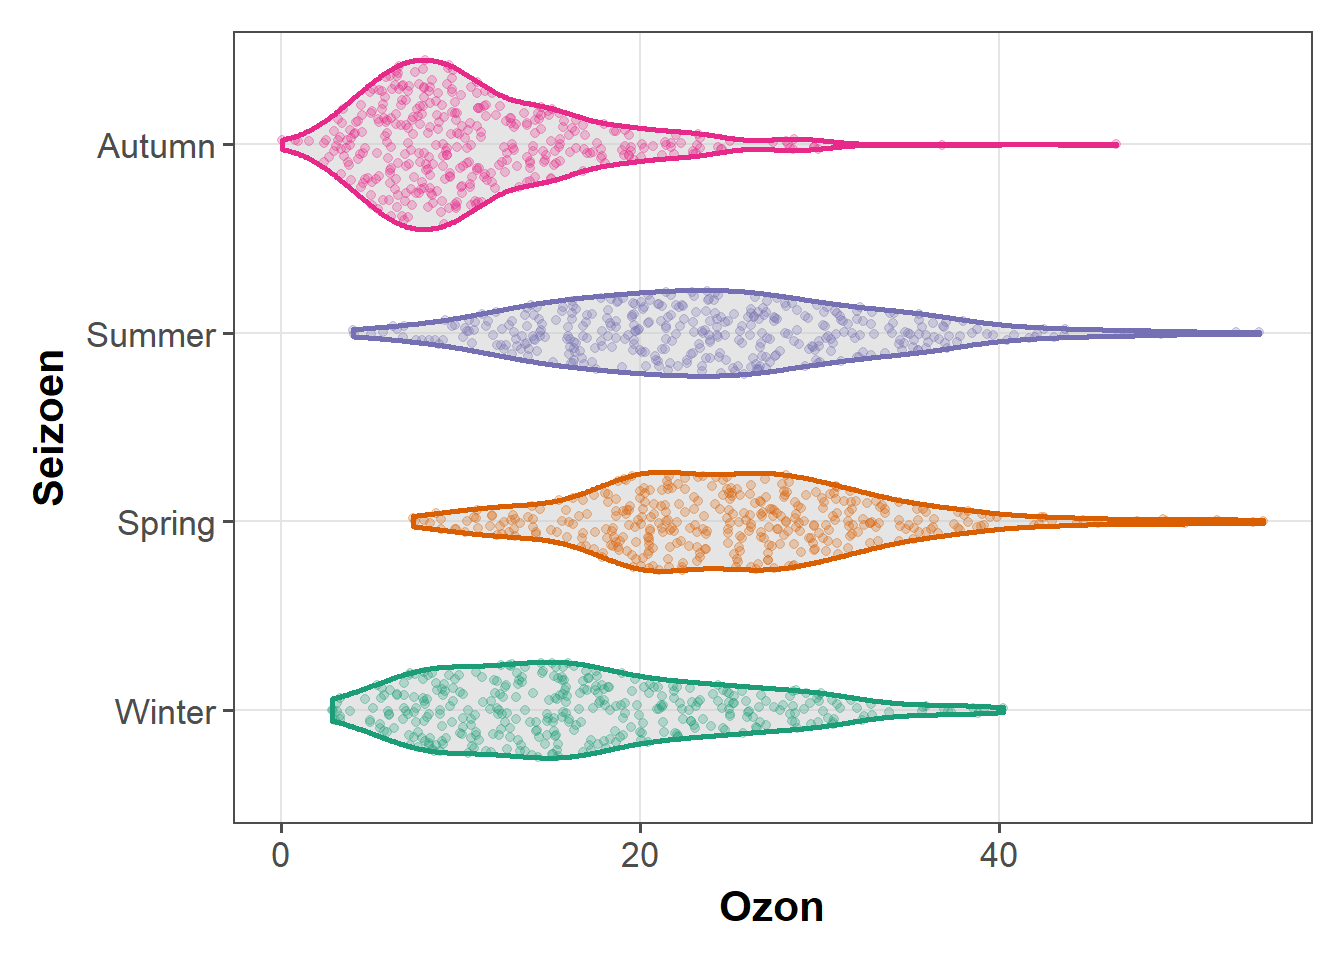
5. Alternatief: Vioolplots combineren met boxplots
Om de kwantielen gemakkelijk te kunnen schatten, kunnen wij de box van de boxplot ook binnen de violen plaatsen om het 25%-kwartiel, de mediaan en het 75%-kwartiel aan te geven:
g + geom_violin(aes(fill = season), size = 1, alpha = .5) +
geom_boxplot(outlier.alpha = 0, coef = 0,
color = "gray40", width = .2) +
scale_fill_brewer(palette = "Dark2", guide = "none") +
coord_flip()Warning in grid.Call(C_textBounds, as.graphicsAnnot(x$label), x$x, x$y, : font
family not found in Windows font database
Warning in grid.Call(C_textBounds, as.graphicsAnnot(x$label), x$x, x$y, : font
family not found in Windows font database
Warning in grid.Call(C_textBounds, as.graphicsAnnot(x$label), x$x, x$y, : font
family not found in Windows font database
Warning in grid.Call(C_textBounds, as.graphicsAnnot(x$label), x$x, x$y, : font
family not found in Windows font database
Warning in grid.Call(C_textBounds, as.graphicsAnnot(x$label), x$x, x$y, : font
family not found in Windows font database
Warning in grid.Call(C_textBounds, as.graphicsAnnot(x$label), x$x, x$y, : font
family not found in Windows font database
Warning in grid.Call(C_textBounds, as.graphicsAnnot(x$label), x$x, x$y, : font
family not found in Windows font databaseWarning in grid.Call.graphics(C_text, as.graphicsAnnot(x$label), x$x, x$y, :
font family not found in Windows font database
Een deken maken voor een plot
Een deken geeft de gegevens van één kwantitatieve variabele weer, weergegeven als markeringen langs een as. In de meeste gevallen wordt het gebruikt als aanvulling op scatter plots of heatmaps om de algemene verdeling van één of beide variabelen te visualiseren:
ggplot(chic, aes(x = date, y = temp,
color = season)) +
geom_point(show.legend = FALSE) +
geom_rug(show.legend = FALSE) +
labs(x = "Jaar", y = "Temperatuur (°F)")Warning in grid.Call(C_textBounds, as.graphicsAnnot(x$label), x$x, x$y, : font
family not found in Windows font database
Warning in grid.Call(C_textBounds, as.graphicsAnnot(x$label), x$x, x$y, : font
family not found in Windows font database
Warning in grid.Call(C_textBounds, as.graphicsAnnot(x$label), x$x, x$y, : font
family not found in Windows font database
Warning in grid.Call(C_textBounds, as.graphicsAnnot(x$label), x$x, x$y, : font
family not found in Windows font database
Warning in grid.Call(C_textBounds, as.graphicsAnnot(x$label), x$x, x$y, : font
family not found in Windows font database
Warning in grid.Call(C_textBounds, as.graphicsAnnot(x$label), x$x, x$y, : font
family not found in Windows font database
Warning in grid.Call(C_textBounds, as.graphicsAnnot(x$label), x$x, x$y, : font
family not found in Windows font databaseWarning in grid.Call.graphics(C_text, as.graphicsAnnot(x$label), x$x, x$y, :
font family not found in Windows font database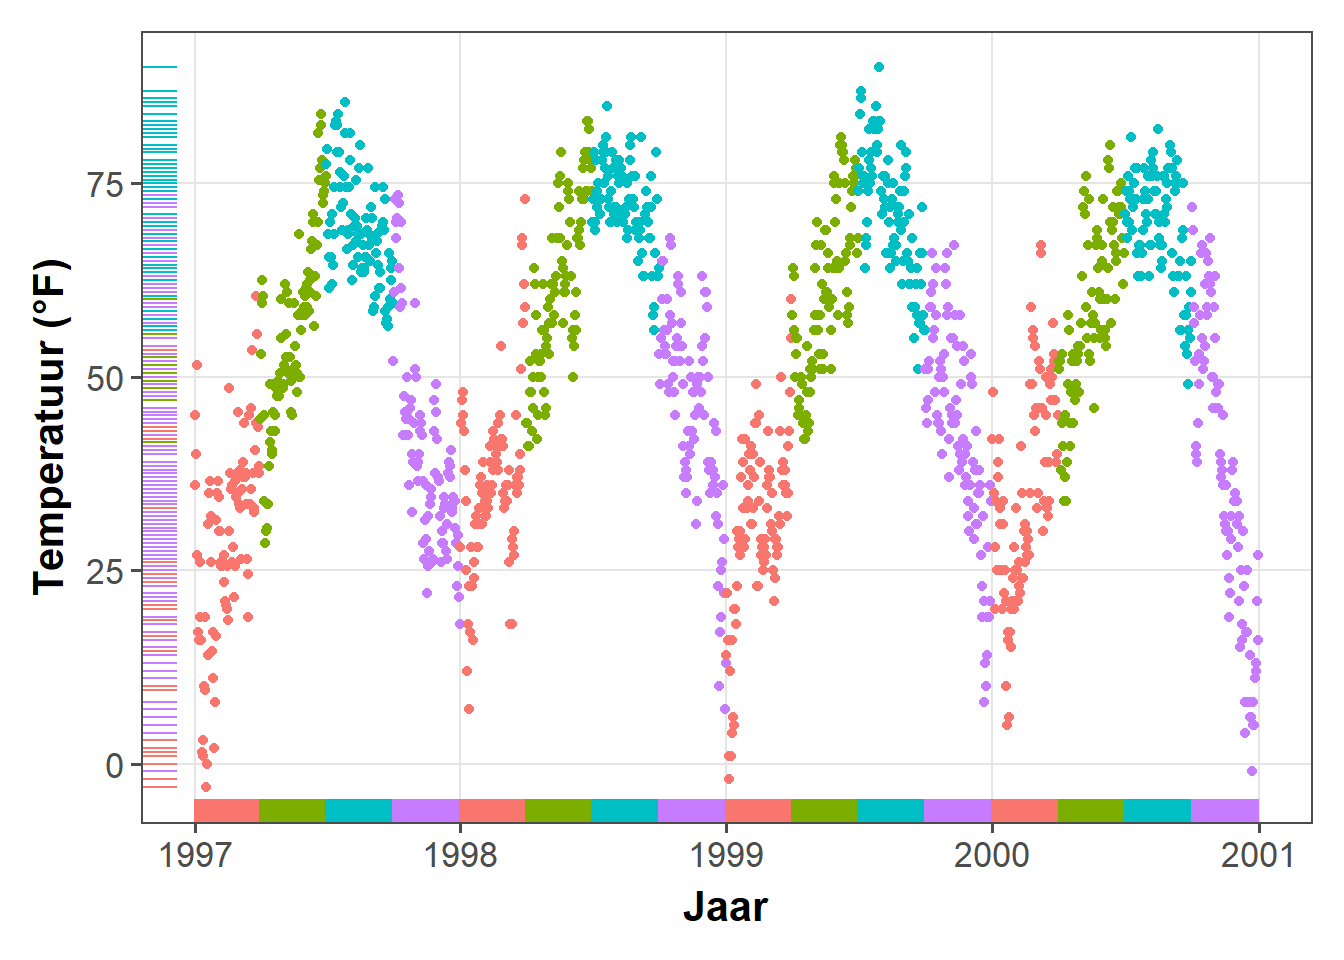
ggplot(chic, aes(x = date, y = temp, color = season)) +
geom_point(show.legend = FALSE) +
geom_rug(sides = "r", alpha = .3, show.legend = FALSE) +
labs(x = "Jaar", y = "Temperatuur (°F)")Warning in grid.Call(C_textBounds, as.graphicsAnnot(x$label), x$x, x$y, : font
family not found in Windows font database
Warning in grid.Call(C_textBounds, as.graphicsAnnot(x$label), x$x, x$y, : font
family not found in Windows font database
Warning in grid.Call(C_textBounds, as.graphicsAnnot(x$label), x$x, x$y, : font
family not found in Windows font database
Warning in grid.Call(C_textBounds, as.graphicsAnnot(x$label), x$x, x$y, : font
family not found in Windows font database
Warning in grid.Call(C_textBounds, as.graphicsAnnot(x$label), x$x, x$y, : font
family not found in Windows font database
Warning in grid.Call(C_textBounds, as.graphicsAnnot(x$label), x$x, x$y, : font
family not found in Windows font database
Warning in grid.Call(C_textBounds, as.graphicsAnnot(x$label), x$x, x$y, : font
family not found in Windows font databaseWarning in grid.Call.graphics(C_text, as.graphicsAnnot(x$label), x$x, x$y, :
font family not found in Windows font database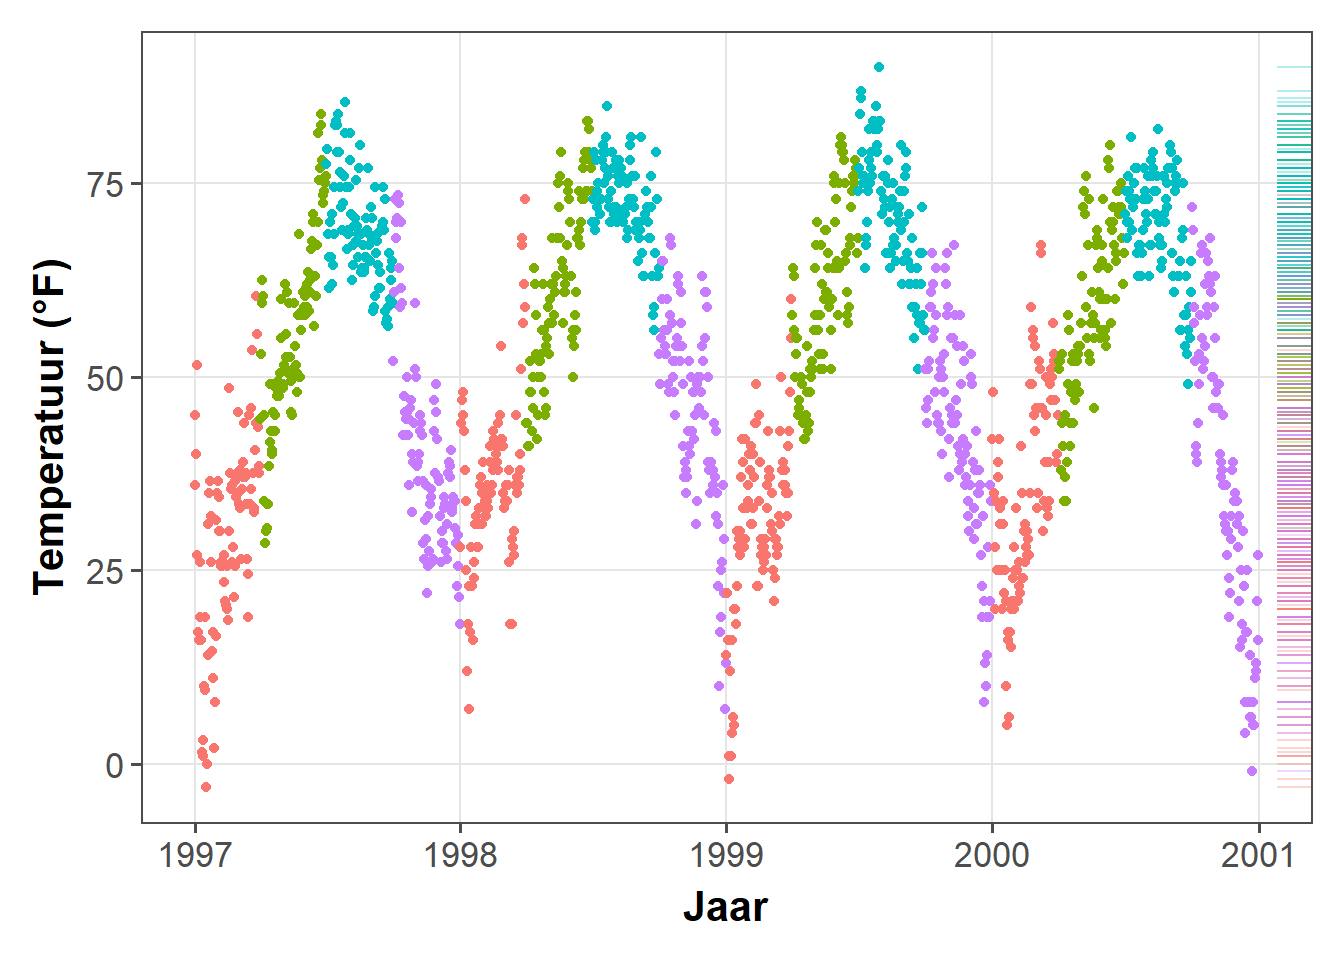
Een correlatiematrix maken
Er zijn verschillende pakketten die het mogelijk maken om correlatiematrix-plots te maken, sommige gebruiken ook de ggplot2 infrastructuur en geven dus ggplots terug. Ik ga je tonen hoe dit te doen zonder extensiepakketten.
De eerste stap is het maken van de correlatiematrix. Hier gebruiken we het corrr pakket dat goed werkt met pipes, maar er zijn ook vele andere. We gebruiken Pearson omdat alle variabelen redelijk normaal verdeeld zijn (maar je kunt Spearman overwegen als je variabelen een ander patroon volgen). Merk op dat aangezien een correlatiematrix overbodige informatie bevat, we de helft ervan op NA zetten.
library(tidyverse)
corm <-
chic %>%
select(temp, dewpoint, pm10, o3) %>%
corrr::correlate(diagonal = 1) %>%
corrr::shave(upper = FALSE)
Correlation method: 'pearson'
Missing treated using: 'pairwise.complete.obs'Now we put the resulting matrix in long format using the pivot_longer() function from the tidyr package. We also directly format the labels and place empty quotes for the upper triangle. Note that I use sprintf() to ensure that the label always display two digits.
corm <- corm %>%
pivot_longer(
cols = -term,
names_to = "colname",
values_to = "corr"
) %>%
mutate(
rowname = fct_inorder(term),
colname = fct_inorder(colname),
label = ifelse(is.na(corr), "", sprintf("%1.2f", corr))For the plot we will use geom_tile() for the heatmap and geom_text() for the labels:
ggplot(corm, aes(rowname, fct_rev(colname),
fill = corr)) +
geom_tile() +
geom_text(aes(label = label)) +
coord_fixed() +
labs(x = NULL, y = NULL)I like to have a diverging color palette—it is important that the scale is centered at zero correlation!—with white indicating missing data. Also I like to have no grid lines and padding around the heatmap as well as labels that are colored depending on the underlying fill:
ggplot(corm, aes(rowname, fct_rev(colname),
fill = corr)) +
geom_tile() +
geom_text(aes(
label = label,
color = abs(corr) < .75
)) +
coord_fixed(expand = FALSE) +
scale_color_manual(
values = c("white", "black"),
guide = "none"
) +
scale_fill_distiller(
palette = "PuOr", na.value = "white",
direction = 1, limits = c(-1, 1),
name = "Pearson\nCorrelation:"
) +
labs(x = NULL, y = NULL) +
theme(panel.border = element_rect(color = NA, fill = NA),
legend.position = c(.85, .8))Een Contourplot maken
Contourplots zijn een mooie manier om een reeks waarden weer te geven. Men kan ze gebruiken om gegevens te rangschikken en zo de dichtheid van waarnemingen te tonen:
ggplot(chic, aes(temp, o3)) +
geom_density_2d() +
labs(x = "Temperatuur (°F)", x = "Ozonniveau")Warning in grid.Call(C_textBounds, as.graphicsAnnot(x$label), x$x, x$y, : font
family not found in Windows font database
Warning in grid.Call(C_textBounds, as.graphicsAnnot(x$label), x$x, x$y, : font
family not found in Windows font database
Warning in grid.Call(C_textBounds, as.graphicsAnnot(x$label), x$x, x$y, : font
family not found in Windows font database
Warning in grid.Call(C_textBounds, as.graphicsAnnot(x$label), x$x, x$y, : font
family not found in Windows font database
Warning in grid.Call(C_textBounds, as.graphicsAnnot(x$label), x$x, x$y, : font
family not found in Windows font database
Warning in grid.Call(C_textBounds, as.graphicsAnnot(x$label), x$x, x$y, : font
family not found in Windows font database
Warning in grid.Call(C_textBounds, as.graphicsAnnot(x$label), x$x, x$y, : font
family not found in Windows font databaseWarning in grid.Call.graphics(C_text, as.graphicsAnnot(x$label), x$x, x$y, :
font family not found in Windows font database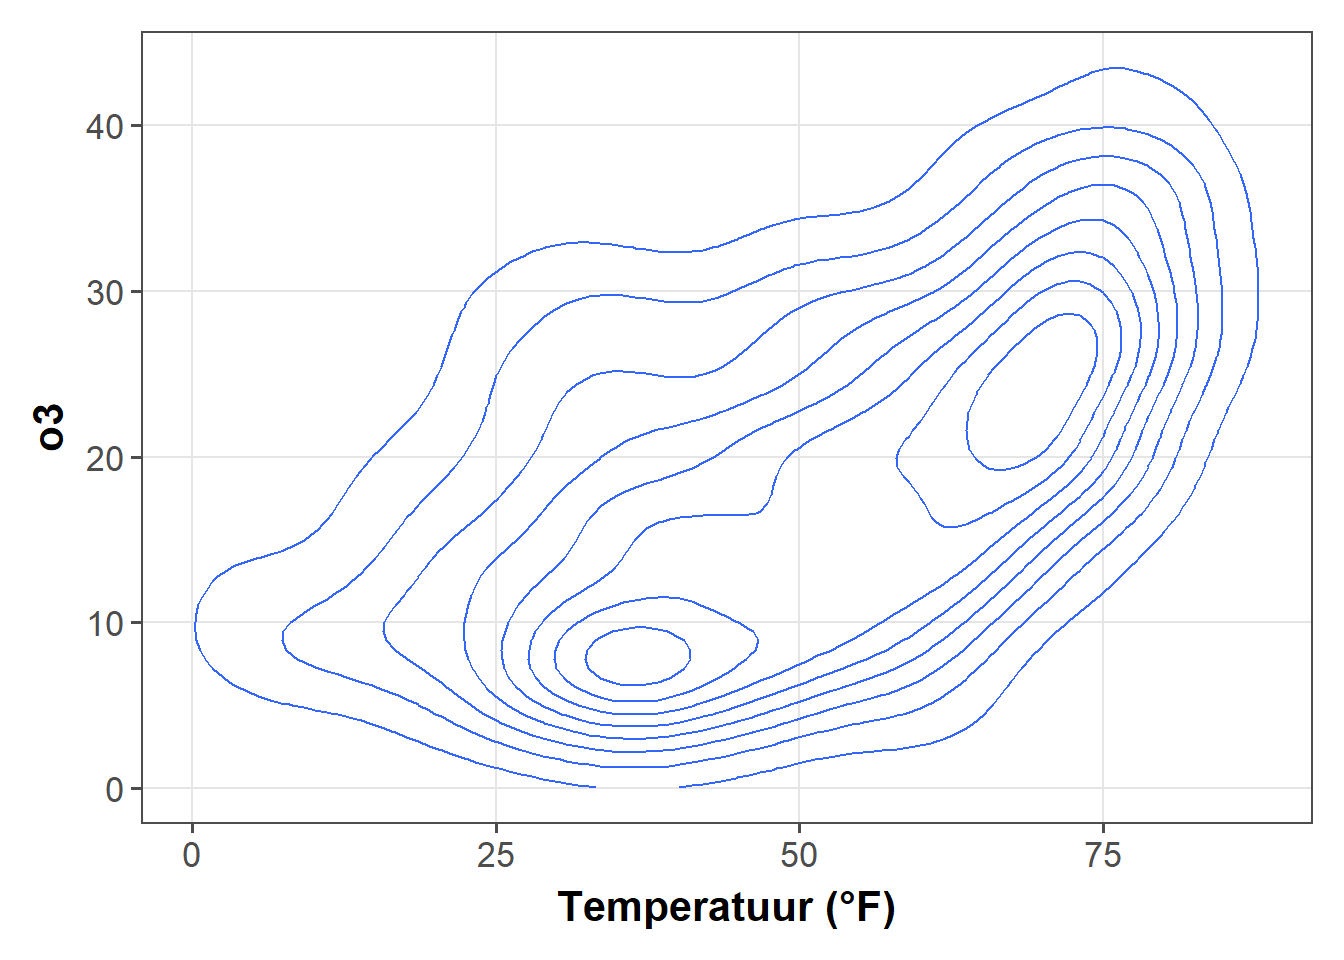
ggplot(chic, aes(temp, o3)) +
geom_density_2d_filled(show.legend = FALSE) +
coord_cartesian(expand = FALSE) +
labs(x = "Temperatuur (°F)", x = "Ozonniveau")Warning in grid.Call(C_textBounds, as.graphicsAnnot(x$label), x$x, x$y, : font
family not found in Windows font database
Warning in grid.Call(C_textBounds, as.graphicsAnnot(x$label), x$x, x$y, : font
family not found in Windows font database
Warning in grid.Call(C_textBounds, as.graphicsAnnot(x$label), x$x, x$y, : font
family not found in Windows font database
Warning in grid.Call(C_textBounds, as.graphicsAnnot(x$label), x$x, x$y, : font
family not found in Windows font database
Warning in grid.Call(C_textBounds, as.graphicsAnnot(x$label), x$x, x$y, : font
family not found in Windows font database
Warning in grid.Call(C_textBounds, as.graphicsAnnot(x$label), x$x, x$y, : font
family not found in Windows font database
Warning in grid.Call(C_textBounds, as.graphicsAnnot(x$label), x$x, x$y, : font
family not found in Windows font databaseWarning in grid.Call.graphics(C_text, as.graphicsAnnot(x$label), x$x, x$y, :
font family not found in Windows font database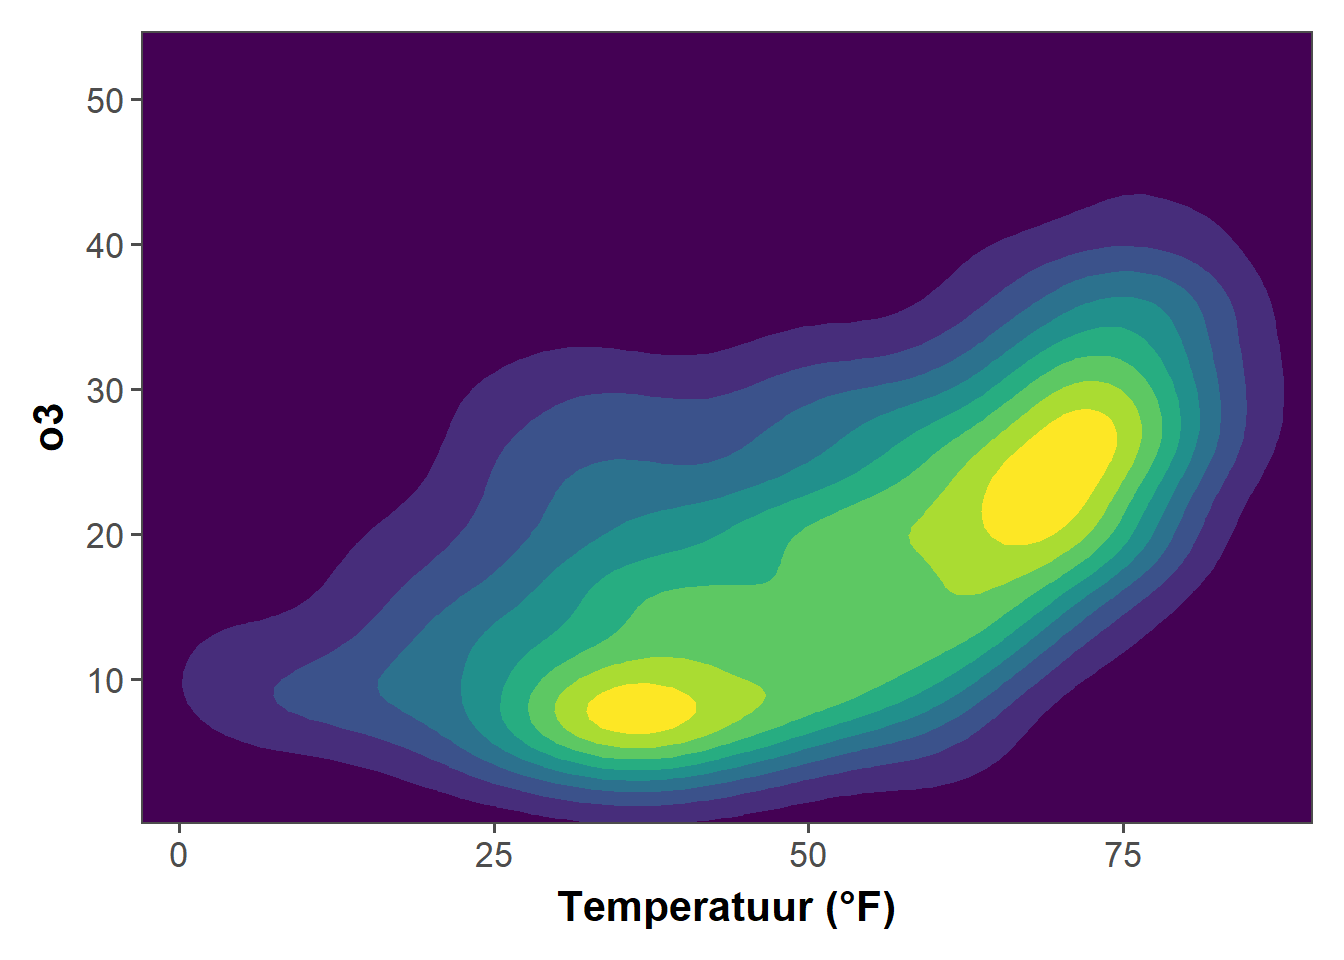
Maar nu plotten wij driedimensionale gegevens. Wij gaan de drempelwaarden voor het dauwpunt (d.w.z. de temperatuur waarbij waterdamp in de lucht condenseert tot vloeibare dauw) in relatie tot de temperatuur en de ozonconcentratie uitzetten:
## interpolate data
library(akima)
fld <- with(chic, interp(x = temp, y = o3, z = dewpoint))
## prepare data in long format
library(reshape2)
Attaching package: 'reshape2'The following object is masked from 'package:tidyr':
smithsdf <- melt(fld$z, na.rm = TRUE)
names(df) <- c("x", "y", "Dewpoint")
g <- ggplot(data = df, aes(x = x, y = y, z = Dewpoint)) +
labs(x = "Temperatuur (°F)", y = "Ozonniveau",
color = "Dauwpunt")
g + stat_contour(aes(color = ..level.., fill = Dewpoint))Warning: Ignoring unknown aesthetics: fillWarning in grid.Call(C_textBounds, as.graphicsAnnot(x$label), x$x, x$y, : font
family not found in Windows font database
Warning in grid.Call(C_textBounds, as.graphicsAnnot(x$label), x$x, x$y, : font
family not found in Windows font database
Warning in grid.Call(C_textBounds, as.graphicsAnnot(x$label), x$x, x$y, : font
family not found in Windows font database
Warning in grid.Call(C_textBounds, as.graphicsAnnot(x$label), x$x, x$y, : font
family not found in Windows font database
Warning in grid.Call(C_textBounds, as.graphicsAnnot(x$label), x$x, x$y, : font
family not found in Windows font database
Warning in grid.Call(C_textBounds, as.graphicsAnnot(x$label), x$x, x$y, : font
family not found in Windows font database
Warning in grid.Call(C_textBounds, as.graphicsAnnot(x$label), x$x, x$y, : font
family not found in Windows font database
Warning in grid.Call(C_textBounds, as.graphicsAnnot(x$label), x$x, x$y, : font
family not found in Windows font database
Warning in grid.Call(C_textBounds, as.graphicsAnnot(x$label), x$x, x$y, : font
family not found in Windows font databaseWarning in grid.Call.graphics(C_text, as.graphicsAnnot(x$label), x$x, x$y, :
font family not found in Windows font databaseWarning in grid.Call(C_textBounds, as.graphicsAnnot(x$label), x$x, x$y, : font
family not found in Windows font database
Warning in grid.Call(C_textBounds, as.graphicsAnnot(x$label), x$x, x$y, : font
family not found in Windows font database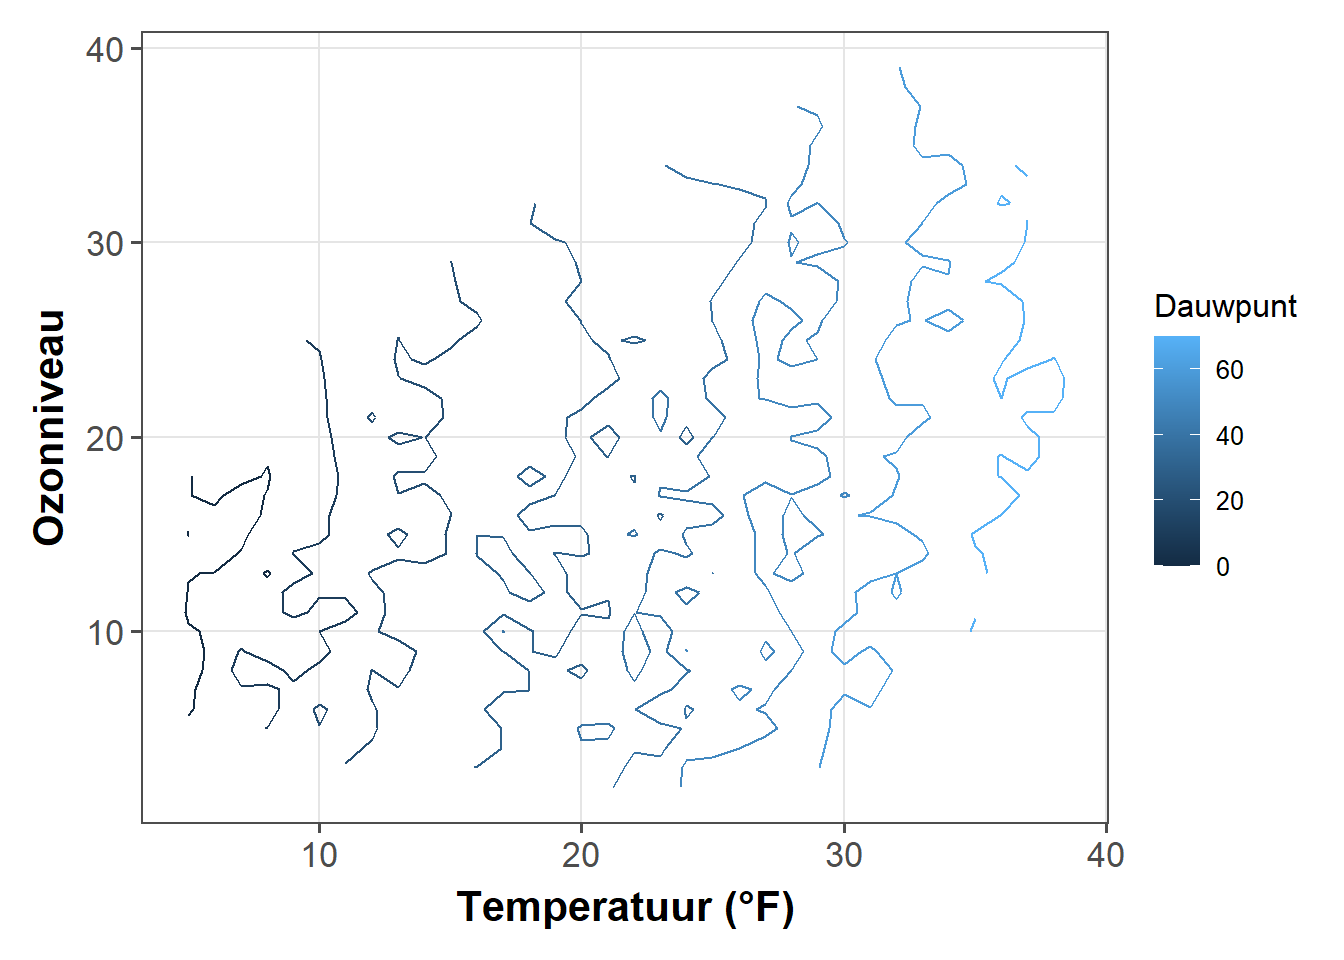
Verrassing! Zoals het is gedefinieerd, is het getrokken punt in de meeste gevallen gelijk aan de gemeten temperatuur.
De lijnen geven verschillende niveaus van dauwpunten aan, maar dit is geen mooie plot en ook moeilijk te lezen door ontbrekende randen. Laten we een tegel-plot proberen met gebruikmaking van het viridis kleurenpalet om het dauwpunt van elke combinatie van ozon-niveau en temperatuur te coderen:
g + geom_tile(aes(fill = Dewpoint)) +
scale_fill_viridis_c(option = "inferno")Warning in grid.Call(C_textBounds, as.graphicsAnnot(x$label), x$x, x$y, : font
family not found in Windows font database
Warning in grid.Call(C_textBounds, as.graphicsAnnot(x$label), x$x, x$y, : font
family not found in Windows font database
Warning in grid.Call(C_textBounds, as.graphicsAnnot(x$label), x$x, x$y, : font
family not found in Windows font database
Warning in grid.Call(C_textBounds, as.graphicsAnnot(x$label), x$x, x$y, : font
family not found in Windows font database
Warning in grid.Call(C_textBounds, as.graphicsAnnot(x$label), x$x, x$y, : font
family not found in Windows font database
Warning in grid.Call(C_textBounds, as.graphicsAnnot(x$label), x$x, x$y, : font
family not found in Windows font database
Warning in grid.Call(C_textBounds, as.graphicsAnnot(x$label), x$x, x$y, : font
family not found in Windows font database
Warning in grid.Call(C_textBounds, as.graphicsAnnot(x$label), x$x, x$y, : font
family not found in Windows font database
Warning in grid.Call(C_textBounds, as.graphicsAnnot(x$label), x$x, x$y, : font
family not found in Windows font databaseWarning in grid.Call.graphics(C_text, as.graphicsAnnot(x$label), x$x, x$y, :
font family not found in Windows font databaseWarning in grid.Call(C_textBounds, as.graphicsAnnot(x$label), x$x, x$y, : font
family not found in Windows font database
Warning in grid.Call(C_textBounds, as.graphicsAnnot(x$label), x$x, x$y, : font
family not found in Windows font database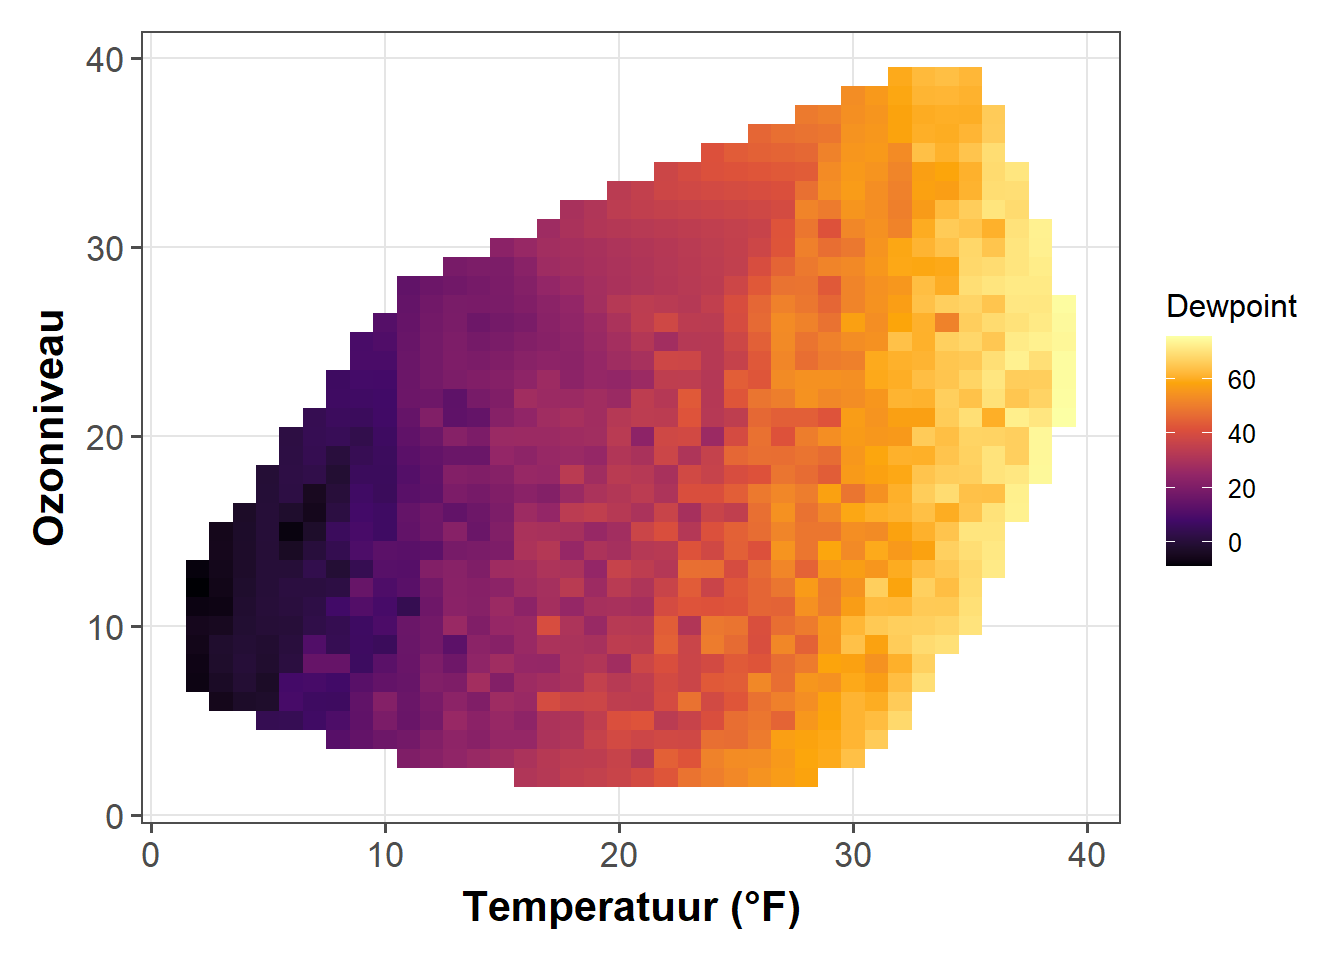
Hoe ziet het eruit als we een contourplot en een tegelplot combineren om het gebied onder de contourlijnen op te vullen?
g + geom_tile(aes(fill = Dewpoint)) +
stat_contour(color = "white", size = .7, bins = 5) +
scale_fill_viridis_c()Warning in grid.Call(C_textBounds, as.graphicsAnnot(x$label), x$x, x$y, : font
family not found in Windows font database
Warning in grid.Call(C_textBounds, as.graphicsAnnot(x$label), x$x, x$y, : font
family not found in Windows font database
Warning in grid.Call(C_textBounds, as.graphicsAnnot(x$label), x$x, x$y, : font
family not found in Windows font database
Warning in grid.Call(C_textBounds, as.graphicsAnnot(x$label), x$x, x$y, : font
family not found in Windows font database
Warning in grid.Call(C_textBounds, as.graphicsAnnot(x$label), x$x, x$y, : font
family not found in Windows font database
Warning in grid.Call(C_textBounds, as.graphicsAnnot(x$label), x$x, x$y, : font
family not found in Windows font database
Warning in grid.Call(C_textBounds, as.graphicsAnnot(x$label), x$x, x$y, : font
family not found in Windows font database
Warning in grid.Call(C_textBounds, as.graphicsAnnot(x$label), x$x, x$y, : font
family not found in Windows font database
Warning in grid.Call(C_textBounds, as.graphicsAnnot(x$label), x$x, x$y, : font
family not found in Windows font databaseWarning in grid.Call.graphics(C_text, as.graphicsAnnot(x$label), x$x, x$y, :
font family not found in Windows font databaseWarning in grid.Call(C_textBounds, as.graphicsAnnot(x$label), x$x, x$y, : font
family not found in Windows font database
Warning in grid.Call(C_textBounds, as.graphicsAnnot(x$label), x$x, x$y, : font
family not found in Windows font database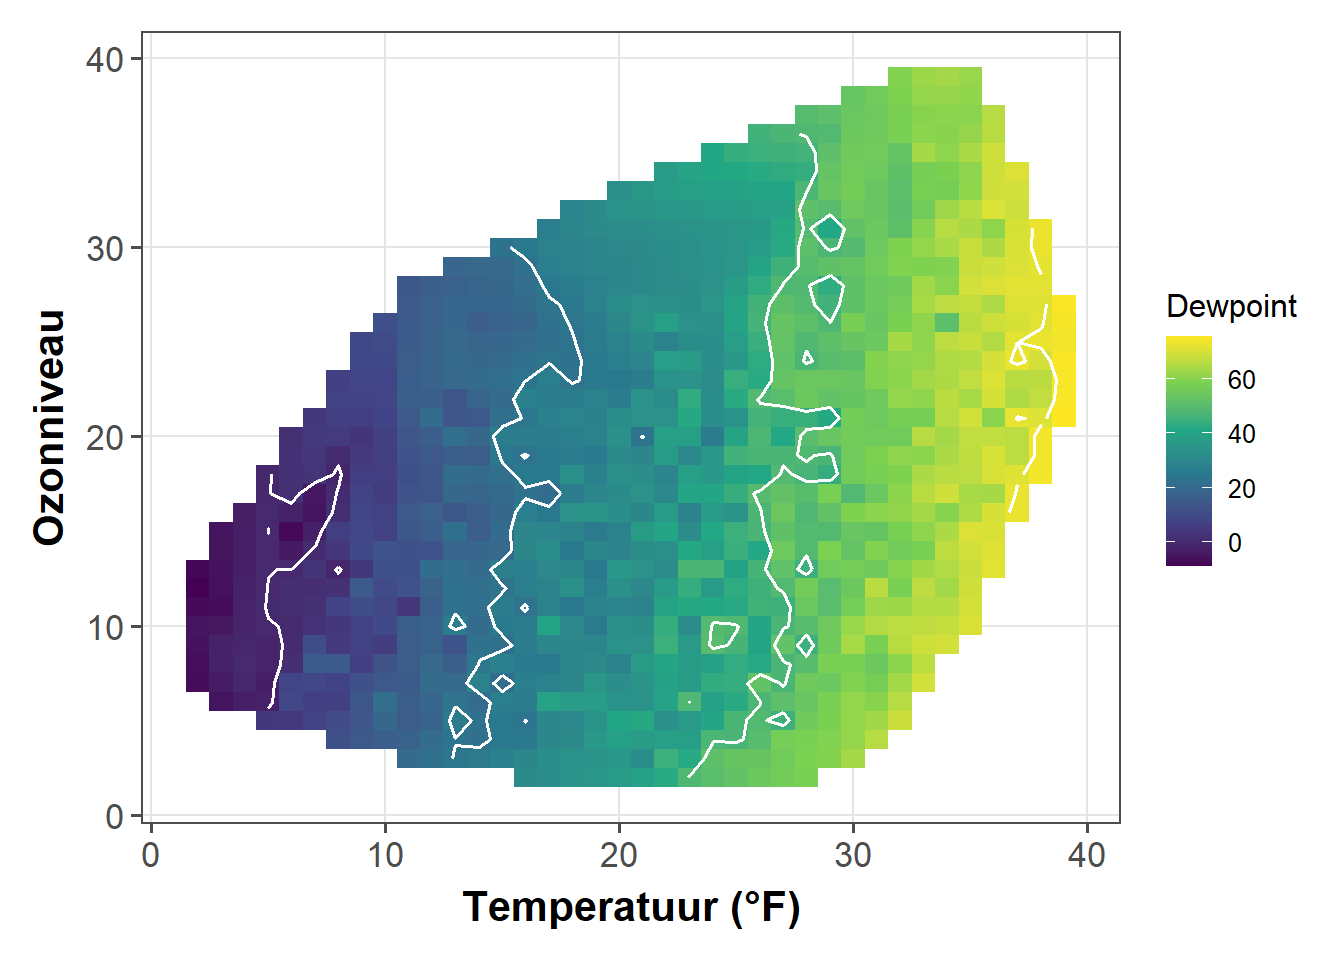
Maak een Heatmap
Net als bij onze eerste isolijnenkaarten, kunnen we eenvoudig de aantallen of dichtheden van punten weergeven, gekwantificeerd naar een hexagonaal raster via geom_hex():
ggplot(chic, aes(temp, o3)) +
geom_hex() +
scale_fill_distiller(palette = "YlOrRd", direction = 1) +
labs(x = "Temperatuur (°F)", y = "Ozonniveau")Warning in grid.Call(C_textBounds, as.graphicsAnnot(x$label), x$x, x$y, : font
family not found in Windows font database
Warning in grid.Call(C_textBounds, as.graphicsAnnot(x$label), x$x, x$y, : font
family not found in Windows font database
Warning in grid.Call(C_textBounds, as.graphicsAnnot(x$label), x$x, x$y, : font
family not found in Windows font database
Warning in grid.Call(C_textBounds, as.graphicsAnnot(x$label), x$x, x$y, : font
family not found in Windows font database
Warning in grid.Call(C_textBounds, as.graphicsAnnot(x$label), x$x, x$y, : font
family not found in Windows font database
Warning in grid.Call(C_textBounds, as.graphicsAnnot(x$label), x$x, x$y, : font
family not found in Windows font database
Warning in grid.Call(C_textBounds, as.graphicsAnnot(x$label), x$x, x$y, : font
family not found in Windows font database
Warning in grid.Call(C_textBounds, as.graphicsAnnot(x$label), x$x, x$y, : font
family not found in Windows font database
Warning in grid.Call(C_textBounds, as.graphicsAnnot(x$label), x$x, x$y, : font
family not found in Windows font databaseWarning in grid.Call.graphics(C_text, as.graphicsAnnot(x$label), x$x, x$y, :
font family not found in Windows font databaseWarning in grid.Call(C_textBounds, as.graphicsAnnot(x$label), x$x, x$y, : font
family not found in Windows font database
Warning in grid.Call(C_textBounds, as.graphicsAnnot(x$label), x$x, x$y, : font
family not found in Windows font database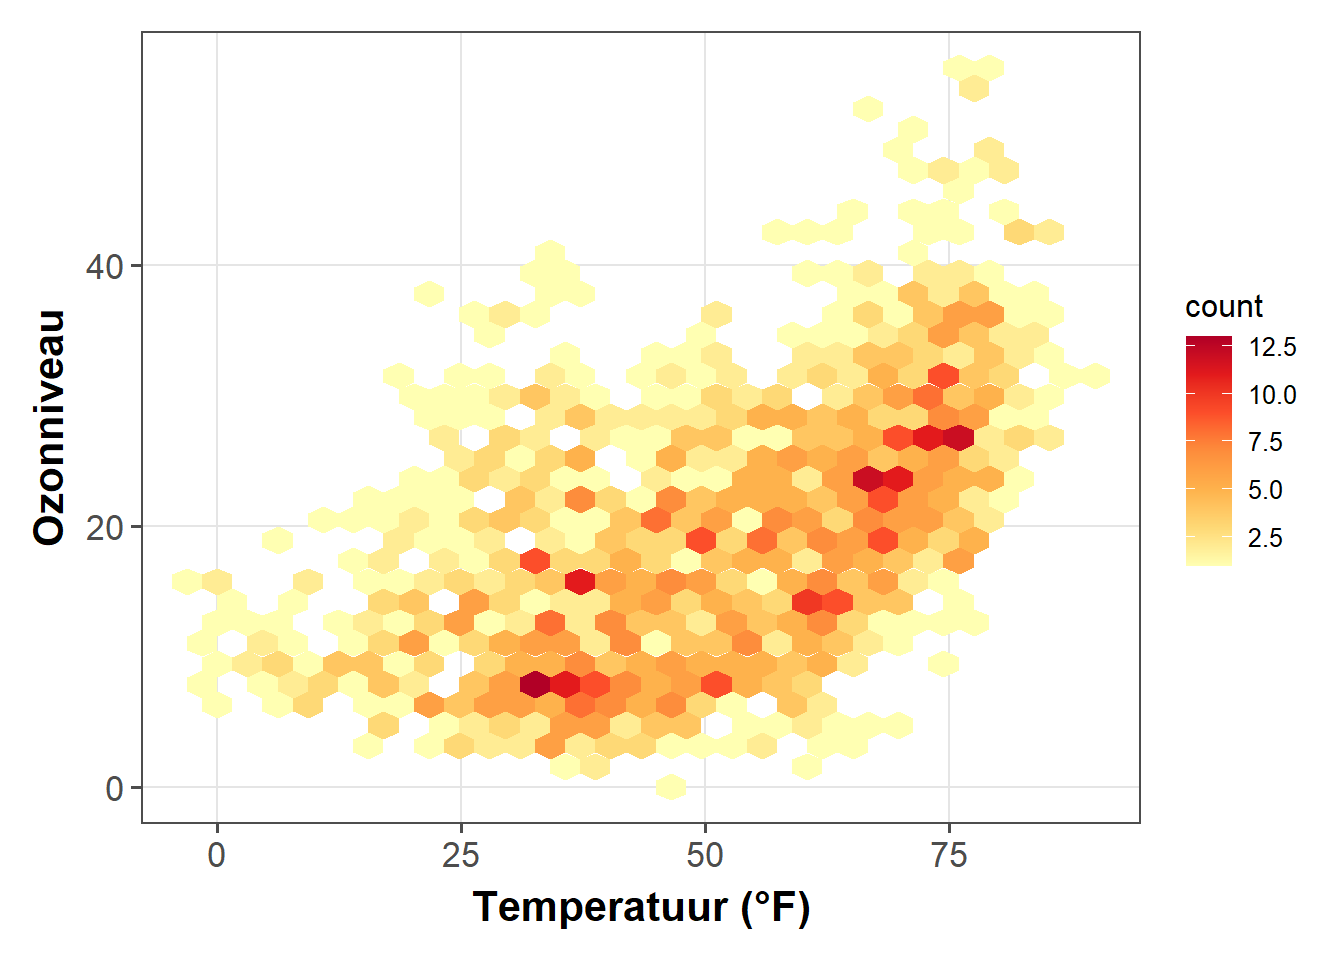
Vaak verschijnen er witte lijnen in de resulterende plot. Men kan dat verhelpen door ook kleur toe te wijzen aan ofwel ..count.. (de standaard) of ..density…..
ggplot(chic, aes(temp, o3)) +
geom_hex(aes(color = ..count..)) +
scale_fill_distiller(palette = "YlOrRd", direction = 1) +
scale_color_distiller(palette = "YlOrRd", direction = 1) +
labs(x = "Temperatuur (°F)", y = "Ozonniveau")Warning in grid.Call(C_textBounds, as.graphicsAnnot(x$label), x$x, x$y, : font
family not found in Windows font database
Warning in grid.Call(C_textBounds, as.graphicsAnnot(x$label), x$x, x$y, : font
family not found in Windows font database

Warning in grid.Call(C_textBounds, as.graphicsAnnot(x$label), x$x, x$y, : font
family not found in Windows font database

Warning in grid.Call(C_textBounds, as.graphicsAnnot(x$label), x$x, x$y, : font
family not found in Windows font database

Warning in grid.Call(C_textBounds, as.graphicsAnnot(x$label), x$x, x$y, : font
family not found in Windows font database

Warning in grid.Call(C_textBounds, as.graphicsAnnot(x$label), x$x, x$y, : font
family not found in Windows font database

Warning in grid.Call(C_textBounds, as.graphicsAnnot(x$label), x$x, x$y, : font
family not found in Windows font database

Warning in grid.Call(C_textBounds, as.graphicsAnnot(x$label), x$x, x$y, : font
family not found in Windows font database

Warning in grid.Call(C_textBounds, as.graphicsAnnot(x$label), x$x, x$y, : font
family not found in Windows font database

Warning in grid.Call(C_textBounds, as.graphicsAnnot(x$label), x$x, x$y, : font
family not found in Windows font database
Warning in grid.Call(C_textBounds, as.graphicsAnnot(x$label), x$x, x$y, : font
family not found in Windows font databaseWarning in grid.Call.graphics(C_text, as.graphicsAnnot(x$label), x$x, x$y, :
font family not found in Windows font databaseWarning in grid.Call(C_textBounds, as.graphicsAnnot(x$label), x$x, x$y, : font
family not found in Windows font database
Warning in grid.Call(C_textBounds, as.graphicsAnnot(x$label), x$x, x$y, : font
family not found in Windows font database

Warning in grid.Call(C_textBounds, as.graphicsAnnot(x$label), x$x, x$y, : font
family not found in Windows font database
Warning in grid.Call(C_textBounds, as.graphicsAnnot(x$label), x$x, x$y, : font
family not found in Windows font database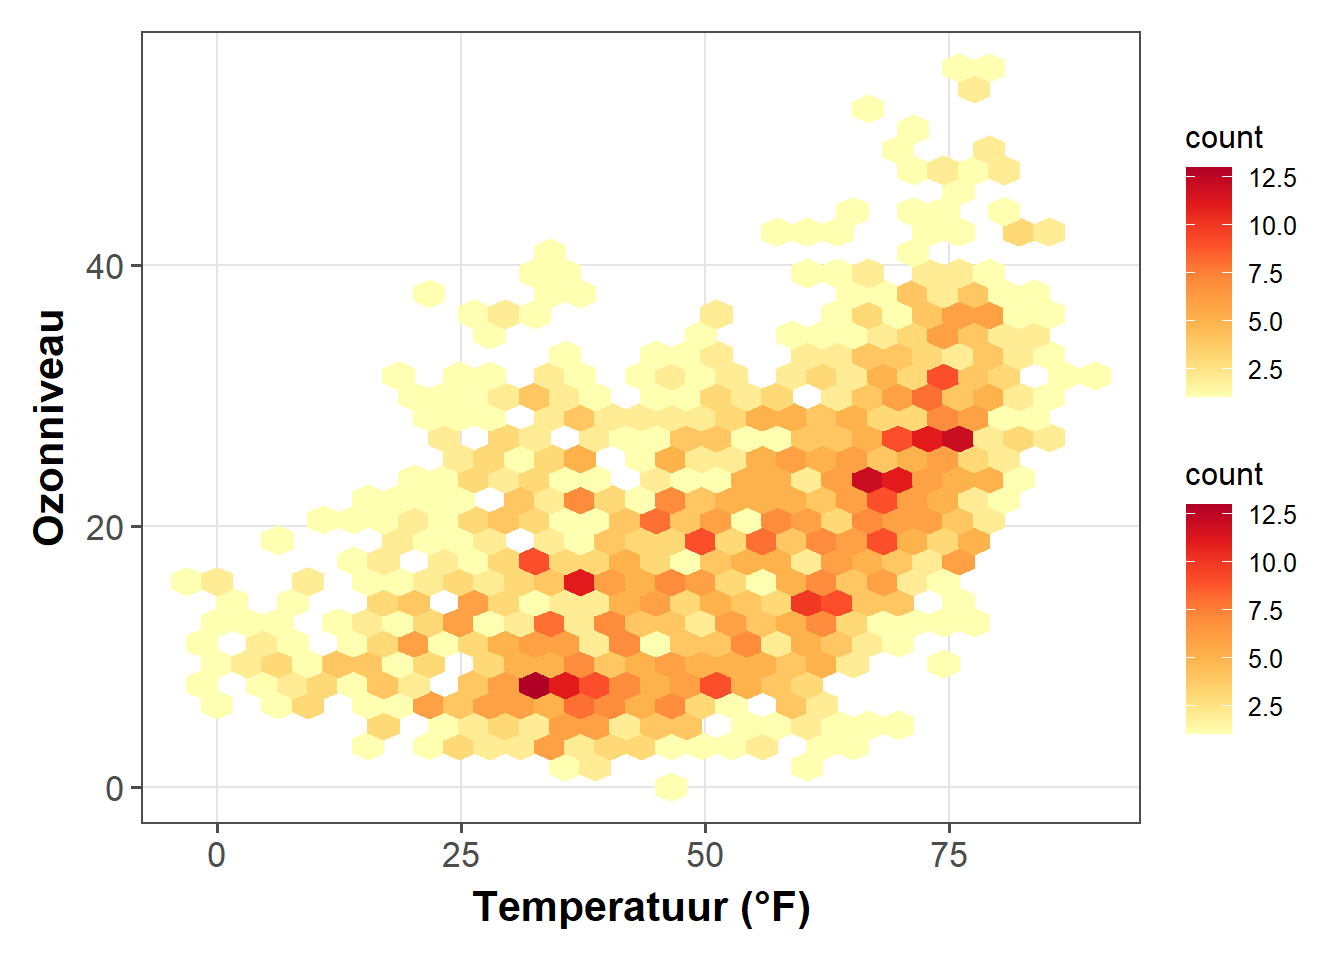
… of door voor alle zeshoekige cellen dezelfde kleur als omlijning in te stellen:
ggplot(chic, aes(temp, o3)) +
geom_hex(color = "grey") +
scale_fill_distiller(palette = "YlOrRd", direction = 1) +
labs(x = "Temperatuur (°F)", y = "Ozonniveau")Warning in grid.Call(C_textBounds, as.graphicsAnnot(x$label), x$x, x$y, : font
family not found in Windows font database
Warning in grid.Call(C_textBounds, as.graphicsAnnot(x$label), x$x, x$y, : font
family not found in Windows font database

Warning in grid.Call(C_textBounds, as.graphicsAnnot(x$label), x$x, x$y, : font
family not found in Windows font database

Warning in grid.Call(C_textBounds, as.graphicsAnnot(x$label), x$x, x$y, : font
family not found in Windows font database

Warning in grid.Call(C_textBounds, as.graphicsAnnot(x$label), x$x, x$y, : font
family not found in Windows font database

Warning in grid.Call(C_textBounds, as.graphicsAnnot(x$label), x$x, x$y, : font
family not found in Windows font database

Warning in grid.Call(C_textBounds, as.graphicsAnnot(x$label), x$x, x$y, : font
family not found in Windows font database

Warning in grid.Call(C_textBounds, as.graphicsAnnot(x$label), x$x, x$y, : font
family not found in Windows font database

Warning in grid.Call(C_textBounds, as.graphicsAnnot(x$label), x$x, x$y, : font
family not found in Windows font database
Warning in grid.Call.graphics(C_text, as.graphicsAnnot(x$label), x$x, x$y, :
font family not found in Windows font databaseWarning in grid.Call(C_textBounds, as.graphicsAnnot(x$label), x$x, x$y, : font
family not found in Windows font database
Warning in grid.Call(C_textBounds, as.graphicsAnnot(x$label), x$x, x$y, : font
family not found in Windows font database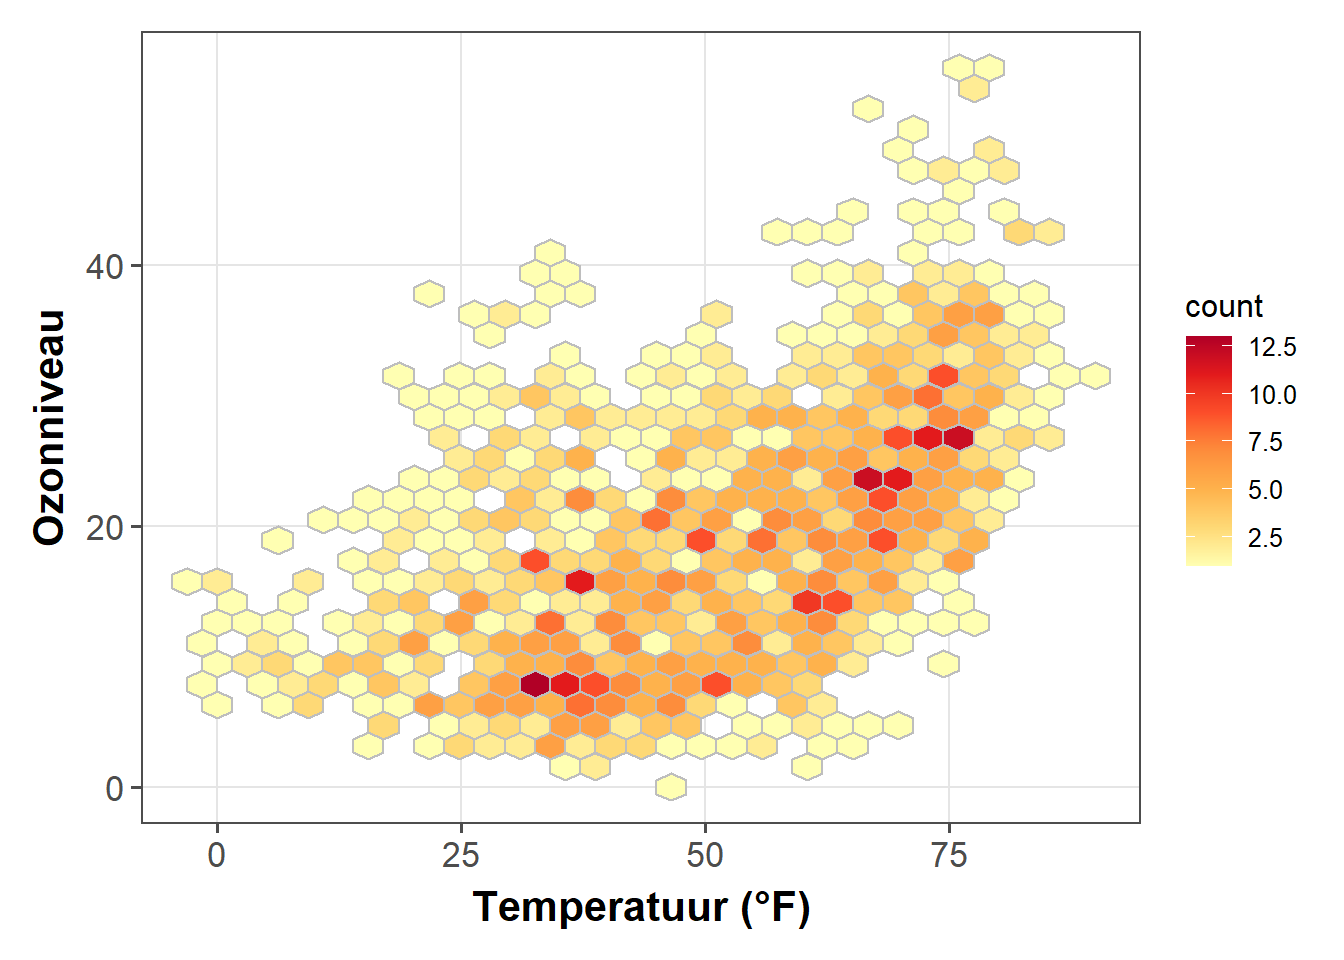
Men kan ook de standaard binning wijzigen om het aantal hexagonale cellen in of uit te breiden:
ggplot(chic, aes(temp, o3, fill = ..density..)) +
geom_hex(bins = 50, color = "grey") +
scale_fill_distiller(palette = "YlOrRd", direction = 1) +
labs(x = "Temperatuur (°F)", y = "Ozonniveau")Warning in grid.Call(C_textBounds, as.graphicsAnnot(x$label), x$x, x$y, : font
family not found in Windows font database
Warning in grid.Call(C_textBounds, as.graphicsAnnot(x$label), x$x, x$y, : font
family not found in Windows font database

Warning in grid.Call(C_textBounds, as.graphicsAnnot(x$label), x$x, x$y, : font
family not found in Windows font database
Warning in grid.Call(C_textBounds, as.graphicsAnnot(x$label), x$x, x$y, : font
family not found in Windows font database
Warning in grid.Call(C_textBounds, as.graphicsAnnot(x$label), x$x, x$y, : font
family not found in Windows font database
Warning in grid.Call(C_textBounds, as.graphicsAnnot(x$label), x$x, x$y, : font
family not found in Windows font database
Warning in grid.Call(C_textBounds, as.graphicsAnnot(x$label), x$x, x$y, : font
family not found in Windows font database
Warning in grid.Call(C_textBounds, as.graphicsAnnot(x$label), x$x, x$y, : font
family not found in Windows font database
Warning in grid.Call(C_textBounds, as.graphicsAnnot(x$label), x$x, x$y, : font
family not found in Windows font databaseWarning in grid.Call.graphics(C_text, as.graphicsAnnot(x$label), x$x, x$y, :
font family not found in Windows font databaseWarning in grid.Call(C_textBounds, as.graphicsAnnot(x$label), x$x, x$y, : font
family not found in Windows font database
Warning in grid.Call(C_textBounds, as.graphicsAnnot(x$label), x$x, x$y, : font
family not found in Windows font database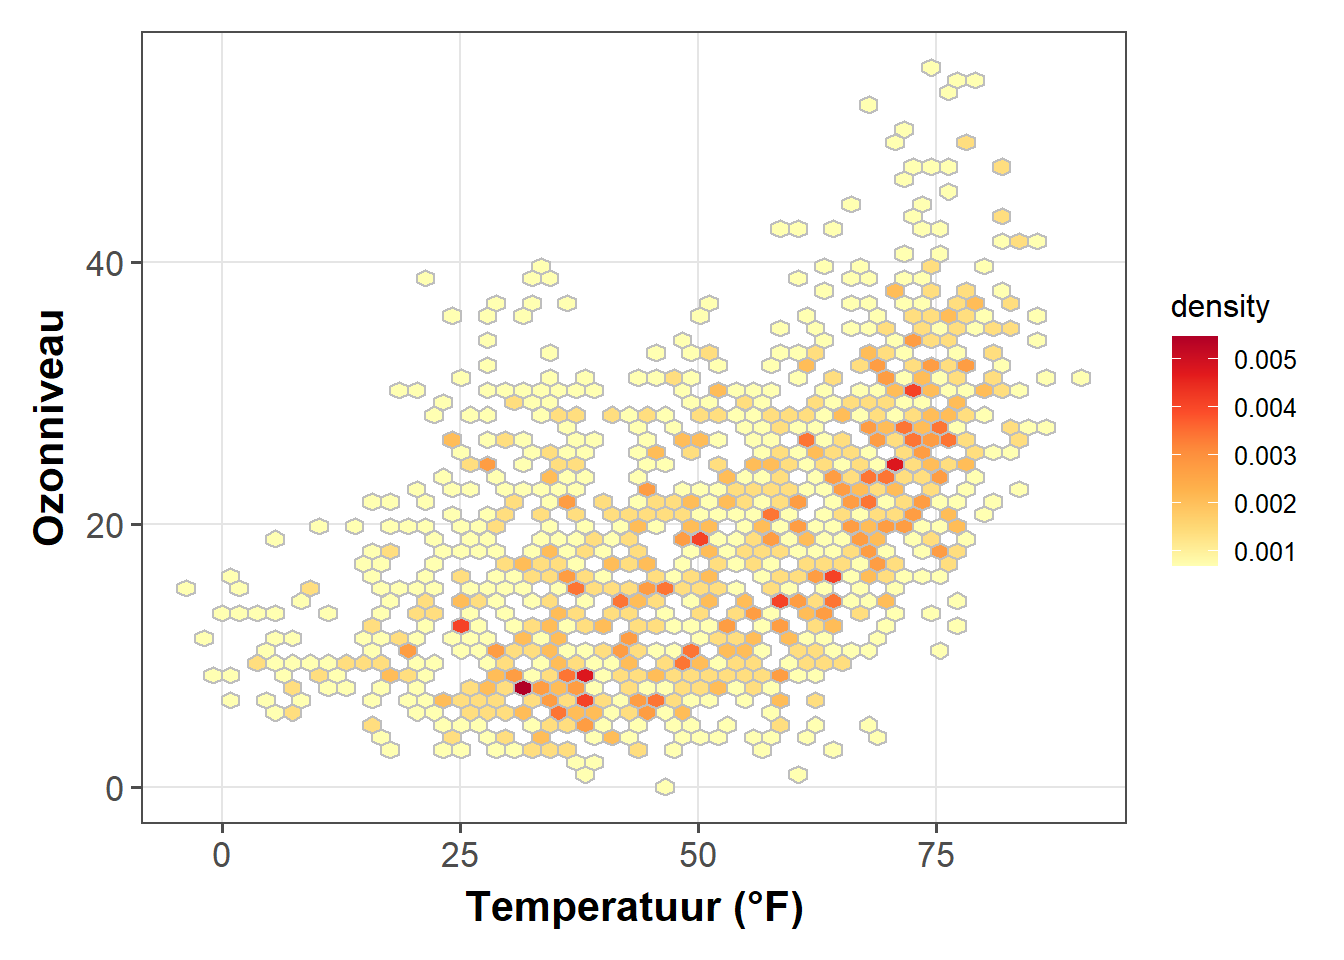
Als je een regelmatig raster wilt hebben, kun je ook geom_bin2d() gebruiken, dat de data samenvat tot rechthoekige raster cellen gebaseerd op bins:
ggplot(chic, aes(temp, o3, fill = ..density..)) +
geom_bin2d(bins = 15, color = "grey") +
scale_fill_distiller(palette = "YlOrRd", direction = 1) +
labs(x = "Temperatuur (°F)", y = "Ozonniveau")Warning in grid.Call(C_textBounds, as.graphicsAnnot(x$label), x$x, x$y, : font
family not found in Windows font database
Warning in grid.Call(C_textBounds, as.graphicsAnnot(x$label), x$x, x$y, : font
family not found in Windows font database

Warning in grid.Call(C_textBounds, as.graphicsAnnot(x$label), x$x, x$y, : font
family not found in Windows font database

Warning in grid.Call(C_textBounds, as.graphicsAnnot(x$label), x$x, x$y, : font
family not found in Windows font database

Warning in grid.Call(C_textBounds, as.graphicsAnnot(x$label), x$x, x$y, : font
family not found in Windows font database

Warning in grid.Call(C_textBounds, as.graphicsAnnot(x$label), x$x, x$y, : font
family not found in Windows font database

Warning in grid.Call(C_textBounds, as.graphicsAnnot(x$label), x$x, x$y, : font
family not found in Windows font database

Warning in grid.Call(C_textBounds, as.graphicsAnnot(x$label), x$x, x$y, : font
family not found in Windows font database

Warning in grid.Call(C_textBounds, as.graphicsAnnot(x$label), x$x, x$y, : font
family not found in Windows font database
Warning in grid.Call.graphics(C_text, as.graphicsAnnot(x$label), x$x, x$y, :
font family not found in Windows font databaseWarning in grid.Call(C_textBounds, as.graphicsAnnot(x$label), x$x, x$y, : font
family not found in Windows font database
Warning in grid.Call(C_textBounds, as.graphicsAnnot(x$label), x$x, x$y, : font
family not found in Windows font database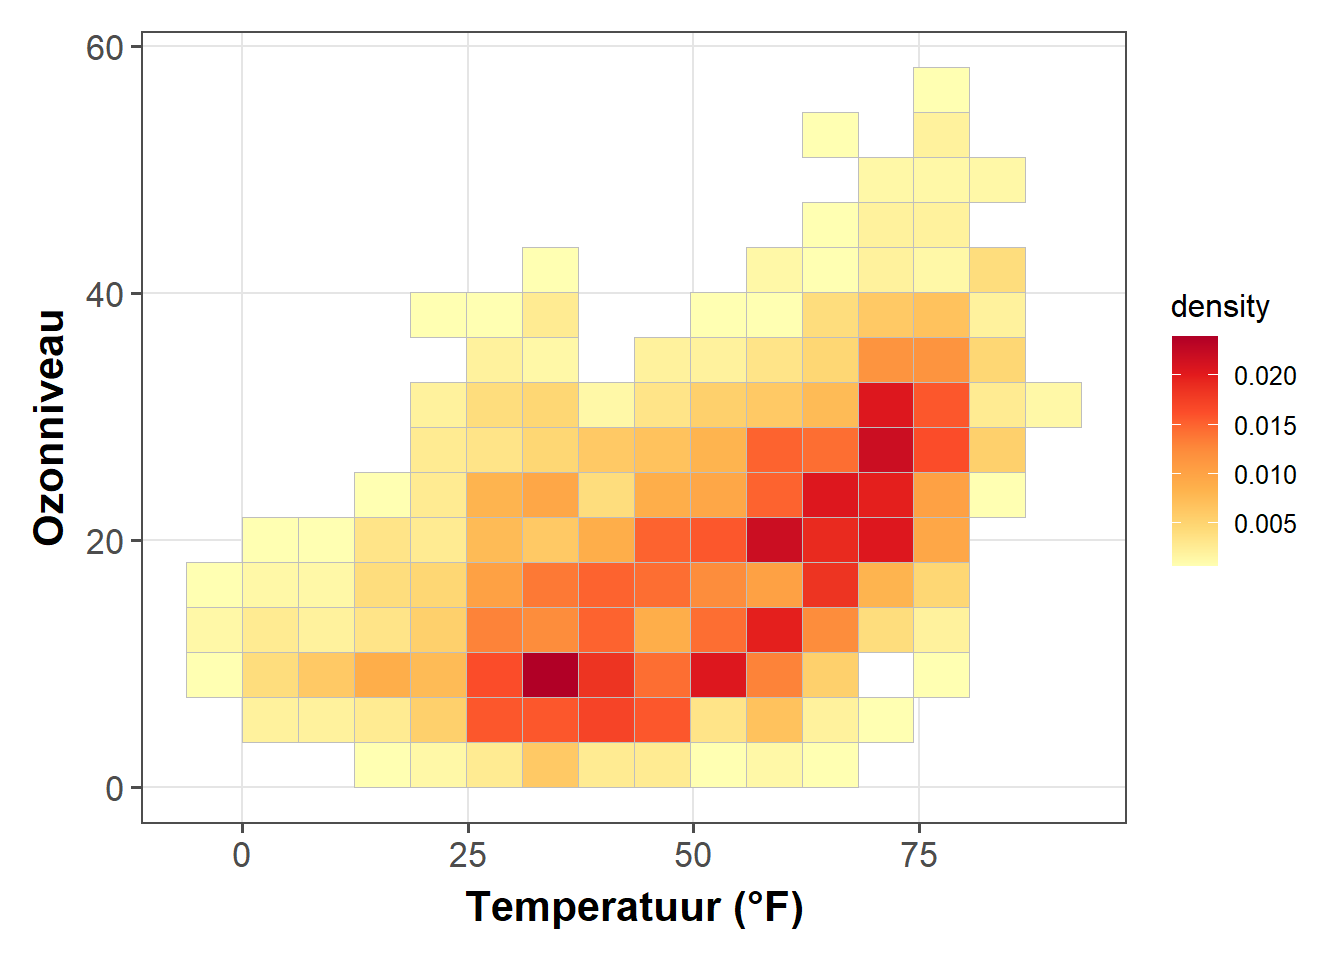
Maak een Ridge Plot
Ridge(line) plots zijn een nieuw type plots dat op dit moment erg populair is.
Hoewel je deze plots kunt maken met basic ggplot2 commands heeft de populariteit geleid tot een pakket dat het maken van deze plots makkelijker maakt: ggridges. We gaan dit pakket hier gebruiken.
library(ggridges)
ggplot(chic, aes(x = temp, y = factor(year))) +
geom_density_ridges(fill = "gray90") +
labs(x = "Temperatuur (°F)", y = "Jaar")Picking joint bandwidth of 5.23Warning in grid.Call(C_textBounds, as.graphicsAnnot(x$label), x$x, x$y, : font
family not found in Windows font database
Warning in grid.Call(C_textBounds, as.graphicsAnnot(x$label), x$x, x$y, : font
family not found in Windows font database

Warning in grid.Call(C_textBounds, as.graphicsAnnot(x$label), x$x, x$y, : font
family not found in Windows font database
Warning in grid.Call(C_textBounds, as.graphicsAnnot(x$label), x$x, x$y, : font
family not found in Windows font database

Warning in grid.Call(C_textBounds, as.graphicsAnnot(x$label), x$x, x$y, : font
family not found in Windows font database
Warning in grid.Call(C_textBounds, as.graphicsAnnot(x$label), x$x, x$y, : font
family not found in Windows font database

Warning in grid.Call(C_textBounds, as.graphicsAnnot(x$label), x$x, x$y, : font
family not found in Windows font databaseWarning in grid.Call.graphics(C_text, as.graphicsAnnot(x$label), x$x, x$y, :
font family not found in Windows font database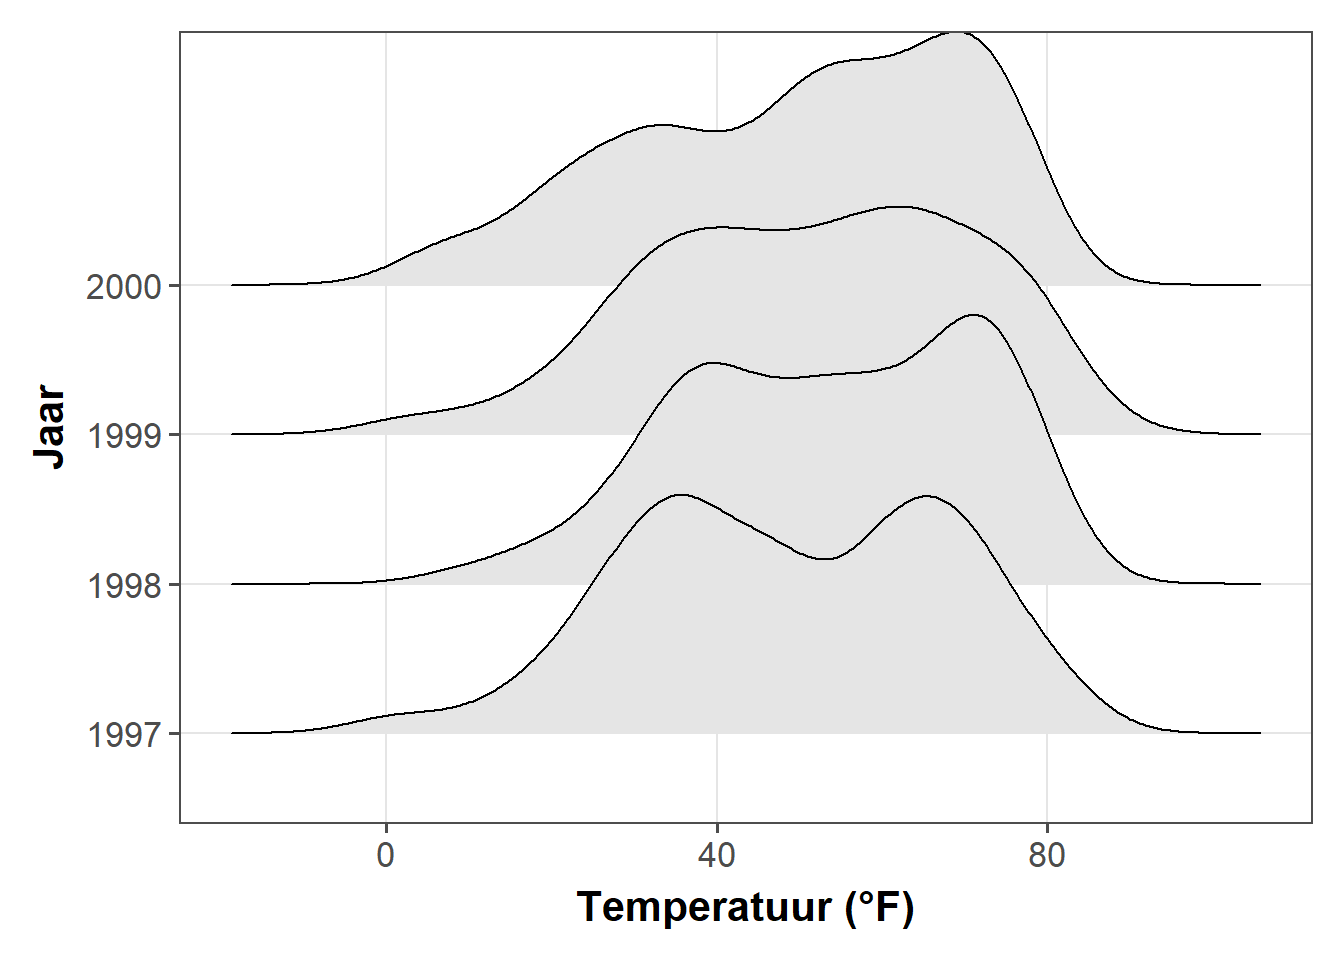
Je kunt de overlap en de trailing tails eenvoudig opgeven met de argumenten rel_min_height en scale, respectievelijk. Het pakket wordt ook geleverd met een eigen thema (maar ik bouw liever mijn eigen thema, zie hoofdstuk [“Maak en gebruik je eigen thema”]](https://www.cedricscherer.com/2019/08/05/a-ggplot2-tutorial-for-beautiful-plotting-in-r/#themes). Bovendien veranderen we de kleuren op basis van jaartal om het aantrekkelijker te maken.
ggplot(chic, aes(x = temp, y = factor(year), fill = year)) +
geom_density_ridges(alpha = .8, color = "white",
scale = 2.5, rel_min_height = .01) +
labs(x = "Temperatuur (°F)", y = "Jaar") +
guides(fill = FALSE) +
theme_ridges()Warning: `guides(<scale> = FALSE)` is deprecated. Please use `guides(<scale> =
"none")` instead.Picking joint bandwidth of 5.23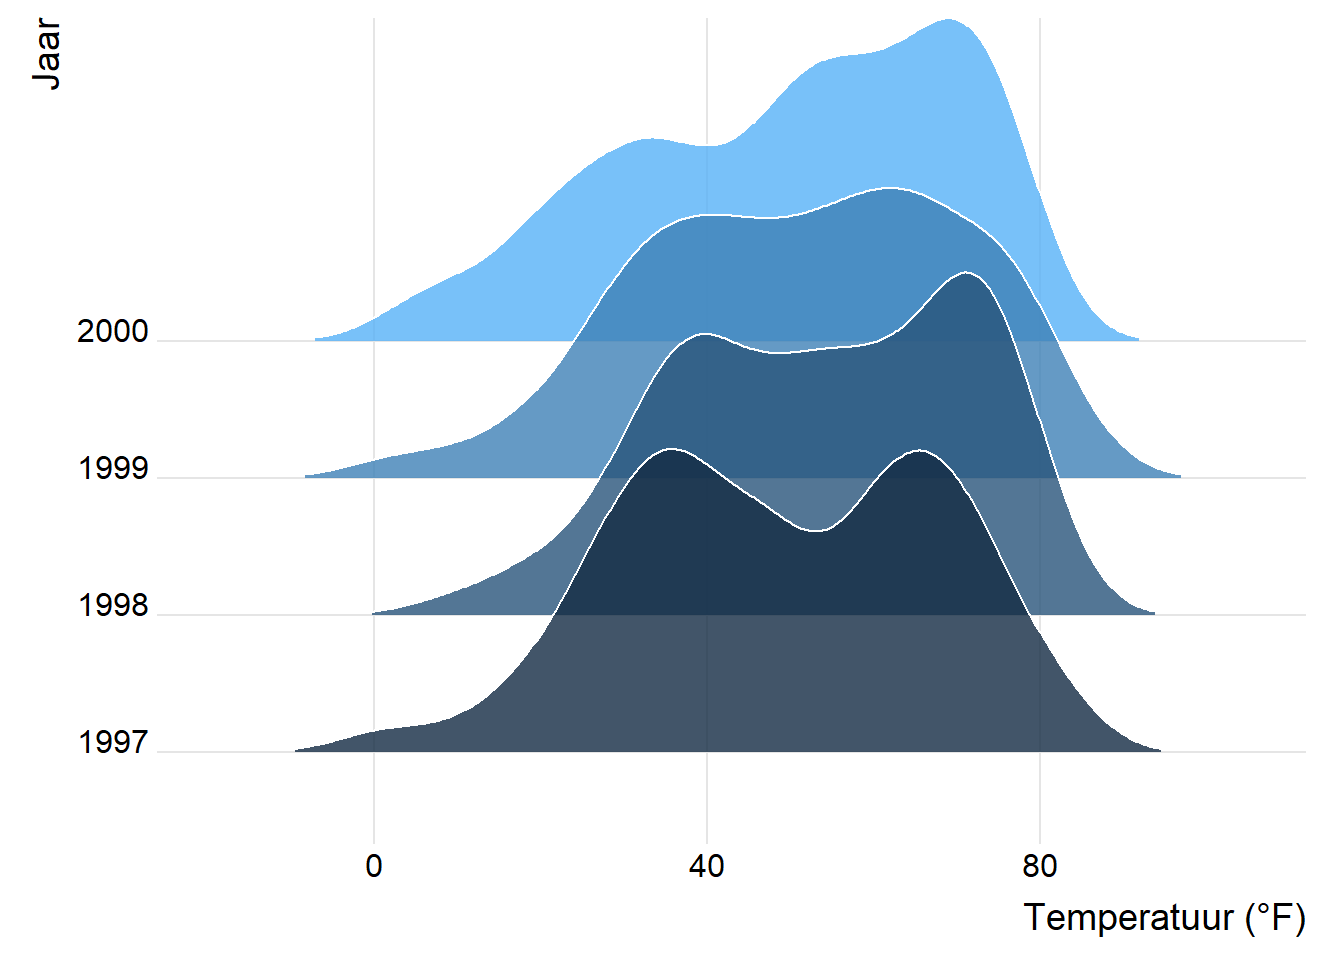
Je kan ook de overlapping wegwerken door waarden lager dan 1 te gebruiken voor het schalingsargument (maar dit is op één of andere manier in tegenspraak met het idee van ridge plots…). Hier is een voorbeeld dat bovendien gebruik maakt van het viridis kleurverloop en het in-build thema:
ggplot(chic, aes(x = temp, y = season, fill = ..x..)) +
geom_density_ridges_gradient(scale = .9, gradient_lwd = .5,
color = "black") +
scale_fill_viridis_c(option = "plasma", name = "") +
labs(x = "Temperatuur (°F)", y = "Seizoen") +
theme_ridges(font_family = "Roboto Condensed", grid = FALSE)Picking joint bandwidth of 2.99Warning in grid.Call(C_stringMetric, as.graphicsAnnot(x$label)): font family not
found in Windows font databaseWarning in grid.Call(C_textBounds, as.graphicsAnnot(x$label), x$x, x$y, : font
family not found in Windows font database
Warning in grid.Call(C_textBounds, as.graphicsAnnot(x$label), x$x, x$y, : font
family not found in Windows font database

Warning in grid.Call(C_textBounds, as.graphicsAnnot(x$label), x$x, x$y, : font
family not found in Windows font database
Warning in grid.Call(C_textBounds, as.graphicsAnnot(x$label), x$x, x$y, : font
family not found in Windows font database

Warning in grid.Call(C_textBounds, as.graphicsAnnot(x$label), x$x, x$y, : font
family not found in Windows font database
Warning in grid.Call(C_textBounds, as.graphicsAnnot(x$label), x$x, x$y, : font
family not found in Windows font database

Warning in grid.Call(C_textBounds, as.graphicsAnnot(x$label), x$x, x$y, : font
family not found in Windows font database
Warning in grid.Call(C_textBounds, as.graphicsAnnot(x$label), x$x, x$y, : font
family not found in Windows font database

Warning in grid.Call(C_textBounds, as.graphicsAnnot(x$label), x$x, x$y, : font
family not found in Windows font databaseWarning in grid.Call.graphics(C_text, as.graphicsAnnot(x$label), x$x, x$y, :
font family not found in Windows font databaseWarning in grid.Call(C_textBounds, as.graphicsAnnot(x$label), x$x, x$y, : font
family not found in Windows font database
Warning in grid.Call(C_textBounds, as.graphicsAnnot(x$label), x$x, x$y, : font
family not found in Windows font database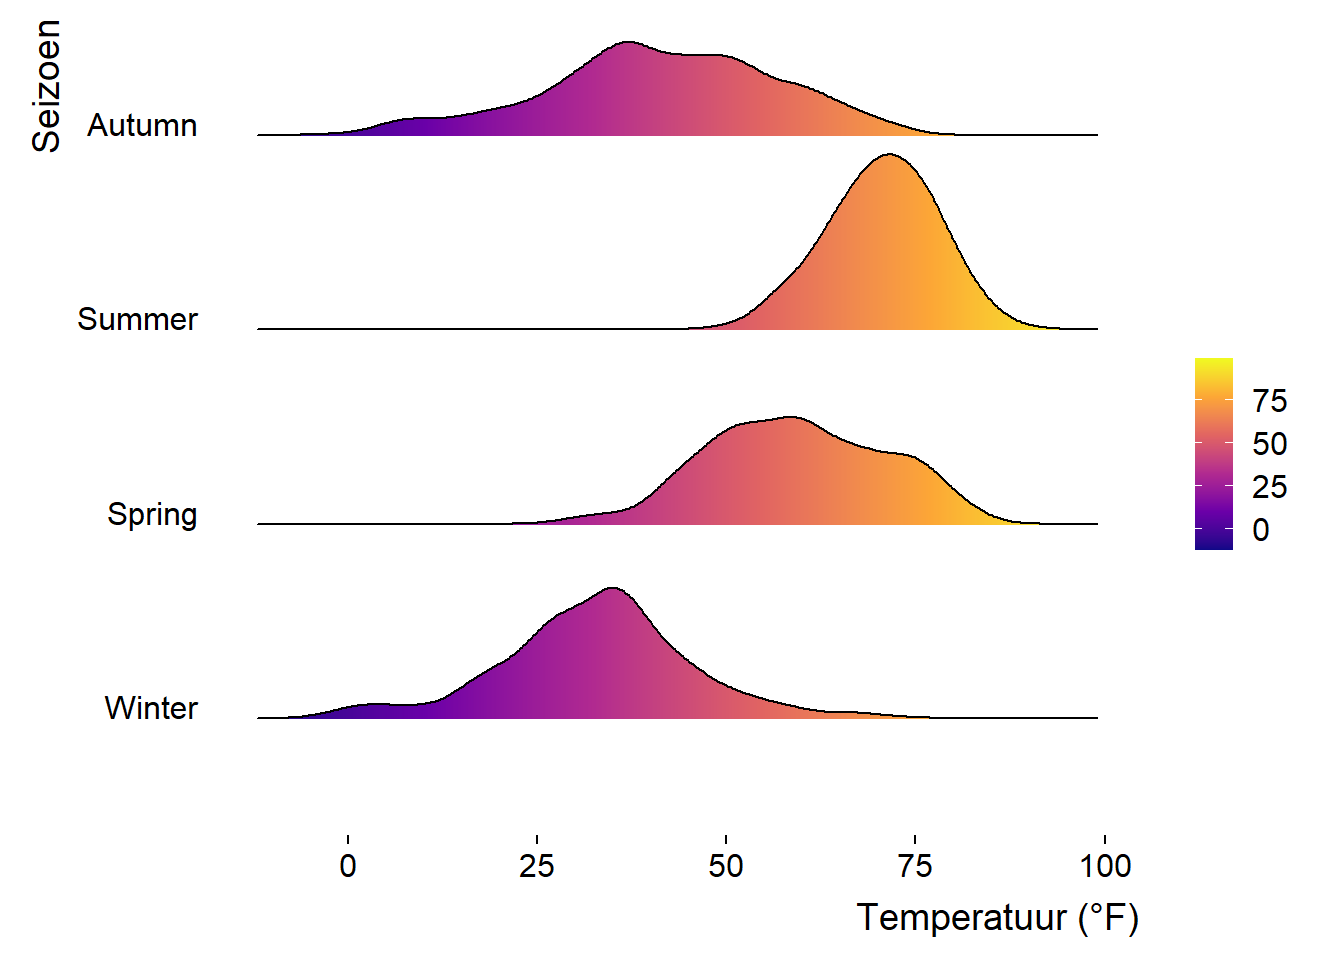
We kunnen ook verschillende groepen per richel vergelijken en ze inkleuren volgens hun groep. Dit volgt het idee van Marc Belzunces.
library(tidyverse)
## only plot extreme season using dplyr from the tidyverse
ggplot(data = filter(chic, season %in% c("Summer", "Winter")),
aes(x = temp, y = year, fill = paste(year, season))) +
geom_density_ridges(alpha = .7, rel_min_height = .01,
color = "white", from = -5, to = 95) +
scale_fill_cyclical(breaks = c("1997 Summer", "1997 Winter"),
labels = c(`1997 Summer` = "Zomer",
`1997 Winter` = "Winter"),
values = c("tomato", "dodgerblue"),
name = "Seizoen:", guide = "legend") +
theme_ridges(grid = FALSE) +
labs(x = "Temperatuur (°F)", y = "Jaar")Picking joint bandwidth of 3.17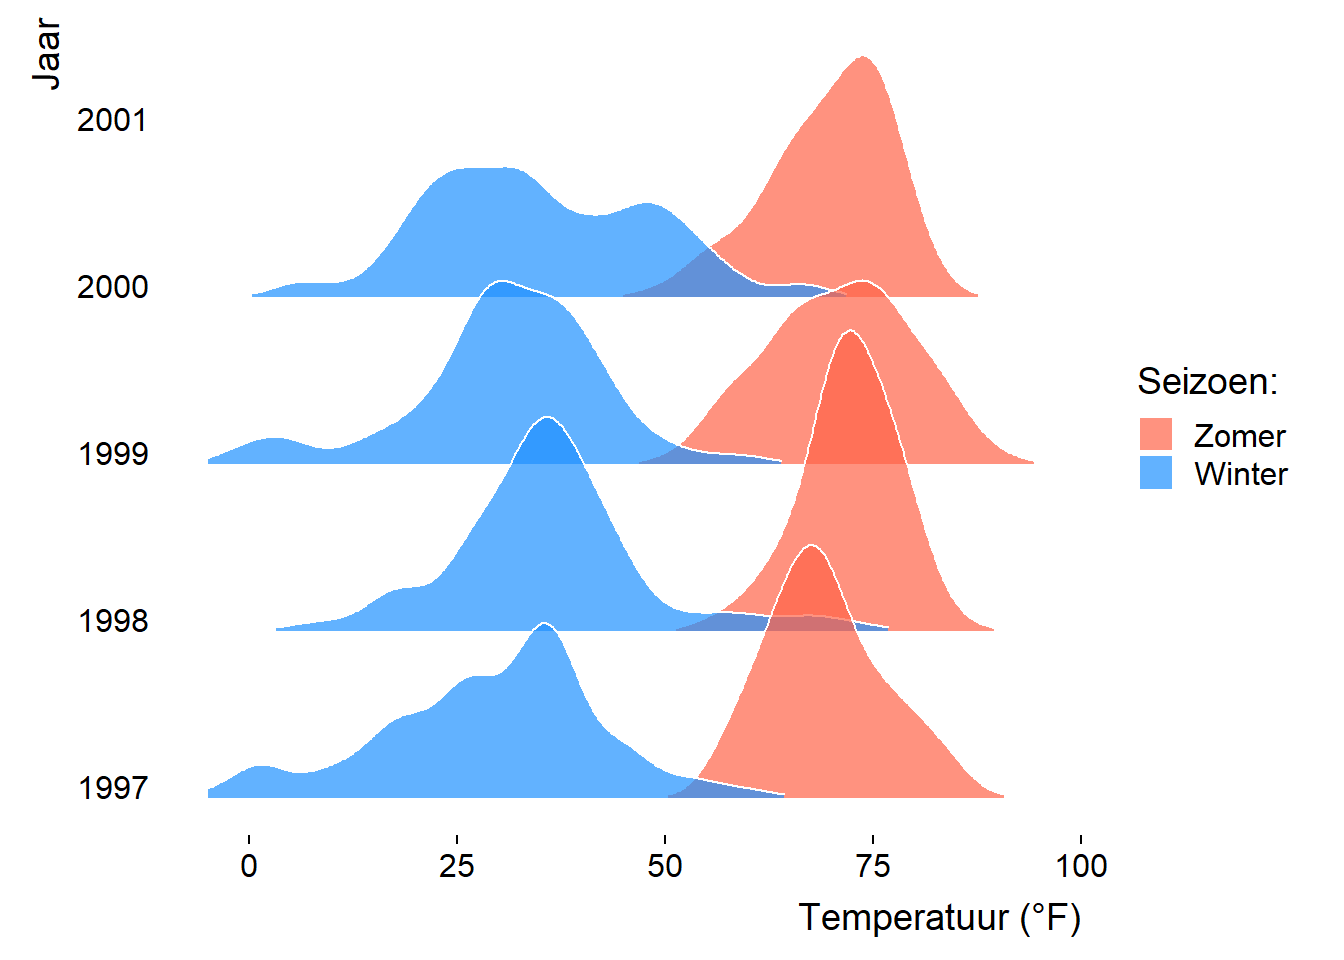
Het ggridges pakket is ook nuttig om histogrammen voor verschillende groepen te maken met stat = "binline" in het geom_density_ridges() commando:
ggplot(chic, aes(x = temp, y = factor(year), fill = year)) +
geom_density_ridges(stat = "binline", bins = 25, scale = .9,
draw_baseline = FALSE, show.legend = FALSE) +
theme_minimal() +
labs(x = "Temperatuur (°F)", y = "Seizoen")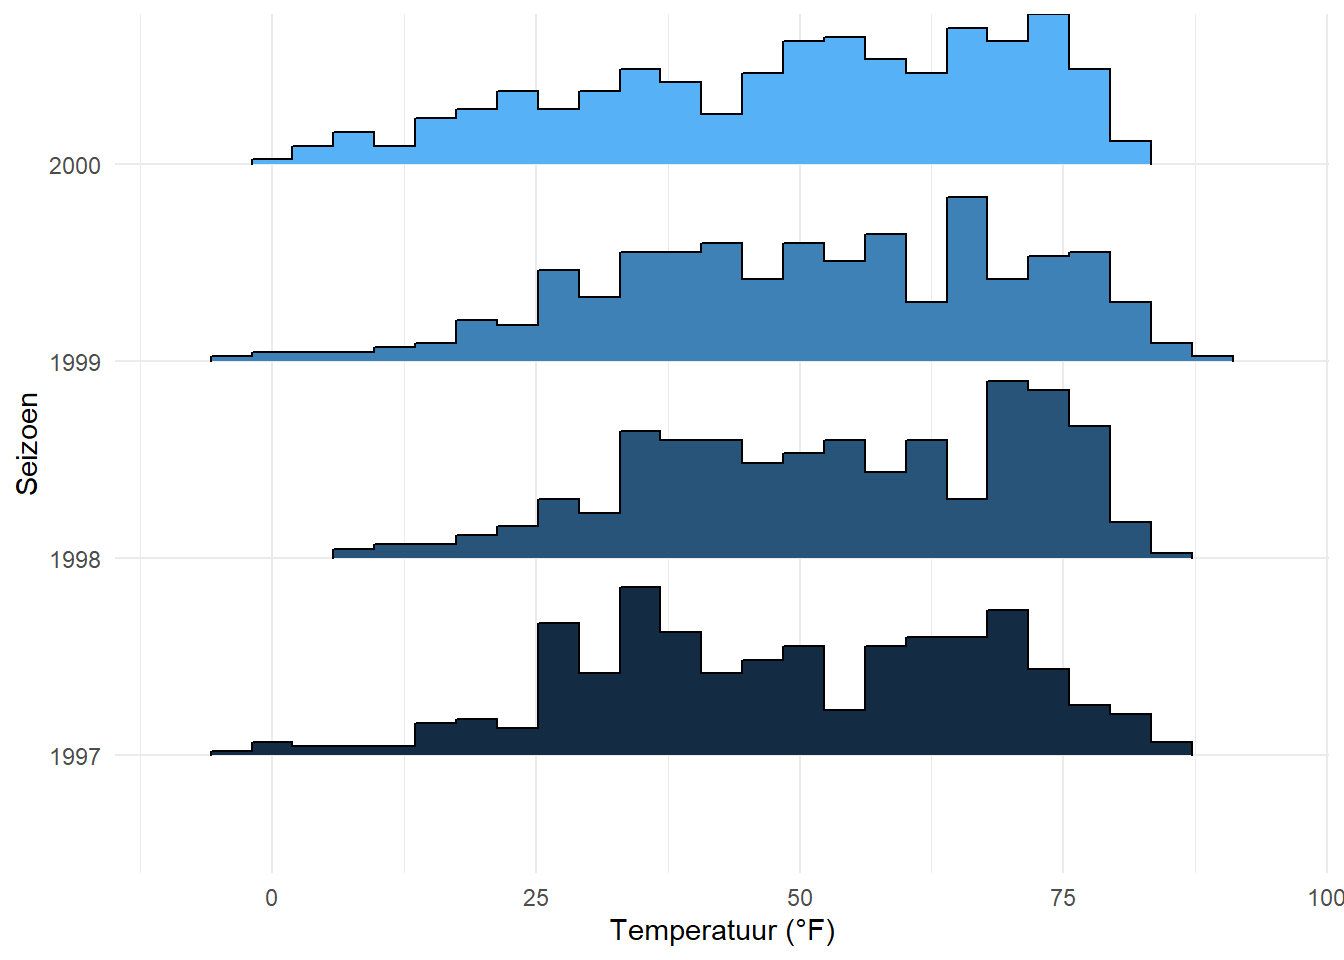
Werken met linten (AUC, CI, enz.)
Dit is geen perfecte dataset om dit te demonstreren, maar het gebruik van linten kan nuttig zijn. In dit voorbeeld zullen we een 30-daags lopend gemiddelde maken met behulp van de filter() functie, zodat ons lint niet te veel ruis bevat.
chic$o3run <- as.numeric(stats::filter(chic$o3, rep(1/30, 30), sides = 2))
ggplot(chic, aes(x = date, y = o3run)) +
geom_line(color = "chocolate", lwd = .8) +
labs(x = "Jaar", y = "Ozon")Warning: Removed 29 row(s) containing missing values (geom_path).Warning in grid.Call(C_textBounds, as.graphicsAnnot(x$label), x$x, x$y, : font
family not found in Windows font database
Warning in grid.Call(C_textBounds, as.graphicsAnnot(x$label), x$x, x$y, : font
family not found in Windows font database

Warning in grid.Call(C_textBounds, as.graphicsAnnot(x$label), x$x, x$y, : font
family not found in Windows font database
Warning in grid.Call(C_textBounds, as.graphicsAnnot(x$label), x$x, x$y, : font
family not found in Windows font database

Warning in grid.Call(C_textBounds, as.graphicsAnnot(x$label), x$x, x$y, : font
family not found in Windows font database
Warning in grid.Call(C_textBounds, as.graphicsAnnot(x$label), x$x, x$y, : font
family not found in Windows font database

Warning in grid.Call(C_textBounds, as.graphicsAnnot(x$label), x$x, x$y, : font
family not found in Windows font databaseWarning in grid.Call.graphics(C_text, as.graphicsAnnot(x$label), x$x, x$y, :
font family not found in Windows font database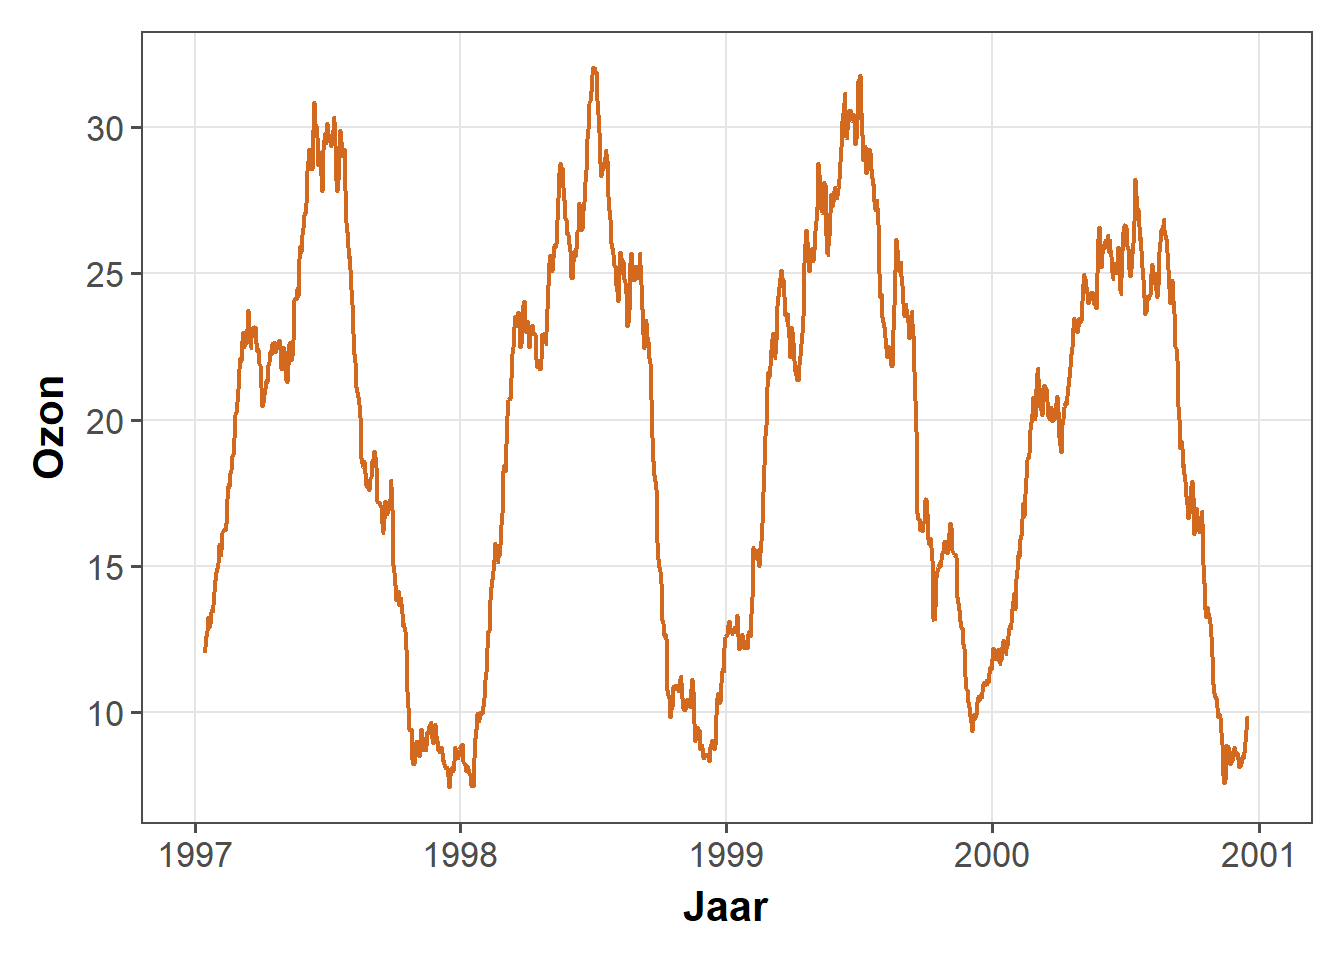
Hoe ziet het eruit als we het gebied onder de kromme invullen met de geom_ribbon() functie?
ggplot(chic, aes(x = date, y = o3run)) +
geom_ribbon(aes(ymin = 0, ymax = o3run),
fill = "orange", alpha = .4) +
geom_line(color = "chocolate", lwd = .8) +
labs(x = "Jaar", y = "Ozon")Warning: Removed 29 row(s) containing missing values (geom_path).Warning in grid.Call(C_textBounds, as.graphicsAnnot(x$label), x$x, x$y, : font
family not found in Windows font database
Warning in grid.Call(C_textBounds, as.graphicsAnnot(x$label), x$x, x$y, : font
family not found in Windows font database
Warning in grid.Call(C_textBounds, as.graphicsAnnot(x$label), x$x, x$y, : font
family not found in Windows font database
Warning in grid.Call(C_textBounds, as.graphicsAnnot(x$label), x$x, x$y, : font
family not found in Windows font database
Warning in grid.Call(C_textBounds, as.graphicsAnnot(x$label), x$x, x$y, : font
family not found in Windows font database
Warning in grid.Call(C_textBounds, as.graphicsAnnot(x$label), x$x, x$y, : font
family not found in Windows font database
Warning in grid.Call(C_textBounds, as.graphicsAnnot(x$label), x$x, x$y, : font
family not found in Windows font databaseWarning in grid.Call.graphics(C_text, as.graphicsAnnot(x$label), x$x, x$y, :
font family not found in Windows font database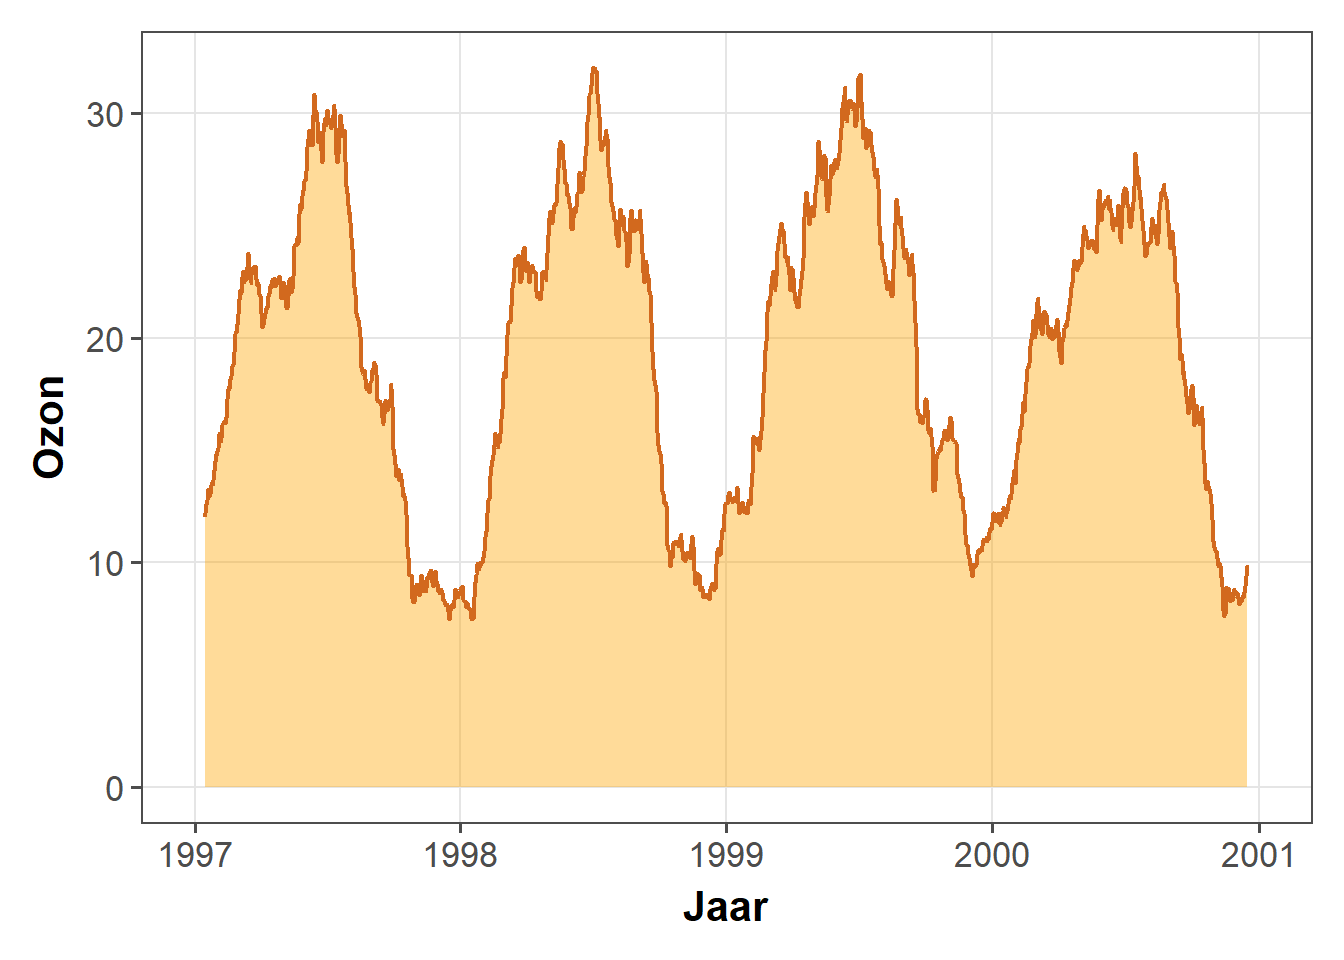
Leuk om de area under the curve (AUC) aan te geven, maar dit is niet de conventionele manier om geom_ribbon() te gebruiken.
En eigenlijk een mooiere manier om hetzelfde te bereiken is
geom_area().
In plaats daarvan tekenen we een lint dat ons één standaardafwijking boven en onder onze gegevens geeft:
chic$mino3 <- chic$o3run - sd(chic$o3run, na.rm = TRUE)
chic$maxo3 <- chic$o3run + sd(chic$o3run, na.rm = TRUE)
ggplot(chic, aes(x = date, y = o3run)) +
geom_ribbon(aes(ymin = mino3, ymax = maxo3), alpha = .5,
fill = "darkseagreen3", color = "transparent") +
geom_line(color = "aquamarine4", lwd = .7) +
labs(x = "Jaar", y = "Ozon")Warning: Removed 29 row(s) containing missing values (geom_path).Warning in grid.Call(C_textBounds, as.graphicsAnnot(x$label), x$x, x$y, : font
family not found in Windows font database
Warning in grid.Call(C_textBounds, as.graphicsAnnot(x$label), x$x, x$y, : font
family not found in Windows font database
Warning in grid.Call(C_textBounds, as.graphicsAnnot(x$label), x$x, x$y, : font
family not found in Windows font database
Warning in grid.Call(C_textBounds, as.graphicsAnnot(x$label), x$x, x$y, : font
family not found in Windows font database
Warning in grid.Call(C_textBounds, as.graphicsAnnot(x$label), x$x, x$y, : font
family not found in Windows font database
Warning in grid.Call(C_textBounds, as.graphicsAnnot(x$label), x$x, x$y, : font
family not found in Windows font database
Warning in grid.Call(C_textBounds, as.graphicsAnnot(x$label), x$x, x$y, : font
family not found in Windows font databaseWarning in grid.Call.graphics(C_text, as.graphicsAnnot(x$label), x$x, x$y, :
font family not found in Windows font database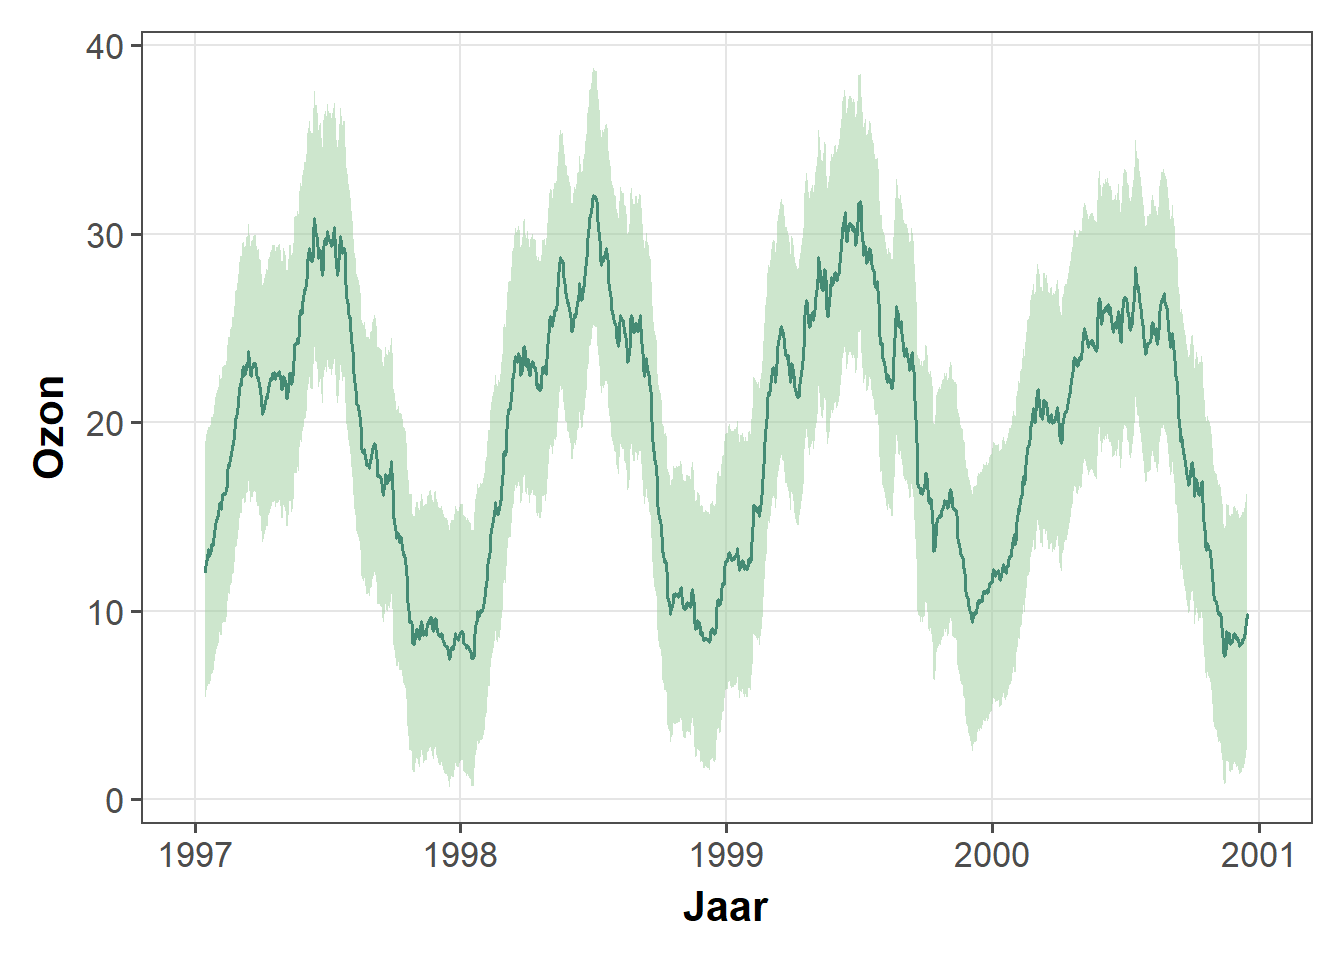
Werken met afvlakkingen
Het is verbazend eenvoudig om afvlakkingen toe te voegen aan uw gegevens met ggplot2.
Standaard: Een LOESS of GAM afvlakking toevoegen
Je kunt eenvoudig stat_smooth() gebruiken - zelfs een formule is niet nodig. Dit voegt een LOESS (locally weighted scatter plot smoothing, method = "loess") toe als je minder dan 1000 punten hebt of een GAM (generalized additive model, method = "gam") anders. Omdat we meer dan 1000 punten hebben, is de afvlakking gebaseerd op een GAM:
ggplot(chic, aes(x = date, y = temp)) +
labs(x = "Jaar", y = "Temperatuur (°F)") +
stat_smooth() +
geom_point(color = "gray40", alpha = .5)`geom_smooth()` using method = 'gam' and formula 'y ~ s(x, bs = "cs")'Warning in grid.Call(C_textBounds, as.graphicsAnnot(x$label), x$x, x$y, : font
family not found in Windows font database
Warning in grid.Call(C_textBounds, as.graphicsAnnot(x$label), x$x, x$y, : font
family not found in Windows font database
Warning in grid.Call(C_textBounds, as.graphicsAnnot(x$label), x$x, x$y, : font
family not found in Windows font database
Warning in grid.Call(C_textBounds, as.graphicsAnnot(x$label), x$x, x$y, : font
family not found in Windows font database
Warning in grid.Call(C_textBounds, as.graphicsAnnot(x$label), x$x, x$y, : font
family not found in Windows font database
Warning in grid.Call(C_textBounds, as.graphicsAnnot(x$label), x$x, x$y, : font
family not found in Windows font database
Warning in grid.Call(C_textBounds, as.graphicsAnnot(x$label), x$x, x$y, : font
family not found in Windows font databaseWarning in grid.Call.graphics(C_text, as.graphicsAnnot(x$label), x$x, x$y, :
font family not found in Windows font database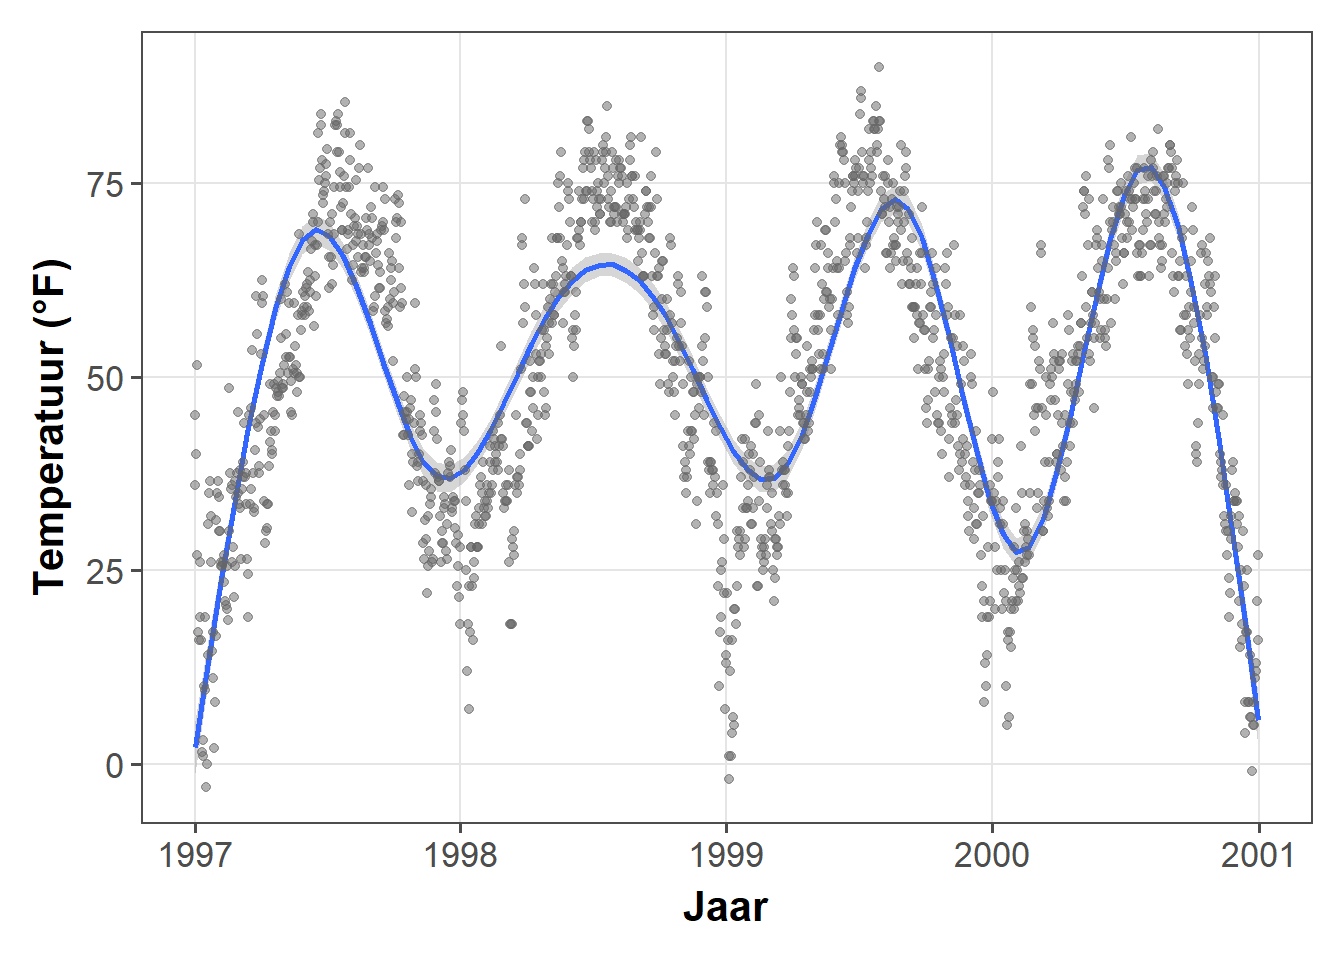
In de meeste gevallen wil men dat de punten boven op het lint liggen, dus zorg ervoor dat u de afvlakking altijd oproept voordat u de punten toevoegt.
Een lineaire afvlakking toevoegen
De standaardinstelling is een LOESS of GAM afvlakking, maar het is ook eenvoudig om een standaard lineaire fit toe te voegen:
# Anders dan bij Cédric zat Deaths als y variabele er niet in, vandaar dewpoint
ggplot(chic, aes(x = temp, y = dewpoint)) +
labs(x = "Temperatuur (°F)", y = "Dauw") +
stat_smooth(method = "lm", se = FALSE,
color = "firebrick", size = 1.3) +
geom_point(color = "gray40", alpha = .5)`geom_smooth()` using formula 'y ~ x'Warning in grid.Call(C_textBounds, as.graphicsAnnot(x$label), x$x, x$y, : font
family not found in Windows font database
Warning in grid.Call(C_textBounds, as.graphicsAnnot(x$label), x$x, x$y, : font
family not found in Windows font database
Warning in grid.Call(C_textBounds, as.graphicsAnnot(x$label), x$x, x$y, : font
family not found in Windows font database
Warning in grid.Call(C_textBounds, as.graphicsAnnot(x$label), x$x, x$y, : font
family not found in Windows font database
Warning in grid.Call(C_textBounds, as.graphicsAnnot(x$label), x$x, x$y, : font
family not found in Windows font database
Warning in grid.Call(C_textBounds, as.graphicsAnnot(x$label), x$x, x$y, : font
family not found in Windows font database
Warning in grid.Call(C_textBounds, as.graphicsAnnot(x$label), x$x, x$y, : font
family not found in Windows font databaseWarning in grid.Call.graphics(C_text, as.graphicsAnnot(x$label), x$x, x$y, :
font family not found in Windows font database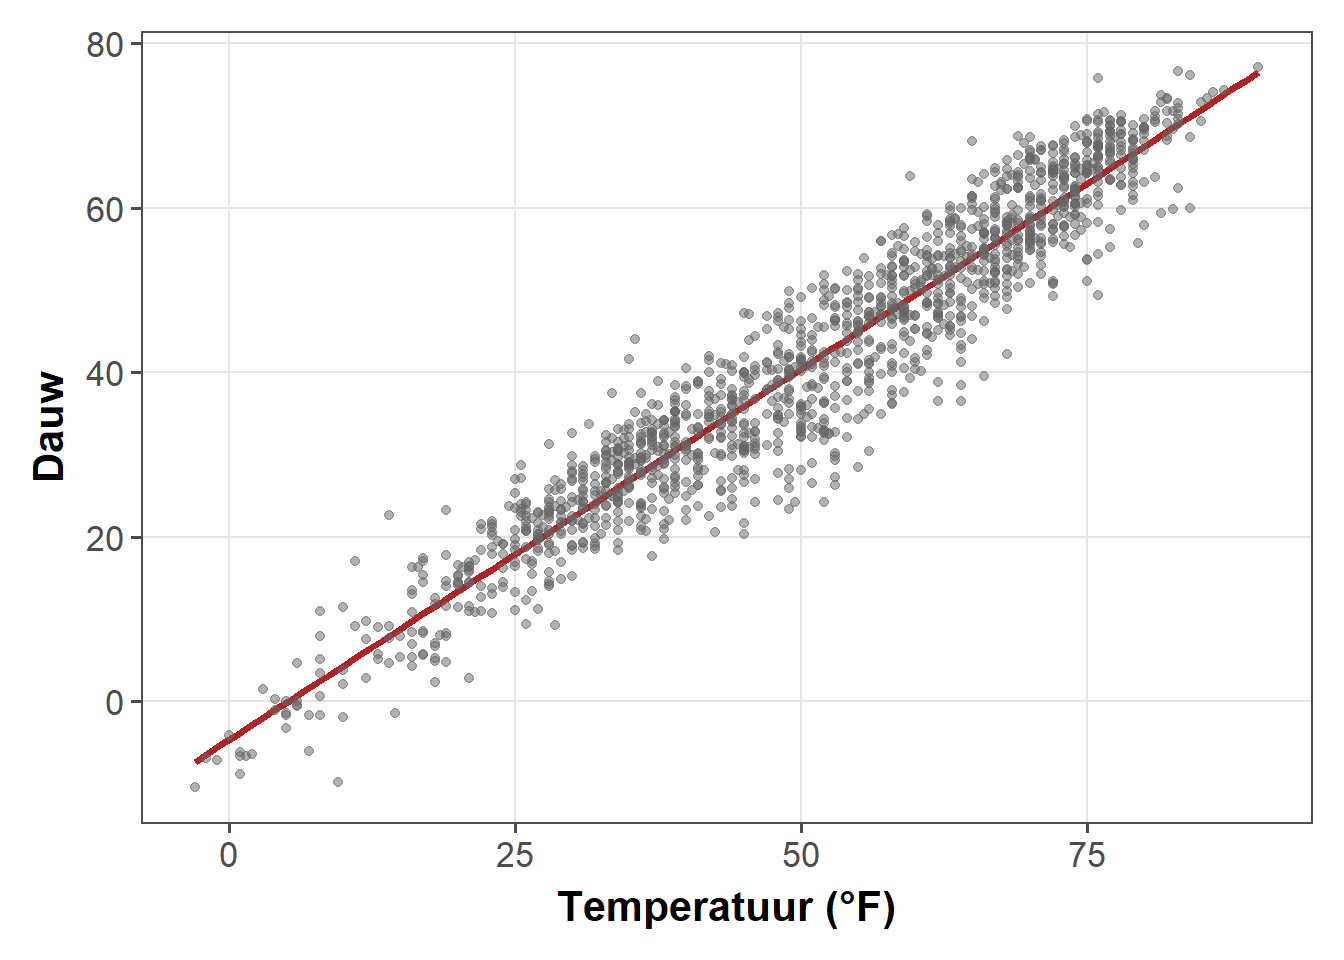
De formule voor afvlakken specificeren
Met ggplot2 kunt u het model opgeven dat u wilt gebruiken. Misschien wilt u een polynomiale regressie?
ggplot(chic, aes(x = o3, y = temp))+
labs(x = "Ozonniveau", y = "Temperatuur (°F)") +
geom_smooth(
method = "lm",
formula = y ~ x + I(x^2) + I(x^3) + I(x^4) + I(x^5),
color = "black",
fill = "firebrick"
) +
geom_point(color = "gray40", alpha = .3)Warning in grid.Call(C_textBounds, as.graphicsAnnot(x$label), x$x, x$y, : font
family not found in Windows font database
Warning in grid.Call(C_textBounds, as.graphicsAnnot(x$label), x$x, x$y, : font
family not found in Windows font database
Warning in grid.Call(C_textBounds, as.graphicsAnnot(x$label), x$x, x$y, : font
family not found in Windows font database
Warning in grid.Call(C_textBounds, as.graphicsAnnot(x$label), x$x, x$y, : font
family not found in Windows font database
Warning in grid.Call(C_textBounds, as.graphicsAnnot(x$label), x$x, x$y, : font
family not found in Windows font database
Warning in grid.Call(C_textBounds, as.graphicsAnnot(x$label), x$x, x$y, : font
family not found in Windows font database
Warning in grid.Call(C_textBounds, as.graphicsAnnot(x$label), x$x, x$y, : font
family not found in Windows font databaseWarning in grid.Call.graphics(C_text, as.graphicsAnnot(x$label), x$x, x$y, :
font family not found in Windows font database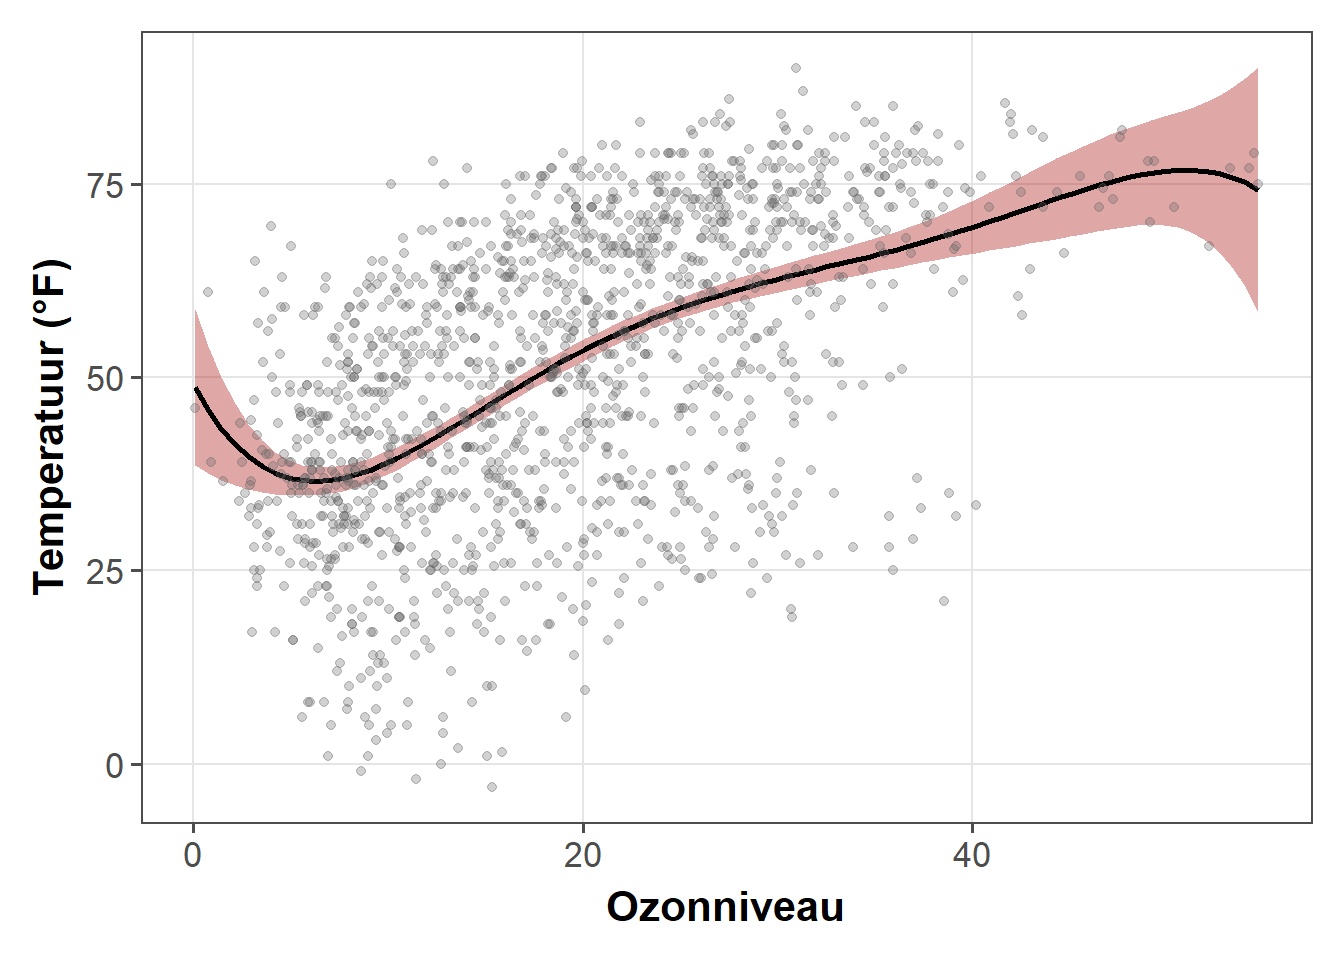
Huh,
geom_smooth()? Er is een belangrijk verschil tussengeomenstatlagen, maar hier maakt het echt niet uit welke je gebruikt. Vergroot om beide te vergelijken.
Laten we zeggen dat je de GAM-dimensie wilt vergroten (wat extra wiggles toevoegen aan de smooth):
cols <- c("darkorange2", "firebrick", "dodgerblue3")
ggplot(chic, aes(x = date, y = temp)) +
geom_point(color = "gray40", alpha = .3) +
labs(x = "Jaar", y = "Temperatuur (°F)") +
stat_smooth(aes(col = "1000"),
method = "gam",
formula = y ~ s(x, k = 1000),
se = FALSE, size = 1.3) +
stat_smooth(aes(col = "100"),
method = "gam",
formula = y ~ s(x, k = 100),
se = FALSE, size = 1) +
stat_smooth(aes(col = "10"),
method = "gam",
formula = y ~ s(x, k = 10),
se = FALSE, size = .8) +
scale_color_manual(name = "k", values = cols)Warning in grid.Call(C_textBounds, as.graphicsAnnot(x$label), x$x, x$y, : font
family not found in Windows font database
Warning in grid.Call(C_textBounds, as.graphicsAnnot(x$label), x$x, x$y, : font
family not found in Windows font database

Warning in grid.Call(C_textBounds, as.graphicsAnnot(x$label), x$x, x$y, : font
family not found in Windows font database

Warning in grid.Call(C_textBounds, as.graphicsAnnot(x$label), x$x, x$y, : font
family not found in Windows font database

Warning in grid.Call(C_textBounds, as.graphicsAnnot(x$label), x$x, x$y, : font
family not found in Windows font database

Warning in grid.Call(C_textBounds, as.graphicsAnnot(x$label), x$x, x$y, : font
family not found in Windows font database

Warning in grid.Call(C_textBounds, as.graphicsAnnot(x$label), x$x, x$y, : font
family not found in Windows font database

Warning in grid.Call(C_textBounds, as.graphicsAnnot(x$label), x$x, x$y, : font
family not found in Windows font database
Warning in grid.Call(C_textBounds, as.graphicsAnnot(x$label), x$x, x$y, : font
family not found in Windows font databaseWarning in grid.Call.graphics(C_text, as.graphicsAnnot(x$label), x$x, x$y, :
font family not found in Windows font databaseWarning in grid.Call(C_textBounds, as.graphicsAnnot(x$label), x$x, x$y, : font
family not found in Windows font database
Warning in grid.Call(C_textBounds, as.graphicsAnnot(x$label), x$x, x$y, : font
family not found in Windows font database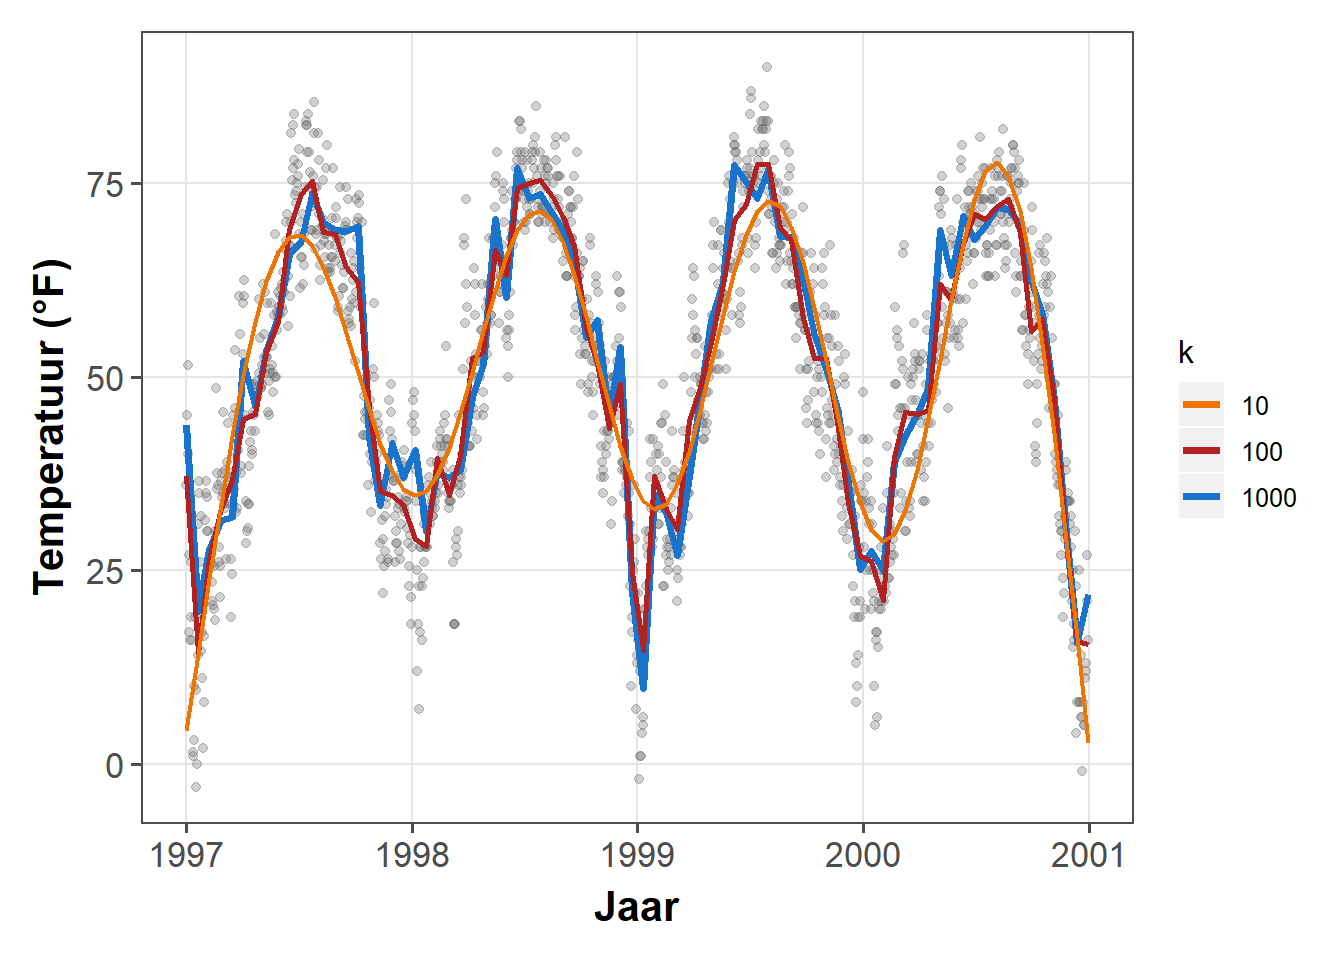
Werken met interactieve diagrammen
De volgende verzameling bevat bibliotheken die kunnen worden gebruikt in combinatie met ggplot2 of op zichzelf om interactieve visualisaties te maken in R (vaak gebruikmakend van bestaande JavaScript bibliotheken).
Combinatie van {ggplot2} en {shiny}
shiny is een pakket van RStudio dat het ongelooflijk gemakkelijk maakt om interactieve webapplicaties te bouwen met R. Voor een introductie en live voorbeelden, bezoek de Shiny homepage.
Om de gebruiksmogelijkheden te bekijken, kun je de Hello Shiny voorbeelden bekijken. Dit is de eerste:
# Dit moet je zelf even runnen
library(shiny)
runExample("01_hello")Natuurlijk kun je ggplots gebruiken in deze apps. Dit voorbeeld demonstreert de mogelijkheid om wat interactieve gebruikerservaring toe te voegen:
#Deze ook
runExample("04_mpg")Plot.ly via plotly en ggplot2
Plot.ly is een tool voor het maken van online, interactieve grafieken en web apps. Met het plotly pakket kunt je deze direct vanuit uw ggplot2 plots maken en de workflow is verrassend eenvoudig en kan worden gedaan vanuit R. Het is echter mogelijk dat sommige van uw thema-instellingen worden gewijzigd en achteraf handmatig moeten worden aangepast. Ook is het helaas niet eenvoudig om facets of echte multi-panel plots te maken die mooi schalen.
g <- ggplot(chic, aes(date, temp)) +
geom_line(color = "grey") +
geom_point(aes(color = season)) +
scale_color_brewer(palette = "Dark2", guide = "none") +
labs(x = NULL, y = "Temperatuur (°F)") +
theme_bw()library(plotly)
ggplotly(g)Hier, bijvoorbeeld, behoudt het de algemene thema-instelling maar voegt de legende opnieuw toe.
ggiraph en ggplot2
ggiraph is een R pakket waarmee je dynamische ggplot2 grafieken kunt maken. Hiermee kun je tooltips, animaties en JavaScript acties aan de grafieken toevoegen. Het pakket maakt het ook mogelijk om grafische elementen te selecteren bij gebruik in Shiny applicaties.
library(ggiraph)
g <- ggplot(chic, aes(date, temp)) +
geom_line(color = "grey") +
geom_point_interactive(
aes(color = season, tooltip = season, data_id = season)
) +
scale_color_brewer(palette = "Dark2", guide = "none") +
labs(x = NULL, y = "Temperatuur (°F)") +
theme_bw()
girafe(ggobj = g)Highcharts via highcharter
Highcharts, een software bibliotheek voor interactieve grafieken, is een andere visualisatie bibliotheek geschreven in puur JavaScript dat is overgezet naar R. Het pakket highcharter maakt het mogelijk om ze te gebruiken-maar wees ervan bewust dat Highcharts alleen gratis is in geval van niet-commercieel gebruik.
library(highcharter)
hchart(chic, "scatter", hcaes(x = date, y = temp, group = season))Echarts via echarts4r
Apache ECharts is een gratis, krachtige bibliotheek voor grafieken en visualisatie die een eenvoudige manier biedt om intuïtieve, interactieve en sterk aanpasbare grafieken te bouwen. Hoewel het is geschreven in JavaScript, kan men het gebruiken in R via de echarts4r library met dank aan John Coene. Bekijk de indrukwekkende voorbeeld galerij of deze twee apps (App 1 en App 2) die gebruik maken van de echarts4r functionaliteit.
library(echarts4r)
chic %>%
e_charts(date) %>%
e_scatter(temp, symbol_size = 7) %>%
e_visual_map(temp) %>%
e_y_axis(name = "Temperatuur (°F)") %>%
e_legend(FALSE)Chart.js via charter
charter is een ander pakket ontwikkeld door John Coene dat het gebruik van een JavaScript visualisatie bibliotheek in R mogelijk maakt. Het pakket maakt het mogelijk om interactieve plots te bouwen met behulp van het Charts.js framework.
library(charter)
# This example doesn't work in RMarkdown
chic$date_num <- as.numeric(chic$date)
## doesn't work with class date
chart(data = chic, caes(date_num, temp)) %>%
c_scatter(caes(color = season, group = season)) %>%
c_colors(RColorBrewer::brewer.pal(4, name = "Dark2"))Opmerkingen, tips & hulpbronnen
ggplot2 gebruiken in lussen en functies
De raster-gebaseerde grafische functies in lattice en ggplot2 maken een grafiek object. Wanneer je deze functies interactief gebruikt op de command line, wordt het resultaat automatisch afgedrukt, maar in source() of binnen je eigen functies heb je een expliciet print() statement nodig, d.w.z. print(g) in de meeste van onze voorbeelden. Zie ook de [Q&A pagina van R}(https://cran.r-project.org/doc/FAQ/R-FAQ.html#Why-do-lattice_002ftrellis-graphics-not-work_003f).
Aanvullende bronnen
ggplot2: Elegant Graphics for Data Analysis” van Hadley Wickham, verkrijgen via open-access!
- “Fundamentals of Data Visualization” by Claus O. Wilke over datavisualisatie in algemeen maar ook met gebruik van
ggplot2. (Je kunt de codes op zijn Github profile vinden.)
- “Cookbook for R” by Winston Chang met codes voor het produceren van R plots
- Gallerie van de Top 50 ggplot2 visualizations
- Gallerie van
ggplot2extensie pakketten
- How to extend
ggplot2by Hadley Wickham
- De fantastische R4DS Online Learning Community die hulp en begeleiding biedt voor alles wat te maken heeft met de inhoud van de “R for Data Science” book by Hadley Wickham
#TidyTuesday(https://github.com/rfordatascience/tidytuesday), een wekelijks sociaal data project met de nadruk op ggplots-check ook #TidyTuesday on Twitter and this collection of contributions by Neil Grantham
- Een tweedelige, 4.5-urige tutorialseries van Thomas Linn Pedersen ([Deel 1}(https://www.youtube.com/watch?v=h29g21z0a68) | Deel 2)